Download presentation
Presentation is loading. Please wait.

1
Common Core State Standards High Expectations 21 st Century Willard R. Daggett, CEO March 15, 2012

2
2 Performance Task drawn from the Ohio Performance Assessment Project.

3
3

4
4

5
School Improvement Changing World Schools are Improving

6
School Improvement Changing World Schools are Improving

7
School Improvement Changing World Schools are Improving

8
WHY – WHAT - HOW

9
AGENDA January 4 – WHY and WHAT March 15 – WHAT and HOW TO May 30 – Putting the Pieces Together

10
why – WHAT - how

11
AGENDA January 4 – WHY and WHAT March 15 – WHAT and HOW TO May 30 – Putting the Pieces Together

12
Reading Study Summary 600 800 1000 1400 1600 1200 Text Lexile Measure (L) High School Literature College Literature High School Textbooks College Textbooks Military Personal Use Entry-Level Occupations SAT 1, ACT, AP* * Source of National Test Data: MetaMetrics Interquartile Ranges Shown (25% - 75%)
 High School Literature College Literature High School Textbooks College Textbooks Military Personal Use Entry-Level Occupations SAT 1, ACT, AP* * Source of National Test Data: MetaMetrics Interquartile Ranges Shown (25% - 75%)")
13
Common Core State Standards Fewer Clearer Higher

14
2005 Proficiency Grade 4 Reading Proficient Required NAEP Score Mississippi 88 % Georgia 87 % North Carolina 82 % Texas 81 % Ohio 77 % Florida 71% Arkansas 53 % Massachusetts 48 %

15
2009 Proficiency Grade 4 Reading Proficient Required NAEP Score Georgia 87 % Texas 84 % Ohio 82 % Florida 74% Arkansas 70 % North Carolina 69 % Massachusetts 54 % Mississippi 52 %

16
2005 Proficiency Grade 4 Reading Proficient Required NAEP Score Mississippi 88 %161 Georgia 87 %175 North Carolina 82 %183 Texas 81 %190 Ohio 77 %199 Florida 71%202 Arkansas 53 %217 Massachusetts 48 %234

17
2009 Proficiency Grade 4 Reading Proficient Required NAEP Score Georgia 87 %178 Texas 84 %188 Ohio 82 %192 Florida 74%206 Arkansas 70 %200 North Carolina 69 %204 Massachusetts 54 %234 Mississippi 52 %210

18
2009 Proficiency Grade 4 Reading Proficient Required NAEP Score Georgia 87 % (0)178 (+3) Texas 84 % (+3)188 (-2) Ohio 82 % (+5)192 (-7) Florida 74% (+3)206 (+4) Arkansas 70 % (+17)200 (-17) North Carolina 69 % (-13)204 (+21) Massachusetts 54 % (+6)234 (0) Mississippi 52 % (-36)210 (+49)
178 (+3) Texas 84 % (+3)188 (-2) Ohio 82 % (+5)192 (-7) Florida 74% (+3)206 (+4) Arkansas 70 % (+17)200 (-17) North Carolina 69 % (-13)204 (+21) Massachusetts 54 % (+6)234 (0) Mississippi 52 % (-36)210 (+49)")
19
2009 Proficiency Grade 8 Reading Proficient Required NAEP Score Texas 94 % (+11)201 (-24) Georgia 77 % (-6)209 (-15) Ohio 72 % (-8)251 (+10) Arkansas 71 % (+14)241 (-13) North Carolina 66 % (-22)246 (+29) Florida 54 % (+10)262 (-3) Mississippi 48 % (-10)254 (+7) California 48 % (+9)259 (-3)
201 (-24) Georgia 77 % (-6)209 (-15) Ohio 72 % (-8)251 (+10) Arkansas 71 % (+14)241 (-13) North Carolina 66 % (-22)246 (+29) Florida 54 % (+10)262 (-3) Mississippi 48 % (-10)254 (+7) California 48 % (+9)259 (-3)")
20
2009 Proficiency Grade 4 Mathematics Proficient Required NAEP Score North Carolina 81 % (-10)220 (+17) Texas 85 % (+3)214 (-5) Mississippi 58 % (-21)223 (+17) Georgia 75 % (0)218 (+3) Ohio 78 % (+13)219 (-14) Florida 75 % (+12)225 (-5) Arkansas 78 % (+25)216 (-20) Massachusetts 48 % (+9)255 (0)
220 (+17) Texas 85 % (+3)214 (-5) Mississippi 58 % (-21)223 (+17) Georgia 75 % (0)218 (+3) Ohio 78 % (+13)219 (-14) Florida 75 % (+12)225 (-5) Arkansas 78 % (+25)216 (-20) Massachusetts 48 % (+9)255 (0)")
21
2009 Proficiency Grade 8 Mathematics Proficient Required NAEP Score Texas 83 % (+22)254 (-19) Georgia 81 % (+12)247 (-8) North Carolina 80 % (-4)253 (+6) Florida 66 % (+8)266 (-3) Ohio 59 % (+8)269 (-9) Arkansas 61 % (+27)267 (-21) Mississippi 54 % (+1)264 (+2) Massachusetts 49 % (+7)300 (-1)
254 (-19) Georgia 81 % (+12)247 (-8) North Carolina 80 % (-4)253 (+6) Florida 66 % (+8)266 (-3) Ohio 59 % (+8)269 (-9) Arkansas 61 % (+27)267 (-21) Mississippi 54 % (+1)264 (+2) Massachusetts 49 % (+7)300 (-1)")
22
Common Core State Standards Fewer Clearer Higher Different

23
1 2 3 4 5 Blooms CDCDABABCDCDABAB 4 5 6 3 2 1 Application Levels

24
Knowledge Taxonomy 1.Awareness 2.Comprehension 3.Application 4.Analysis 5.Synthesis 6.Evaluation

25
Application Model 1.Knowledge in one discipline 2.Application within discipline 3.Application across disciplines 4.Application to real-world predictable situations 5.Application to real-world unpredictable situations

26
1 2 3 4 5 Blooms CDCDABABCDCDABAB 4 5 6 3 2 1 Application Levels

27
1 2 3 4 5 6 12345 A B D C Rigor/Relevance Framework Express probabilities as fractions, percents, or decimals. Classify triangles according to angle size and/or length of sides. Calculate volume of simple three- dimensional shapes. Given the coordinates of a quadrilateral, plot the quadrilateral on a grid. Analyze the graphs of the perimeters and areas of squares having different-length sides. Determine the largest rectangular area for a fixed perimeter. Identify coordinates for ordered pairs that satisfy an algebraic relation or function. Determine and justify the similarity or congruence for two geometric shapes. Obtain historical data about local weather to predict the chance of snow, rain, or sun during year. Test consumer products and illustrate the data graphically. Plan a large school event and calculate resources (food, decorations, etc.) you need to organize and hold this event. Make a scale drawing of the classroom on grid paper, each group using a different scale. Calculate percentages of advertising in a newspaper. Tour the school building and identify examples of parallel and perpendicular lines, planes, and angles. Determine the median and mode of real data displayed in a histogram Organize and display collected data, using appropriate tables, charts, or graphs.
 you need to organize and hold this event. Make a scale drawing of the classroom on grid paper, each group using a different scale. Calculate percentages of advertising in a newspaper. Tour the school building and identify examples of parallel and perpendicular lines, planes, and angles. Determine the median and mode of real data displayed in a histogram Organize and display collected data, using appropriate tables, charts, or graphs..")
28
1 2 3 4 5 6 12345 A B D C Analyze the graphs of the perimeters and areas of squares having different-length sides. Determine the largest rectangular area for a fixed perimeter. Identify coordinates for ordered pairs that satisfy an algebraic relation or function. Determine and justify the similarity or congruence for two geometric shapes. Obtain historical data about local weather to predict the chance of snow, rain, or sun during year. Test consumer products and illustrate the data graphically. Plan a large school event and calculate resources (food, decorations, etc.) you need to organize and hold this event. Make a scale drawing of the classroom on grid paper, each group using a different scale. Calculate percentages of advertising in a newspaper. Tour the school building and identify examples of parallel and perpendicular lines, planes, and angles. Determine the median and mode of real data displayed in a histogram Organize and display collected data, using appropriate tables, charts, or graphs. Express probabilities as fractions, percents, or decimals. Classify triangles according to angle size and/or length of sides. Calculate volume of simple three- dimensional shapes. Given the coordinates of a quadrilateral, plot the quadrilateral on a grid. Rigor/Relevance Framework
 you need to organize and hold this event. Make a scale drawing of the classroom on grid paper, each group using a different scale. Calculate percentages of advertising in a newspaper. Tour the school building and identify examples of parallel and perpendicular lines, planes, and angles. Determine the median and mode of real data displayed in a histogram Organize and display collected data, using appropriate tables, charts, or graphs. Express probabilities as fractions, percents, or decimals. Classify triangles according to angle size and/or length of sides. Calculate volume of simple three- dimensional shapes. Given the coordinates of a quadrilateral, plot the quadrilateral on a grid. Rigor/Relevance Framework.")
29
1 2 3 4 5 6 12345 A B D C Express probabilities as fractions, percents, or decimals. Classify triangles according to angle size and/or length of sides. Calculate volume of simple three- dimensional shapes. Given the coordinates of a quadrilateral, plot the quadrilateral on a grid. Analyze the graphs of the perimeters and areas of squares having different-length sides. Determine the largest rectangular area for a fixed perimeter. Identify coordinates for ordered pairs that satisfy an algebraic relation or function. Determine and justify the similarity or congruence for two geometric shapes. Obtain historical data about local weather to predict the chance of snow, rain, or sun during year. Test consumer products and illustrate the data graphically. Plan a large school event and calculate resources (food, decorations, etc.) you need to organize and hold this event. Make a scale drawing of the classroom on grid paper, each group using a different scale. Calculate percentages of advertising in a newspaper. Tour the school building and identify examples of parallel and perpendicular lines, planes, and angles. Determine the median and mode of real data displayed in a histogram. Organize and display collected data, using appropriate tables, charts, or graphs. Rigor/Relevance Framework
 you need to organize and hold this event. Make a scale drawing of the classroom on grid paper, each group using a different scale. Calculate percentages of advertising in a newspaper. Tour the school building and identify examples of parallel and perpendicular lines, planes, and angles. Determine the median and mode of real data displayed in a histogram. Organize and display collected data, using appropriate tables, charts, or graphs. Rigor/Relevance Framework.")
30
30 Performance Task drawn from the Ohio Performance Assessment Project.

31
31 Performance Task drawn from the Ohio Performance Assessment Project.

32
32 Performance Task drawn from the Ohio Performance Assessment Project.

33
Fannin County Schools March 15, 2012 Ashley Terwilliger

34
SPN is a not-for-profit membership organization that supports a network of individual educators and member schools committed to building national model schools of excellence. SPN and our members are committed to rigor and relevance for all children, with a focus on enhancing student engagement and improving student achievement.

35
About the Network 18,000+ Educators 42 States Nationwide 6,000 Monthly visits to members-only website 2,000 + Gold Seal Lessons and growing 50 Coaches/Experienced Educators Online tools for effective instruction

37
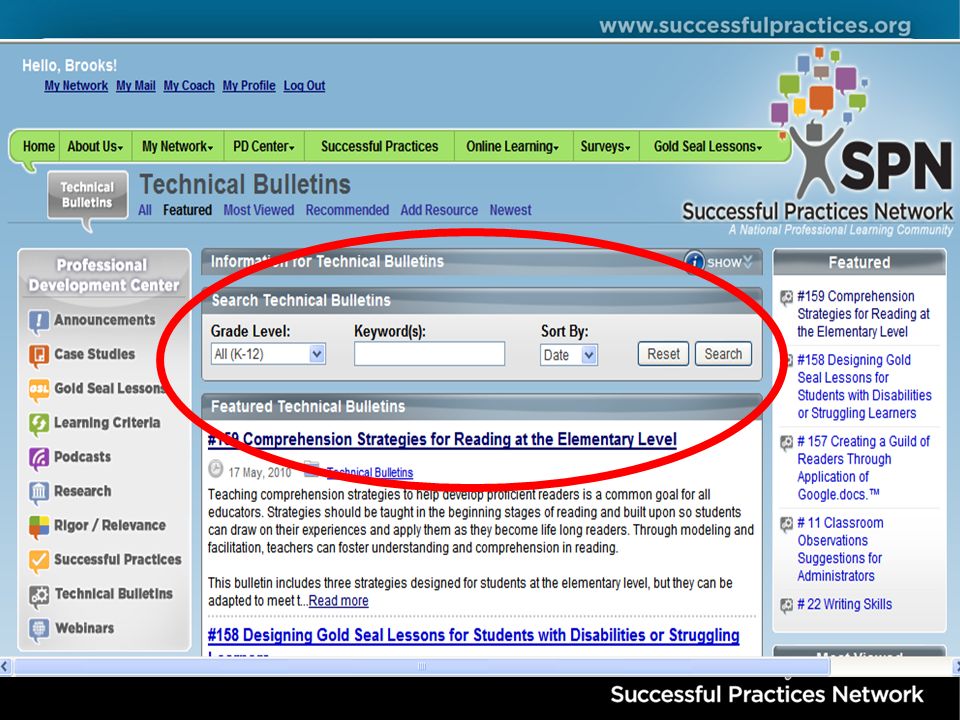
www.successfulpractices.org Your full email address (asmith@fannin.k12.ga.us)asmith@fannin.k12.ga.us SPN2008 (case sensitive)
")
39
Alignments in Next Navigator Common Core State Standards (CCSS) Current state standards NGA Assessment Items Common Core State Standards (CCSS) 1.2.3.
 Current state standards NGA Assessment Items Common Core State Standards (CCSS)")
40
Developed by: Your state standard Aligned Common Core State Standard (CCSS)
")
41
Developed by: Corresponding Next Generation Assessment (NGA) sample Priority as ranked by the National Essential Skills Survey (NESS) Priority on your state test
 sample Priority as ranked by the National Essential Skills Survey (NESS) Priority on your state test")
42
Developed by: Description of NGA Primary Common Core State Standards tested by the NGA Other related CCSS tested by the NGA

43
Developed by:

44
next|toolkit

45
Developed by: Student VersionTeacher Version

46
Copies of NGA samples & NGAs youve created and shared Folders Links Additional Files (images, pdfs, powerpoints...) Developed by:
 Developed by:")
48
2,000 + Lessons, K-12 in all subject areas

49
Searchable by grade, subject, topics, keywords and Common Core Strand

50
Gold Seal Lesson Title: Chemistrymatch.com Subject(s): Chemistry, English Grade(s): 10-12 Overview Students will work individually to create a dating advertisement for an element. The dating advertisement will be in multimedia format and will include pictures, text, and audio. They will use the information they have learned about families, valence electrons, oxidation numbers, and bonding to create this advertisement. Students will also conduct internet research for any assistance they may need.

51
Gold Seal Lesson Title: To: Cinderella Subject(s): English, Social Studies Grade(s): 3-4 Overview Students will compare and contrast Cinderella stories from different cultures. Students will then decide what gift could be given to Cinderella that would help her with the common situation faced in each version of the story. Students will then write their own version of the Cinderella story incorporating the gift.

55
Videocasts Throughout the Year

56
SPN Webinars Examples Integrating Literacy Strategies into to Gold Seal Lessons Sticky Test-Taking Strategies Accommodating Gender Difference in the Classroom Easing the Transition into 9 th Grade Financial Literacy for Teens

57
Model Schools Conference Case Study Archives

58
Case Study

60
Successful Practices Examples Search on keywords Professional Learning Community 76 Hits Student Leadership Learning Styles Inventory School Wide Small Learning Community Comprehensive k-12 Literacy Plan Career Corner

61
For more information about SPN: www.successfulpractices.org Ashley@spnet.us 518-723-2063

62
Next Navigator

Similar presentations