Download presentation
Presentation is loading. Please wait.


1
Verona Area School District Willard R. Daggett, CEO July 18, 2012

2
School Improvement Growing Gap Readiness Changing World

3
1.Standards will be higher Challenges

4
1.Standards will be higher 2.Standards will be different Challenges

5
1.Standards will be higher 2.Standards will be different 3.Student growth Challenges

6
1.Standards will be higher 2.Standards will be different 3.Student growth 4.Good to Great Challenges

7
1.Standards will be higher 2.Standards will be different 3.Student growth 4.Good to Great 5.Financial stress Challenges

8
1.Standards will be higher Challenges

9
600 800 1000 1400 1600 1200 Text Lexile Measure (L) High School Literature College Literature High School Textbooks College Textbooks Military Personal Use Entry-Level Occupations SAT 1, ACT, AP* * Source of National Test Data: MetaMetrics Reading Study Summary Interquartile Ranges Shown (25% - 75%)
 High School Literature College Literature High School Textbooks College Textbooks Military Personal Use Entry-Level Occupations SAT 1, ACT, AP* * Source of National Test Data: MetaMetrics Reading Study Summary Interquartile Ranges Shown (25% - 75%)")
10
2005 Proficiency Grade 4 Reading Proficient Required NAEP Score Mississippi 88 % Georgia 87 % Wisconsin 83 % Texas 81 % Ohio 77 % Florida 71% Arkansas 53 % Massachusetts 48 %

11
2009 Proficiency Grade 4 Reading Proficient Required NAEP Score Georgia 87 % Texas 84 % Ohio 82 % Wisconsin 82 % Florida 74% Arkansas 70 % Massachusetts 54 % Mississippi 52 %

12
2005 Proficiency Grade 4 Reading Proficient Required NAEP Score Mississippi 88 %161 Georgia 87 %175 Wisconsin 82 %189 Texas 81 %190 Ohio 77 %199 Florida 71%202 Arkansas 53 %217 Massachusetts 48 %234

13
2009 Proficiency Grade 4 Reading Proficient Required NAEP Score Georgia 87 %178 Texas 84 %188 Ohio 82 %192 Wisconsin 82 %189 Florida 74%206 Arkansas 70 %200 Massachusetts 54 %234 Mississippi 52 %210

14
2009 Proficiency Grade 4 Reading Proficient Required NAEP Score Georgia 87 % (0)178 (+3) Texas 84 % (+3)188 (-2) Ohio 82 % (+5)192 (-7) Wisconsin 82 % (-1)189 (0) Florida 74% (+3)206 (+4) Arkansas 70 % (+17)200 (-17) Massachusetts 54 % (+6)234 (0) Mississippi 52 % (-36)210 (+49)
178 (+3) Texas 84 % (+3)188 (-2) Ohio 82 % (+5)192 (-7) Wisconsin 82 % (-1)189 (0) Florida 74% (+3)206 (+4) Arkansas 70 % (+17)200 (-17) Massachusetts 54 % (+6)234 (0) Mississippi 52 % (-36)210 (+49)")
15
2009 Proficiency Grade 8 Reading Proficient Required NAEP Score Texas 94 % (+11)201 (-24) Wisconsin 85 % (-1)232 (+3) Georgia 77 % (-6)209 (-15) Ohio 72 % (-8)251 (+10) Arkansas 71 % (+14)241 (-13) Florida 54 % (+10)262 (-3) Mississippi 48 % (-10)254 (+7) California 48 % (+9)259 (-3)
201 (-24) Wisconsin 85 % (-1)232 (+3) Georgia 77 % (-6)209 (-15) Ohio 72 % (-8)251 (+10) Arkansas 71 % (+14)241 (-13) Florida 54 % (+10)262 (-3) Mississippi 48 % (-10)254 (+7) California 48 % (+9)259 (-3)")
16
2009 Proficiency Grade 4 Mathematics Proficient Required NAEP Score Texas 85 % (+3)214 (-5) Wisconsin 81 % (+7)219 (-6) Mississippi 58 % (-21)223 (+17) Georgia 75 % (0)218 (+3) Ohio 78 % (+13)219 (-14) Florida 75 % (+12)225 (-5) Arkansas 78 % (+25)216 (-20) Massachusetts 48 % (+9)255 (0)
214 (-5) Wisconsin 81 % (+7)219 (-6) Mississippi 58 % (-21)223 (+17) Georgia 75 % (0)218 (+3) Ohio 78 % (+13)219 (-14) Florida 75 % (+12)225 (-5) Arkansas 78 % (+25)216 (-20) Massachusetts 48 % (+9)255 (0)")
17
2009 Proficiency Grade 8 Mathematics Proficient Required NAEP Score Texas 83 % (+22)254 (-19) Georgia 81 % (+12)247 (-8) Wisconsin 79 % (+4)262 (-1) Florida 66 % (+8)266 (-3) Ohio 59 % (+8)269 (-9) Arkansas 61 % (+27)267 (-21) Mississippi 54 % (+1)264 (+2) Massachusetts 49 % (+7)300 (-1)
254 (-19) Georgia 81 % (+12)247 (-8) Wisconsin 79 % (+4)262 (-1) Florida 66 % (+8)266 (-3) Ohio 59 % (+8)269 (-9) Arkansas 61 % (+27)267 (-21) Mississippi 54 % (+1)264 (+2) Massachusetts 49 % (+7)300 (-1)")
18
1.Standards will be higher 2.Standards will be different Challenges

19
1.Knowledge in one discipline 2.Application within discipline 3.Application across disciplines 4.Application to real-world predictable situations 5.Application to real-world unpredictable situations Application Model

20
1.Standards will be higher 2.Standards will be different 3.Student growth Challenges

21
1.Standards will be higher 2.Standards will be different 3.Student growth 4.Good to Great Challenges

22
1.Standards will be higher 2.Standards will be different 3.Student growth 4.Good to Great 5.Financial stress Challenges

23
School Improvement Growing Gap Changing World

24
School Improvement Growing Gap Changing World

25
School Improvement Growing Gap Changing World

26
1.Knowledge in one discipline 2.Application within discipline 3.Application across disciplines 4.Application to real-world predictable situations 5.Application to real-world unpredictable situations Application Model

27
1.Awareness 2.Comprehension 3.Application 4.Analysis 5.Synthesis 6.Evaluation Knowledge Taxonomy

28
Levels 1 2 3 4 5 Blooms CDCDABABCDCDABAB 4 5 6 3 2 1 Application

29
Rigor/Relevance Framework 1 2 3 4 5 6 12345 A B D C Express probabilities as fractions, percents, or decimals. Classify triangles according to angle size and/or length of sides. Calculate volume of simple three- dimensional shapes. Given the coordinates of a quadrilateral, plot the quadrilateral on a grid. Analyze the graphs of the perimeters and areas of squares having different-length sides. Determine the largest rectangular area for a fixed perimeter. Identify coordinates for ordered pairs that satisfy an algebraic relation or function. Determine and justify the similarity or congruence for two geometric shapes. Obtain historical data about local weather to predict the chance of snow, rain, or sun during year. Test consumer products and illustrate the data graphically. Plan a large school event and calculate resources (food, decorations, etc.) you need to organize and hold this event. Make a scale drawing of the classroom on grid paper, each group using a different scale. Calculate percentages of advertising in a newspaper. Tour the school building and identify examples of parallel and perpendicular lines, planes, and angles. Determine the median and mode of real data displayed in a histogram Organize and display collected data, using appropriate tables, charts, or graphs.
 you need to organize and hold this event. Make a scale drawing of the classroom on grid paper, each group using a different scale. Calculate percentages of advertising in a newspaper. Tour the school building and identify examples of parallel and perpendicular lines, planes, and angles. Determine the median and mode of real data displayed in a histogram Organize and display collected data, using appropriate tables, charts, or graphs..")
30
Rigor/Relevance Framework 1 2 3 4 5 6 12345 A B D C Analyze the graphs of the perimeters and areas of squares having different-length sides. Determine the largest rectangular area for a fixed perimeter. Identify coordinates for ordered pairs that satisfy an algebraic relation or function. Determine and justify the similarity or congruence for two geometric shapes. Obtain historical data about local weather to predict the chance of snow, rain, or sun during year. Test consumer products and illustrate the data graphically. Plan a large school event and calculate resources (food, decorations, etc.) you need to organize and hold this event. Make a scale drawing of the classroom on grid paper, each group using a different scale. Calculate percentages of advertising in a newspaper. Tour the school building and identify examples of parallel and perpendicular lines, planes, and angles. Determine the median and mode of real data displayed in a histogram Organize and display collected data, using appropriate tables, charts, or graphs. Express probabilities as fractions, percents, or decimals. Classify triangles according to angle size and/or length of sides. Calculate volume of simple three- dimensional shapes. Given the coordinates of a quadrilateral, plot the quadrilateral on a grid.
 you need to organize and hold this event. Make a scale drawing of the classroom on grid paper, each group using a different scale. Calculate percentages of advertising in a newspaper. Tour the school building and identify examples of parallel and perpendicular lines, planes, and angles. Determine the median and mode of real data displayed in a histogram Organize and display collected data, using appropriate tables, charts, or graphs. Express probabilities as fractions, percents, or decimals. Classify triangles according to angle size and/or length of sides. Calculate volume of simple three- dimensional shapes. Given the coordinates of a quadrilateral, plot the quadrilateral on a grid..")
31
Rigor/Relevance Framework 1 2 3 4 5 6 12345 A B D C Express probabilities as fractions, percents, or decimals. Classify triangles according to angle size and/or length of sides. Calculate volume of simple three- dimensional shapes. Given the coordinates of a quadrilateral, plot the quadrilateral on a grid. Analyze the graphs of the perimeters and areas of squares having different-length sides. Determine the largest rectangular area for a fixed perimeter. Identify coordinates for ordered pairs that satisfy an algebraic relation or function. Determine and justify the similarity or congruence for two geometric shapes. Obtain historical data about local weather to predict the chance of snow, rain, or sun during year. Test consumer products and illustrate the data graphically. Plan a large school event and calculate resources (food, decorations, etc.) you need to organize and hold this event. Make a scale drawing of the classroom on grid paper, each group using a different scale. Calculate percentages of advertising in a newspaper. Tour the school building and identify examples of parallel and perpendicular lines, planes, and angles. Determine the median and mode of real data displayed in a histogram. Organize and display collected data, using appropriate tables, charts, or graphs.
 you need to organize and hold this event. Make a scale drawing of the classroom on grid paper, each group using a different scale. Calculate percentages of advertising in a newspaper. Tour the school building and identify examples of parallel and perpendicular lines, planes, and angles. Determine the median and mode of real data displayed in a histogram. Organize and display collected data, using appropriate tables, charts, or graphs..")
32
A B D C

33
Action Plan

34
A Look to the Future

35
Common Core State Standards, Next Generation Assessments and Teacher Evaluation Three Central Challenges

36
Common Core State Standards, Next Generation Assessments and Teacher Evaluation Financial Stress Three Central Challenges

37
Schools must find new and innovative ways to improve student performance with increasingly fewer resources.

38
A Look to the Future More with Less

39
Effectiveness and Efficiency Framework High Cost Low Cost

40
High Cost Low Cost High Student Performance Low Student Performance EfEffecfecttivenessivenessEfEffecfecttivenessivenesst Effectiveness and Efficiency Framework

41
High Cost Low Cost High Student Performance Low Student Performance EfEffecfecttivenessivenessEfEffecfecttivenessivenesst Effectiveness and Efficiency Framework CDCDABABCDCDABAB

42
Common Core State Standards, Next Generation Assessments and Teacher Evaluation Financial Stress Change Three Central Challenges

43
Common Core State Standards, Next Generation Assessments and Teacher Evaluation Financial Stress Change Needs to be Evolutionary Not Revolutionary Three Central Challenges

44
School Improvement Growing Readiness Gap Readiness Changing World

45
It Will Require: Proactive Leadership Focused and Sustained Professional Development A Look to the Future

46
CCSS / NGA

47
1.Knowledge in one discipline 2.Application within discipline 3.Application across disciplines 4.Application to real-world predictable situations 5.Application to real-world unpredictable situations Application Model

48
Performance Task drawn from the Ohio Performance Assessment Project. Available at, www.ModelSchoolsConference.com/handouts12.html

49
A Look to the Future Will Require Proactive Leadership

50
Focused on CCSS, NGAs, and Teacher Evaluation Reactive Leader Proactive Leader Equally focused on Science, the Arts, CTE, Physical Education

51
A Look to the Future Will Require a Comprehensive Solution

57
Common Core State Standards, Next Generation Assessments and Teacher Evaluation Financial Stress Change Needs to be Evolutionary Not Revolutionary Three Central Challenges

58
3 2 1 1 – Incremental Change (Improving Core Practices) 2 – Innovative Change ( Fundamental Change of Core Practice) 3 – Transformational Change ( Affect Entire System) Evolution of Change Model
 2 – Innovative Change ( Fundamental Change of Core Practice) 3 – Transformational Change ( Affect Entire System) Evolution of Change Model")
59
3 2 1 1 – Saddle 2 – Horse and Wagon 3 – Car Transportation

60
The world in which our students will live and work A Look to the Future

61
Information is Everywhere…

62
1 1 – Google Search Smart Technology

63
Analyze Documents Keywords and Headers (Google) Meaning / Concepts Wolfram Alpha Siri Complete Task Semantic Web
 Meaning / Concepts Wolfram Alpha Siri Complete Task Semantic Web")
64
2 1 1 – Google Search 2 – Google Glasses Smart Technology

65
Technology should work for youto be there when you need it and get out of your way when you dont. Google X started Project Glass to build this kind of technology, one that helps you explore and share your world, putting you back in the moment. Project Glass

66
Download any movie, website, or piece of information into your glasses or contact lenses

67
Students will be able to surf the Internet via their contact lenses. How will you deal with this in your schools? In the Near Future…

68
Todays students live in a hyper-connected world, except in school OR are they also connected in school but we just dont know it?

69
Information is everywhere. In this changing world, sense-making and the ability to evaluate the credibility of information are paramount.

70
3 2 1 1 – Google Search 2 – Google Glasses 3 – Google Car Smart Technology

71
3 2 1 K-12 Education – High Impact Factors

72
The world in which our students will live and work Emerging resources A Look to the Future

73
Gaming Online Instruction Blended Learning K-12 Education – High Impact Factors

74
Gaming is increasingly being built based upon brain research.

75
Gaming is increasingly being built based upon brain research. What is the implication to education?

76
Downloaded 1 billion times Average of 800 bird launches per download Collectively 800 billion birds launched Over 600 million minutes played per day 400,000 years of time played Angry Birds

78
1 1 – Sushi Monster Game Theory in Education

79
Continuous improvement Immediate feedback Addictive Game-based Programs

80
How do you feel about students being addicted to learning?

81
Continuous improvement Immediate feedback Addictive Todays education games are often a technologically enhanced version of drill and practice Enabling more personalized learning Game-based Programs

82
650,000 Apps in the App Store

83
Personalization Technology Provides

84
Personalization Repetition Volume Technology Provides Critical to Move from Working to Stored Memory – Needed for Fluency

85
FASTT Math Next Generation 18 Games A Look to the Future

86
2 1 1 – Sushi Monster (FASTT Math Next Generation) Game Theory in Education
 Game Theory in Education")
87
A Look to the Future iRead

88
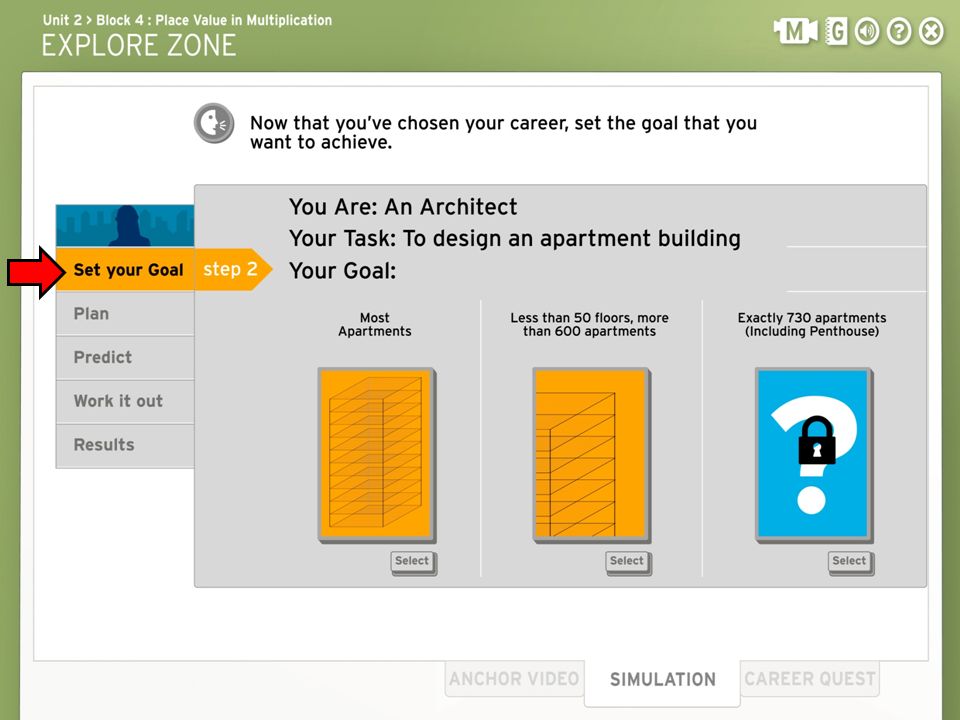
Beastie Hall - A School for Monsters iRead

90
Your Avatar…

91
Your Reading Buddy…

92
Beastie Hall - A School for Monsters Phonics iRead

94
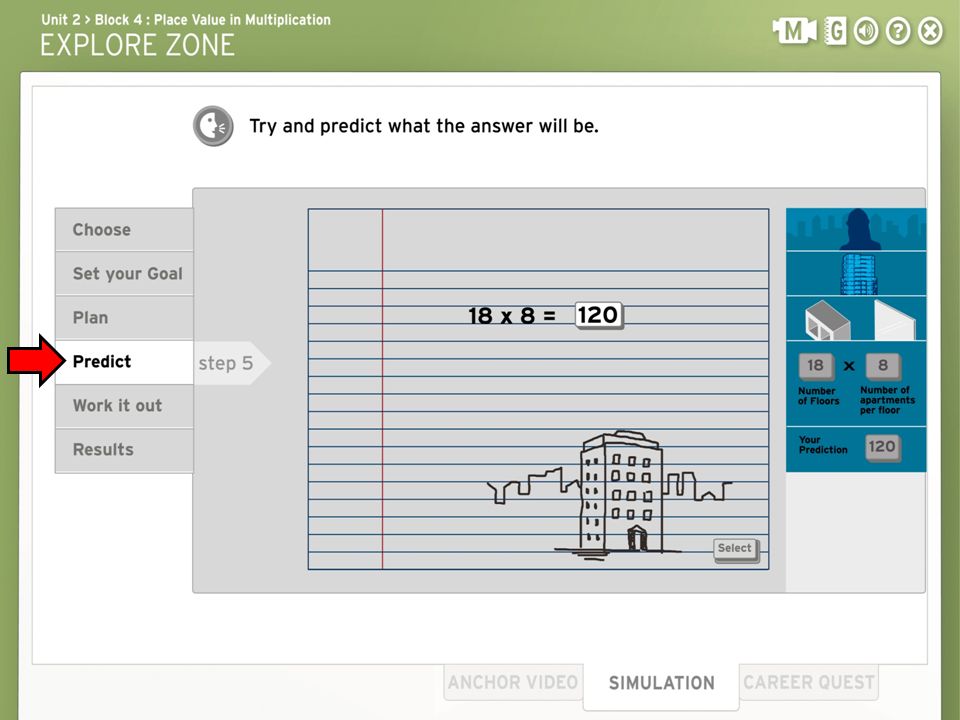
Beastie Hall - A School for Monsters Phonics Embedded Assessments iRead

95
2 1 1 – Sushi Monster (FASTT Math Next Generation) 2 – iRead Game Theory in Education
 2 – iRead Game Theory in Education")
96
2 1 1 – Sushi Monster (FASTT Math Next Generation) 2 – iRead - Math 180 Game Theory in Education
 2 – iRead - Math 180 Game Theory in Education")
97
Math 180 Scope and Sequence tied to CCSS Embedded Assessments like NGAs A Look to the Future

98
1.Knowledge in one discipline 2.Application within discipline 3.Application across disciplines 4.Application to real-world predictable situations 5.Application to real-world unpredictable situations Application Model

108
MCAT

109
Blended Model

110
Teachers

111
Guiding Principles Responsibility Contemplation Initiative Perseverance Optimism Courage Respect Compassion Adaptability Honesty Trustworthiness Loyalty

112
Teachers

113
1.Knowledge in one discipline 2.Application within discipline 3.Application across disciplines 4.Application to real-world predictable situations 5.Application to real-world unpredictable situations Application Model

114
Guiding Principles Responsibility Contemplation Initiative Perseverance Optimism Courage Respect Compassion Adaptability Honesty Trustworthiness Loyalty

115
Blended Model

116
Online Instruction

117
30 states have full-time online schools 96% of LEAs have students enrolled in distance education courses at the HS level Online Learning Facts

118
Fully online model - $6,400 Blended-learning model - $8,900 Traditional school model - $10,000 US Average per Pupil Expenditures

119
3 2 1 1 – Sushi Monster (FASTT MATH) 2 – iRead Math 180 3 – Online Game-based Learning Game Theory in Education
 2 – iRead Math – Online Game-based Learning Game Theory in Education")
120
A Look to the Future It Can be Done…

121
The world in which our students will live and work Emerging resources The nations most successful emerging practices A Look to the Future

122
3 2 1 1 – Computer Labs 2 – One-to-One Computing 3 – Bring Your Own Technology (BYOT) Technology in Schools
 Technology in Schools")
123
Pencil Budget

124
Instruction Professional Development Leadership Development Data Systems Technology is a Tool NOT a Function

125
Technology needs to do to education what it has done to countless other industries: Disrupt It

126
3 2 1 1 – Project-based Learning 2 – Flipped Classroom 3 – Online Game-based System Instruction

127
3 2 1 1 – Training all teachers to grade essays 2 – Computer grading of essays 3 – Computer-based grading and immediate instruction based on performance Grading of Papers

128
1 1 – Learning Together Learning

129
3 2 1 1 – Student-run technology P.D. (survey/3 levels) 2 – Teachers are given technology IEP with students as their mentors 3 – Top 1/3 rd students and teachers create alternative instructional delivery system Professional Development
 2 – Teachers are given technology IEP with students as their mentors 3 – Top 1/3 rd students and teachers create alternative instructional delivery system Professional Development.")
130
3 2 1 1 – Paper and Pencil Formative Assessments 2 – Gas Bill -Application based -Multi-disciplined -Quad D 3 – Tablets with instant computer-based scoring and instruction Assessments

131
1 1 – Status Report – gather and reflect on performance and value added data Use of Data

132
2 1 1 – Status Report 2 – Predictive Data – i.e. drop out, performance, etc. to assist in decision making of staffing, facilities, course offerings, etc. Use of Data

133
3 2 1 1 – Status Report 2 – Predictive Data 3 – Instructional Planning Data – on a student-by- student basis especially in a flipped classroom setting Use of Data

134
3 2 1 1 – Integration of Art/Music/CTE into academics and visa-versa - Interdisciplinary Departments Integration

135
3 2 1 1 – Integration 2 – Career pathway for ALL students Integration

136
3 2 1 1 – Integration 2 – Career pathway for ALL students 3 – Combining blended learning and multiple institutions Integration

137
Take off the plate

138
Next Network

139
State Standards to State Tests Road Map

140
Wisconsin English LA Achievement Frameworks Subskills/Descriptors Knowledge and Concepts Exam - CRT (WKCE)
")
141
State Tests State Standards

142
National Essential Skills Study (NESS)
")
143
Proficiency

144
NESS & Lexile State Tests State Standards

145
Common Core Standards NESS & Lexile State Tests State Standards

146
Common Core Standards NESS & Lexile State Tests State Standards

147
State Standards to State Tests State Standards to Research State Standards to CCSS CCSS to State Standards Road Map

148
KS. Standards CCSS

149
CCSS KS. Standards

150
State Standards to State Tests State Standards to Research State Standards to CCSS CCSS to State Standards State Tests to CCSS Sample NGAs Road Map

151
Performance Task drawn from the Ohio Performance Assessment Project. Available at, www.ModelSchoolsConference.com/handouts12.html

152
Gas Bill in Next Network

153
State Standards to State Tests State Standards to Research State Standards to CCSS CCSS to State Standards State Tests to CCSS Sample NGAs Road Map

154
State Test Create a large spinner for a game that has at least eight sectors. Each sector should be assigned a different prize. Prizes should range in value from most appealing to least appealing. Vary the sectors so that the probability to win a desired prize is much less that the probability to win a lesser desired prize. Calculate the theoretical probability of landing on each prize. Conduct multiple trials with the spinner and determine the experimental probability of landing on each prize. Which price has the greatest probability and which prize has the least probability? NGA Source: Next Navigator

155
A B D C

156
Common Core Standards NESS & Lexile State Tests State Standards Consortium Assessment DA

157
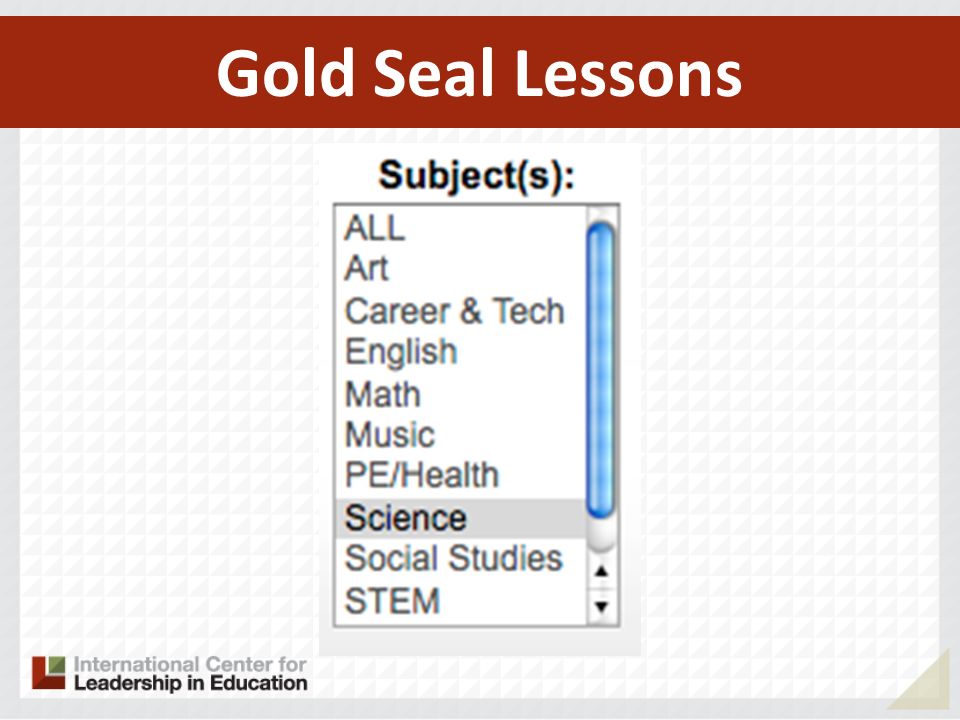
Gold Seal Lessons

161
A Look to the Future Focused and Sustained Professional Development

162
3 2 1 1 – Curriculum Matrix 2 – Next Network 3 – Online Game-based System CCSS NGA

163
3 2 1 1 – Teaching 2 – Learning 3 – Personalization of Learning Our Mission

164
School Improvement Growing Readiness Gap Readiness Changing World

Similar presentations