Download presentation
Presentation is loading. Please wait.

1
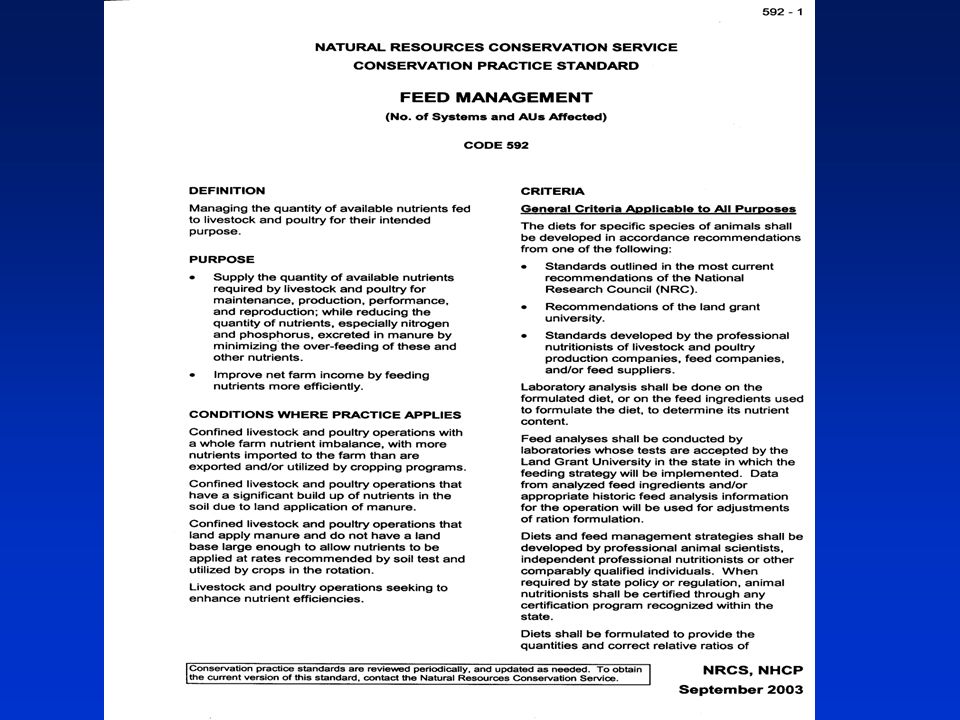
Animal Nutrition and Feed Management CNMP Core Curriculum Feed Management – Section 6.1

2
CNMP Development Core Training Curriculum These course materials have been developed as a cooperative effort between five land-grant universities and The Natural Resources Conservation Service. Ames, Iowa 50011, (515) 294-4111. Copyright © 1995-2006, Iowa State University of Science and Technology. All rights reserved. Copyright Information
 Copyright © , Iowa State University of Science and Technology. All rights reserved. Copyright Information.")
3
Objectives To gain a basic understanding of feed management and its role and impacts toward sustaining a healthy environment. To learn the relationship of balance nutrient inputs and manage outputs of nutrients within the farm livestock operation, and the need to use feed management to help maintain a balanced nutrient level. To understand the role of and how to create a feed management plan to control the quantity of available nutrients fed to livestock and poultry as outlined by NRCS Code 592. To become familiar with the digestive processes of the animal, differences between species, and the important nutrients and how they are utilized by the animal while becoming familiar with the flow of nutrients and factors affecting their excretion. To become familiar with the terminology of forms that feeds are fed and how processing can aid in nutrient availability of the animal, the factors affecting diet composition, and understand dry matter variability and its affect on nutrient content.

4
Required Materials NRCS Code 592 LPES lesson 2 Whole Farm Nutrient Planning CAST report No 21 land grant university recommendations and industry nutrition recommendations LPES Lessons 10, 11, 12, and 13 NRCS Nutrient Management Technical Note No. 1-5

6
Purposes of Feed Management Standard Supply available nutrients in feed for maintenance, production and reproduction Minimize excess nutrients in manure Improve net farm income by better feeding – Feeding animals account for 65-75% of the operating costs of the operation.

7
Feed costs are significantly reduced Dietary phosphorus concentration Milk yield, lbs./d0.45%0.50%0.55% 60$876$1,825$2,847 80$985$2,080$3,175 100$1,241$2,409$3,650 Table 1. Added annual feed costs due to excess phosphorus feeding* *Based on phosphorus levels compared to 0.4 percent and a 100-cow herd. Assumes $350/ton.

8
Dietary phosphorus concentration 0.40%0.45%0.50%0.55% Acres required for given herd size 100 cows96116135155 500 cows480580675775 Maximum cow numbers for a given land base 100 acres104877465 300 acres313260222194 Phosphorus feeding affects land needed per cow *Assumes cropping program of 50% corn, 50% alfalfa, and milk yield of 75 lbs./day

9
When should the FM 592 standard be applied? AFO with whole farm nutrient imbalance with more nutrients imported than exported and/or utilized by cropping programs AFO with a significant nutrient buildup in soil from manure applications

10
When should the FM 592 standard be applied? AFO with an insufficient land base to apply nutrients generated in the manure at rates based on soil test recommendations or that can be utilized in a crop rotation. AFO seeking to enhance nutrient efficiencies in animal production and on the farm.

11
Nutrients of Environmental Concern Nitrogen – water and air quality Phosphorus – water quality Copper – water quality Zinc – water quality Sulfur – water and air quality Selenium – water quality Arsenic – water quality Carbon compounds – water and air quality

12
Diet Formulation References

13
TSP Question to Producer TSP Question to Producer Is The Livestock or Poultry Operation Accumulating Soil Nutrients?

14
Whole Farm Nutrient Balance Farm Boundary Nutrient Imbalance (inputs - outputs) Inputs Managed Outputs Feed Animals Irrigation Water Fertilizer Legume N Meat/Milk/ Eggs Crops Manure Crops Gas Emissions
 Inputs Managed Outputs Feed Animals Irrigation Water Fertilizer Legume N Meat/Milk/ Eggs Crops Manure Crops Gas Emissions")
15
Phosphorus Inputs (% of Total) <250 250-2500 >2500 One Time Animal Capacity (animal units) Animals Fertilizer Feeds Phosphorus Inputs to Livestock Farms Which P input is largest?
 < >2500 One Time Animal Capacity (animal units) Animals Fertilizer Feeds Phosphorus Inputs to Livestock Farms Which P input is largest")
16
Phosphorus Inputs (% of Total) <250 250-2500 >2500 One Time Animal Capacity (animal units) 35% 62% 3% Animals Fertilizer Feeds Phosphorus Inputs to Livestock Farms
 < >2500 One Time Animal Capacity (animal units) 35% 62% 3% Animals Fertilizer Feeds Phosphorus Inputs to Livestock Farms")
17
Phosphorus Inputs (% of Total) <250 250-2500 >2500 One Time Animal Capacity (animal units) 35% 62% 3% 33% 47% 20% Animals Fertilizer Feeds Phosphorus Inputs to Livestock Farms
 < >2500 One Time Animal Capacity (animal units) 35% 62% 3% 33% 47% 20% Animals Fertilizer Feeds Phosphorus Inputs to Livestock Farms")
18
Phosphorus Inputs (% of Total) <250 250-2500 >2500 One Time Animal Capacity (animal units) 35% 62% 3% 33% 47% 20% 1% 74% 25% Animals Fertilizer Feeds Phosphorus Inputs to Livestock Farms
 < >2500 One Time Animal Capacity (animal units) 35% 62% 3% 33% 47% 20% 1% 74% 25% Animals Fertilizer Feeds Phosphorus Inputs to Livestock Farms")
19
Nitrogen Inputs (% of Total) <250 250-2500 >2500 One Time Animal Capacity (animal units) Animals Fertilizer Feeds Nitrogen Inputs to Livestock Farms Which N input is largest?
 < >2500 One Time Animal Capacity (animal units) Animals Fertilizer Feeds Nitrogen Inputs to Livestock Farms Which N input is largest")
20
Nitrogen Inputs (% of Total) One Time Animal Capacity (animal units) <250 250-2500 >2500 15% 50% 3% 10% 50% 30% 3% 75% 20% Animals Fertilizer Feeds Legumes 32% 10% 2% Nitrogen Inputs to Livestock Farms
 One Time Animal Capacity (animal units) < > % 50% 3% 10% 50% 30% 3% 75% 20% Animals Fertilizer Feeds Legumes 32% 10% 2% Nitrogen Inputs to Livestock Farms")
22
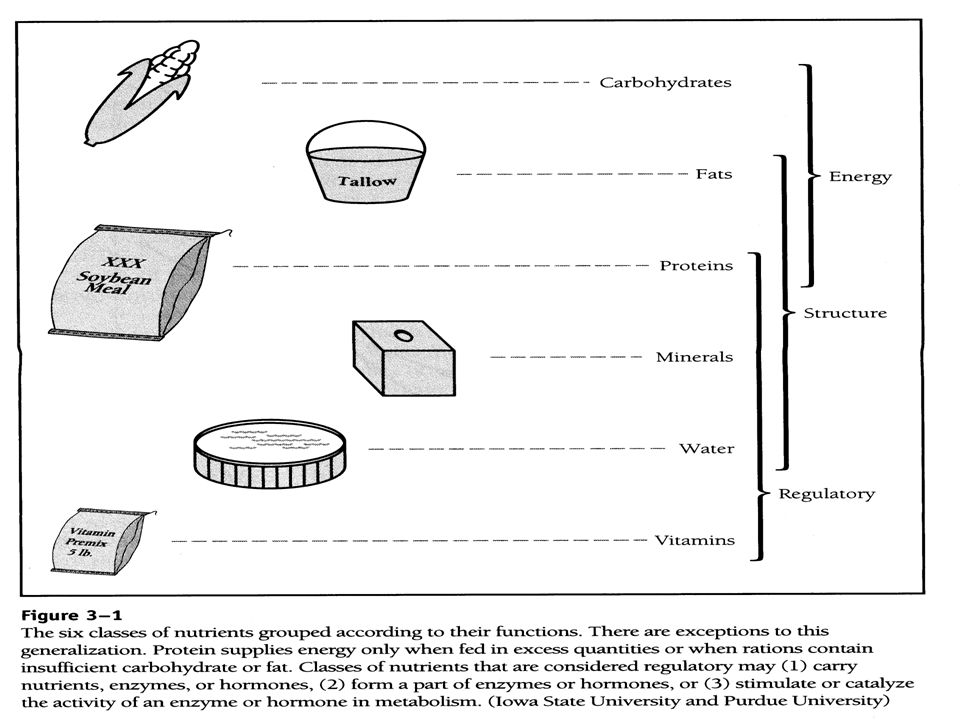
Digestive Processes Feed intake to provide nutrients –Maintenance –Production (meat, milk and eggs) –Reproduction
 –Reproduction")
23
Nutrient Consumed (NPK, etc) Nutrient Digested Nutrient Absorbed Nutrient Retained in meat, milk and eggs Nutrient Excreted (NPK)
 Nutrient Digested Nutrient Absorbed Nutrient Retained in meat, milk and eggs Nutrient Excreted (NPK)")
24
Difference between Ruminants and non- Ruminants Ruminants (beef and dairy) can digest forages as well as concentrates; microorganisms are present in the stomach Non-ruminants (poultry and swine) do not utilize forages effectively and need highly digestible feed ingredients
 can digest forages as well as concentrates; microorganisms are present in the stomach Non-ruminants (poultry and swine) do not utilize forages effectively and need highly digestible feed ingredients")
25
Difference between Ruminants and non- Ruminants

27
Crude Protein Term referring to the nitrogen and amino acid portion of the diet Equivalent to analyzed nitrogen (N) content X 6.25 = crude protein content of a diet or feed ingredient. Based upon the value of 16% nitrogen in a protein molecule

28
TSP Question to Producers Is there a laboratory analysis program for manure? From different manure pit? When significant changes in feed ingredients, such as by-product feeds? Is manure analysis data used to determine manure application rates onto cropland?

29
Manure Contents Undigested dietary components with numerous nutrients present Enzymes Bacteria Feed additives What is in manure is greatly dependent upon what the animal is fed.

30
TSP Question to Producers What does the producer feed his animals? What types of animals are being fed? Are these feeds produced on the farm or are they purchased? Are by-product feeds used or will they be considered in the rations? How is the feed ration prepared (processed)?
 .")
31
Forms of Feed Silage (fermented whole corn and stalks, hay) Hay (dry) Pellet Meal feed Liquid
 Hay (dry) Pellet Meal feed Liquid")
32
Processing can improve nutrient digestibility. Heat and steam effects Reducing particle size Microorganisms breakdown nutrients Increasing enzyme activity

33
Processing and Storage Effects on Nutrient Quality Need to have optimal storage methods and conditions for feeds Proper mixing equipment; routine calibration practices Do not over heat

34
Enzymes open opportunities. Enhances digestibility of nutrients – Phytase enhances P digestibility in pigs by 30% to 50% – Fiber-degrading enzymes. Xylanase/beta-glucanase improve digestibility 2% to 9%.

35
Factors affecting diet composition Species being fed Stage of growth, milk and egg production Gestation phase Sex of animal Genetic potential of animal Environmental conditions (climate) Intended purpose of the animal
 Intended purpose of the animal")
36
What a nutritionist does Balancing the needs of the animal with the available nutrients in diverse feed ingredients is challenging.

38
Feed Ingredients (grains) (% dry matter basis) IngredientDMProteinPK Corn898.30.280.33 Soybean Meal 9047.50.692.14 Cottonseed Meal 9041.41.061.40 Canola9035.61.011.22 Distillers9327.70.770.84 Gluten9021.50.830.98
 (% dry matter basis) IngredientDMProteinPK Corn Soybean Meal Cottonseed Meal Canola Distillers Gluten")
39
% N = CP/6.25 10.4/6.25 Note: %P Not P 2 O 5

40
Feed Ingredients (forages) (% dry matter basis) IngredientDMProteinCaPK Corn silage3580.310.271.22 Alfalfa haylage 39201.740.272.35 Pearl millet35120.180.28 Orchard grass hay 89110.270.342.91 Grass pasture20270.550.453.16
 (% dry matter basis) IngredientDMProteinCaPK Corn silage Alfalfa haylage Pearl millet Orchard grass hay Grass pasture")
41
By-Product Feeds Resource which is a by-product of some other industry Costly waste product to dispose of Feeding in the correct proportions in the diet will give a value-added status Long-term storage can be difficult Can be a considerable variation in composition Can increase the excretion of specific nutrients

42
N and P in by-product feeds (% dry matter basis) Feedstuff%N% CP% PN:P ratio SBM, 48% CP8.452.70.7711.3:1 Corn1.59.30.31 4.8:1 Corn gluten feed3.823.90.92 4.2:1 Corn gluten meal10.767.00.4921.8:1 Distillers grains4.829.80.83 5.8:1 Meat/bone meal8.955.45.41.6:1 Bloodmeal15.395.50.3247.8:1
 Feedstuff%N% CP% PN:P ratio SBM, 48% CP :1 Corn :1 Corn gluten feed :1 Corn gluten meal :1 Distillers grains :1 Meat/bone meal :1 Bloodmeal :1")
43
TSP Question to Producers What is the feed sampling and analysis program on the farm? How often do they analyze individual ingredients and the total ration?

44
Feed Sampling Individual ingredients vs. total feed sampling Mixing problems Changes in feed sources Time in storage Different dry matter contents

45
Calculating nutrient contents on DM basis Nutritionally, DM is key At feeding, account for water 10 lb DM 2 lb CP What is % CP? DM basis or as-is basis? How much DM? = 10 lb DM 10 lb H 2 O 50% DM 20 lb total material10 lb total material

46
Calculating nutrient contents on DM basis Corn silage with 35% dry matter (65% moisture) Protein content is 2.8% on an as fed (wet) basis What is the crude protein on a 100% dry matter basis? Answer: protein content (%) DM content (%) of corn silage 0.028/.35 = 0.08 x 100 = 8% X 100 =
 DM content (%) of corn silage 0.028/.35 = 0.08 x 100 = 8% X 100 =.")
47
Calculating nutrient contents on DM basis Corn silage with 30% dry matter (70% moisture) Protein content is 2.8% on an as fed (wet) basis What is the crude protein on a 100% dry matter basis? Answer: protein content (%) DM content (%) of corn silage 0.028/.30 = 0.093 x 100 = 9.3% X 100 =
 DM content (%) of corn silage 0.028/.30 = x 100 = 9.3% X 100 =.")
48
Phosphorus Intake Assume that distillers grains with solubles contained 70% dry matter with 0.64% P and the diet has been formulated to provide 0.4% P (dry matter basis) in the diet (distillers make up 25% of the diet). If you added the same proportion (25% wet weight as is) of distillers grains with solubles to the diet but the composition was 90% dry matter with 0.83% P the diet would increase the P in the diet to 0.44% (dry matter basis)
 of distillers grains with solubles to the diet but the composition was 90% dry matter with 0.83% P the diet would increase the P in the diet to 0.44% (dry matter basis).")
49
Additional References NRCS Nutrient Management Technical Notes (001 - 005) (January 2003) LPES National Curriculum Land Grant University recommendations Industry professional nutritionist recommendations
 (January 2003) LPES National Curriculum Land Grant University recommendations Industry professional nutritionist recommendations")
50
Other References

52
Class Exercise (Feed Management) If corn silage is 35% DM, 65% water – CP content on an "as-is" basis is 2.8% – What is the CP on a DM basis? 2.8 / 0.35 = 8 If corn silage was really 30% DM, 70% water, what is the CP on DM basis if it is 2.8% on an "as-is" basis?

53
Class Exercise (Feed Management) If corn silage is 35% DM, 65% water CP content on an "as-is" basis is 2.8% What is the CP on a DM basis? 2.8 / 0.35 = 8 If corn silage was really 30% DM, 70% water, what is the CP on DM basis if it is 2.8% on an "as-is" basis? 2.8 / 0.30 = 9.33

54
Class Exercise (Feed Management) A dairy producer says their cows are eating 80 lb of feed per day. How much DM are they consuming or is this DM intake?

55
Class Exercise (Feed Management) A dairy producer says their cows are eating 80 lb of feed per day. How much DM are they consuming or is this DM intake? It cannot be DMI, as not logical, so must be intake on an "as-is" basis. What you need is the DM content of the diet. DM % of diet is 68.75% when you ask the producer.

56
Class Exercise (Feed Management) A dairy producer says their cows are eating 80 lb of feed per day. How much DM are they consuming or is this DM intake? It cannot be DMI, as not logical, so must be intake on an "as-is" basis. What you need is the DM content of the diet. DM % of diet is 68.75% when you ask the producer. DMI = 80 x 0.6875 = 55 lb DM

57
Class Exercise (Feed Management) Feed analysis on a dry matter basis Old corn silage (phosphorus): –0.09% P/35% DM = 0.0009/0.35 x 100 = 0.26% New corn silage (phosphorus): –0.10% P/30% DM = 0.0010/0.30 x 100 = 0.33% Corn (phosphorus): –0.25% P/89% DM =0.0025/0.89 x 100 = 0.28% Distillers grains w/solubles : –0.66% P/79% DM = 0.0066/0.79 x 100 = 0.835%
 Feed analysis on a dry matter basis Old corn silage (phosphorus): –0.09% P/35% DM = /0.35 x 100 = 0.26% New corn silage (phosphorus): –0.10% P/30% DM = /0.30 x 100 = 0.33% Corn (phosphorus): –0.25% P/89% DM =0.0025/0.89 x 100 = 0.28% Distillers grains w/solubles : –0.66% P/79% DM = /0.79 x 100 = 0.835%")
Similar presentations