Download presentation
Presentation is loading. Please wait.

1
Distillers Grains for Beef Cattle Steve Boyles Dept. of Animal Sciences The Ohio State University Distillers Grains for Beef Cattle Steve Boyles Dept. of Animal Sciences The Ohio State University

3
Name 10 cities in China 200 million people in China now making > $30,000 per year How many people do we have in the U.S.?

4
According to Renewable Fuels Assoc .U.S. has 107 ethanol plants in production 49 under construction More on the drawing board Corn is the favored raw material

5
North America Ethanol

6
DDG Use in 2005

7
With Tax CreditWithout Tax Credit Crude Oil ($/barrel) Corn ($/bu) Crude Oil ($/barrel) Corn ($/bu) 402.67401.14 503.36501.83 604.05602.52 704.74703.21 805.43803.90 How much can ethanol pay for corn? St-Pierre, 2006

8
With Tax CreditWithout Tax Credit Crude Oil ($/barrel) Corn ($/bu) Crude Oil ($/barrel) Corn ($/bu) 402.67401.14 503.36501.83 604.05602.52 704.74703.21 805.43803.90 How much can ethanol pay for corn? St-Pierre, 2006

9
Co-Products of Ethanol Production (Take out starch, 75% of kernal) Distiller’s Grains (DG) Distiller’s Solubles (DS) Distiller’s Grains w/ Solubles (DGS) Carbon dioxide Assume you are buying DGS unless told otherwise
 Distiller’s Grains (DG) Distiller’s Solubles (DS) Distiller’s Grains w/ Solubles (DGS) Carbon dioxide Assume you are buying DGS unless told otherwise")
10
Wet vs. Dry Distillers Dry distillers: ~88% DM Wet distillers: ~32% DM Modified wet: ~47% DM - RUP is higher in dry (19.5 vs 16.5%) - Not much else different
 - Not much else different.")
11
Nutrient Composition DDGS (Varies with manufacturing process) Item% of DM Crude protein28 to 36 RUP, % of CP47 to 63 NEl, Mcal/kg2.20 Fat8.2 to 11.7 ADF19 to 24 NDF38 to 44 Ca0.10 to 0.15 P0.43 to 0.83 High-bypass potential with >80% SI digestion NDF As effective as Alfalfa haylage Only 68% as effective as Corn silage
 Item% of DM Crude protein28 to 36 RUP, % of CP47 to 63 NEl, Mcal/kg2.20 Fat8.2 to 11.7 ADF19 to 24 NDF38 to 44 Ca0.10 to 0.15 P0.43 to 0.83 High-bypass potential with >80% SI digestion NDF As effective as Alfalfa haylage Only 68% as effective as Corn silage")
12
DDG SBM Variation in DDG: Crude Protein

13
DDG Corn Variation in DDG: Fat Differences in Pellet Quality?

14
Why more variation? Because taking out starch, other nutrients more concentrated Take the variation in corn and multiply it by 3x Color (Darker-more heat/more rapidly) Similar energy Different protein
 Similar energy Different protein.")
15
Nutrient Content of Corn Distiller’s Grains and Distiller’s Solubles (100% DM Basis) Plants want to sell ethanol so add back solubles NutrientDistiller’s Grains Distiller’s Solubles C. Protein, %33.518.5 Crude fat, %9.015.7 Crude fiber, %9.52.5 Ash, %3.08.4 Ca, %0.040.06 P, %0.541.28

16
Safety/Composition Attributes Low Starch Low NPN Problems Sulfur (.4% = upper limit for beef cattle, sulfate toxicity) Thiamine (2.5 mg/lb DM, or 150 mg/hd/d above 40% DGS in Diet) Check S in drinking water Ca:P Ratio (May be able to remove P from mineral mix) P (Where are you now with your CNMP?) Variation Plant-to-Plant, Load-to-Load
 Thiamine (2.5 mg/lb DM, or 150 mg/hd/d above 40% DGS in Diet) Check S in drinking water Ca:P Ratio (May be able to remove P from mineral mix) P (Where are you now with your CNMP ) Variation Plant-to-Plant, Load-to-Load")
17
Sulfate Toxicity (Sulfur added at plant…in solubles) Maximum Tolerable Limit.4% of Diet DM Requirement only.15% WDGS and DDGS may contain.8% to 1.9%
 Maximum Tolerable Limit.4% of Diet DM Requirement only.15% WDGS and DDGS may contain.8% to 1.9%")
18
Sulfur Toxicity Must take into account other sources …basal diet and water Chronic Toxicity Reduced DMI Reduced Growth Reduce copper status Acute Toxicity Polioencephalomalacia (PEM) Restlessness, diarrhea, muscular twitching dyspnea (blindness), death
 Restlessness, diarrhea, muscular twitching dyspnea (blindness), death")
19
Effects of S Levels on Dietary S Content a (% DM) a Basal diet contains 15% corn silage, 3% urea, and corn …..does not account for S intake from water S Content of DGS, % Inclusion rate, % DM.60.801.0 20.21.25.29 30.27.33.37 40.33.41.49
 a Basal diet contains 15% corn silage, 3% urea, and corn …..does not account for S intake from water S Content of DGS, % Inclusion rate, % DM")
20
Supplemental Calcium Carbonate Required to Maintain Ca:P Ratio (% DM) P Content of DGS, % DGS Inclusion Rate, % DM.60.801.0 20.88.991.11 30.931.101.28 40.981.221.45
 P Content of DGS, % DGS Inclusion Rate, % DM")
21
Fat Content of Diet Max7%??, forage-based diets (DM basis) Max8%??, finishing rations (DM basis) These seem high to me……more like 5-6%
 Max8% , finishing rations (DM basis) These seem high to me……more like 5-6%")
22
DDG as a Protein Source - Moderate in CP and high in RUP - Digestibility can be an issue - Amino acid quality can be an issue DDG can reduce milk protein %

23
Digestibility of RUP NRC, 2001

24
Courtesy of N. St-Pierre

25
Wet DGS Can usually store only 5-7 days Will spoil unless stored in a pit or in big silage/haylage bags to reduce mold growth May need preservative (e.g. propionic acid or other organic acid) Limited economical hauling distances (120 miles?) Can you handle a truckload? (27 ton) Rations may be too wet which could limit total DM intake, especially if ensiled forages are also fed Boyles preference..keep ration DM > 55%
 Limited economical hauling distances (120 miles ) Can you handle a truckload. (27 ton) Rations may be too wet which could limit total DM intake, especially if ensiled forages are also fed Boyles preference..keep ration DM > 55%.")
26
Storing Wet Distillers -Shelf life ~ 1 wk with typical storage -Can be ‘ensiled’ or bagged ($7/ton) -Can be ensiled with other feeds (final DM < 50%) -Some preservatives show promise
 -Can be ensiled with other feeds (final DM < 50%) -Some preservatives show promise")
27
Bagging Wet Distillers -Reduces DM losses (shrink) -Doesn’t really ferment -Preservation is via air exclusion -When exposed to air, spoils quickly -High feed out rates needed (~1 ft/day)
 -Doesn’t really ferment -Preservation is via air exclusion -When exposed to air, spoils quickly -High feed out rates needed (~1 ft/day)")
28
www.das.psu.edu/pdf/kalscheur_ethanol_ coproducts.pdf For More Info on Storing Wet Distillers See:

29
Feeding Urea with WDGS 10% WDGS20% WDGS 0% Urea.8% Urea0% Urea.8% Urea CP, %11.213.4 15.1 ADG, lbs3.513.683.553.60 DMI, lb/day24.524.923.924.6 Feed/gain7.06.8 6.9 Statistically Similar……Nebraska 2005

30
Feeding Urea with WDGS 10% WDGS20% WDGS 0% urea.8% urea0% urea.8% urea HCAR Wt, lb744753747752 Fat Thick, in..45.43.40.45 REA, in 2 12.712.412.512.3 Marbling a 536522548536 A 500=small Statistically similar…….Nebraska, 2005

31
Research Data from studies conducted since 1990 264 pens housing 1,541 head of cattle 796 lb (361 kg) initial weight NE, IA, KS, SD
 initial weight NE, IA, KS, SD")
37
Feeding Recommendations for Distillers Grains to Beef Protein Source (1-3 lb/d)6-15% Energy Source (4-9 lb/d)20-40% Mineral imbalance (Ca:P) Add limestone Ca:P > 1.1 Does not replace all roughage sources Monitor S contect of DGS Maximum allowable level =.4% Feeding 40% DGS that has 1% S is risky Prefer Wet over Dry DGS (if storage not a problem)
6-15% Energy Source (4-9 lb/d)20-40% Mineral imbalance (Ca:P) Add limestone Ca:P > 1.1 Does not replace all roughage sources Monitor S contect of DGS Maximum allowable level =.4% Feeding 40% DGS that has 1% S is risky Prefer Wet over Dry DGS (if storage not a problem)")
38
Feeding Recommendations for Distiller Grains (Beef) Value relative to corn (DM basis) Wet 110-120% Dry 100% Pay based on energy content Adjust nutrient management plans P Potential runoff
 Value relative to corn (DM basis) Wet % Dry 100% Pay based on energy content Adjust nutrient management plans P Potential runoff")
39
Effect of Ethanol Co-Products on Carcass and Beef Quality C. Reinhardt and A. DiCostanzo Kansas State University University of Minnesota

40
Data Set 106 treatment means 21 studies 625 pens 4,752 cattle Co-prod = 0 to 75% DOF = 151, 58 to 299 In BW, lb = 727, 421 to 948 ADG, lb = 3.31, 1.81 to 4.55 DMI, lb/d = 20.6, 15.4 to 26.0 FTG = 6.3, 5.1 to 8.3 End BW, lb = 1212, 997 to 1394 HCW, lb = 754, 632 to 870 Fat, in = 0.42, 0.19 to 0.62 REA, in 2 = 12.8, 11.1 to 15.0 Choice, % = 55.9, 16.7 to 95 YG = 2.7, 1.8 to 3.6

41
YG = 2.56 + 0.0080*DG - 0.00014*DG 2 R 2 =0.903; n=89 29%

42
22%

43
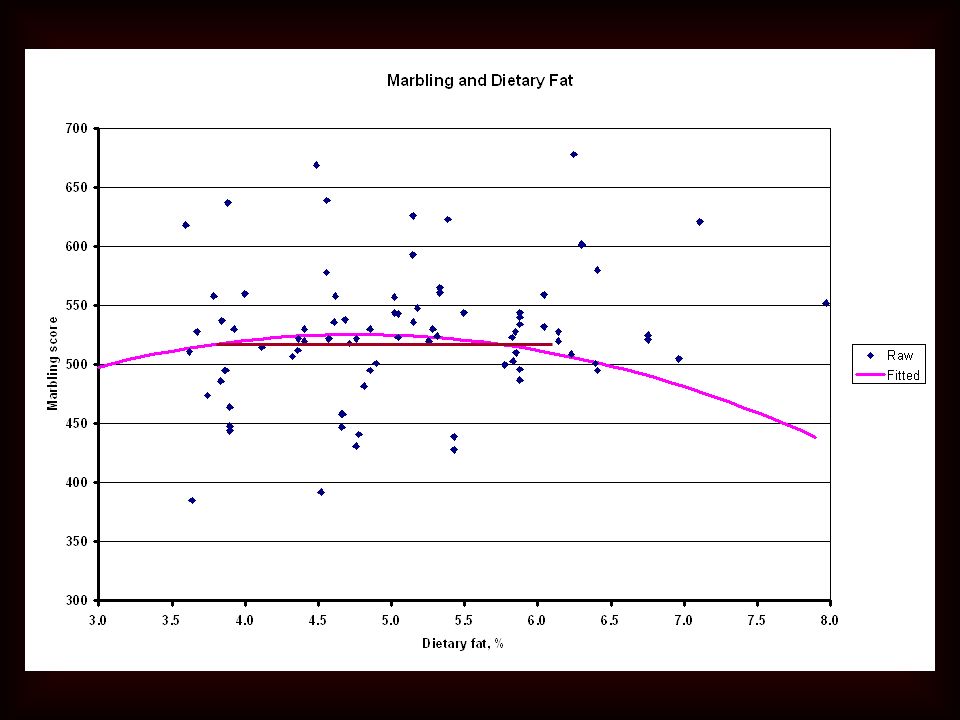
MARB = 516.73+1.055*DG-0.032*DG 2 R 2 = 0.933; n = 86 MARB = 374.72 - 6.44*DG + 54.67*YG + 2.54*DG*YG + 0.139*DG 2 - 0.062*DG 2 *YG R 2 = 0.962; n = 74 23%

44
Effects on Marbling and YG At intermediate concentrations, co-products increase YG effect on increasing fat depth At intermediate concentrations, co-products increase YG, but maintain marbling

45
26%

46
Effects on Marbling and YG At a given YG end point, effects of co- products are variable At low YG (lower energy diets or lean cattle) co-products reduce marbling at any inclusion At YG 3 co-products have no effect on marbling up to 20% inclusion At high YG (extended DOF, early-maturing cattle or heifers) co-products increase marbling at low to intermediate inclusion
 co-products reduce marbling at any inclusion At YG 3 co-products have no effect on marbling up to 20% inclusion At high YG (extended DOF, early-maturing cattle or heifers) co-products increase marbling at low to intermediate inclusion")
47
Are They Really Effects of Co-Products? Difficult to separate from this dataset During, experimental feeding of ethanol co- products, energy, protein and ether extract of diet are permitted to fluctuate Therefore, is marbling affected because of co-products or something that co-products affect? ether extract intake starch intake energy intake

51
Co-product Effects Effect of ether extract on marbling score is clear virtually no change in marbling between 3.7% and 5.7% ether extract Effect of co-product on marbling score is dependent on ME intake At ME intakes up to 30 Mcal/d, co-product inclusion at up to 50% is not detrimental to marbling At lower ME intakes, co-product inclusion is actually positive on marbling

52
When feeding ethanol co-products, the effect of the inherent increase in dietary ether extract may be of greater influence on marbling than that of increased ME intake

54
Summary Feeding ethanol co-products: increased YG 0.17 units up to 30% inclusion had no effect on marbling at up to 30% inclusion when end point YG = 3 reduced marbling 25 and 50 points at 40% and 50% inclusion, respectively reduced marbling at up to 40% inclusion when end point YG ≤ 2 slightly increased marbling at up to 30% inclusion when end point YG = 4 reduced marbling 20 and 80 points at 40% and 50% inclusion, respectively Marbling depression may be due to excessive dietary fat or reduced dietary starch

55
Summary The effects of ethanol co-products are on REA are dependent on end weight When considering both co-product inclusion and end-weight, the effects of co-products on REA are minimal

56
Potential Environmental Cost Using typical feeds: Diets with 0.38% P without supplemental P +10% DDG = 0.43% P +20% DDG = 0.46% P For 100 cows for 1 year: 10% DDG = +880 lbs of manure P 20% DDG = +1500 lbs of manure P

Similar presentations


 and Dairy Cow Requirements Jim Linn, PhD Professor Emeritus – University of Minnesota Milk Specialties.>")


 calorie.>")


