Download presentation
Presentation is loading. Please wait.

1
Assessment Specification for 2014 You must answer ALL parts of ALL questions Candidates should use specific information/case studies to illustrate their answers. Bring calculator, ruler and coloured pencils. Use coloured pencils for maps but annotations must be in pen. Any written work in pencil is not eligible for reconsideration. 91240 Demonstrate geographic understanding of a large natural environment. 4 credits. You may have to complete fully annotated sketch maps/diagrams and write an explanation OR write longer written answers that can be supported by sketch maps/diagrams. All answers must use the same natural environment.(Amazon) 91242 Demonstrate geographic understanding of differences in Development. 4 credits. Case studies must refer to communities, areas or countries across the globe at different stages of development. 91243 Apply geographic concepts and skills to demonstrate understanding of a given environment. 4 credits. Answer ALL questions based on a range of geographic resources provided in a separate resource book of a NZ setting. You will be expected to apply geographic concepts and skills to demonstrate understanding of the NZ environment in every question.
 Demonstrate geographic understanding of differences in Development. 4 credits. Case studies must refer to communities, areas or countries across the globe at different stages of development Apply geographic concepts and skills to demonstrate understanding of a given environment. 4 credits. Answer ALL questions based on a range of geographic resources provided in a separate resource book of a NZ setting. You will be expected to apply geographic concepts and skills to demonstrate understanding of the NZ environment in every question..")
2
Examiners comments on exam answers. Candidates need to EXPLAIN as well as describe, using words like “therefore”, “because” “such as” “due to”. understand and use geographical terminology and key terms like patterns, spatial variation, evolution and change. draw annotated diagrams, sketches and/or maps. attempt all questions. learn detailed case studies of both settings and integrate specific case study material (names of places, dates, technical terms) into their answers. Write well-structured answers with a general statement, explanation, example. Explain the implication of statistics for disparities, don’t just list them.
 into their answers. Write well-structured answers with a general statement, explanation, example. Explain the implication of statistics for disparities, don’t just list them..")
3
Demonstrate geographic understanding of a large natural environment Aspects are selected from: the characteristics of a large natural environment how the elements and processes of the large natural environment interact how a large natural environment is formed and changes over time how people interact with a large natural environment how people's perceptions of a large natural environment change over time.

4
Demonstrate geographic understanding of differences in development Aspects are selected from: characteristics of development different ways development can be measured factors contributing to differences in development strategies for reducing the differences in development.

5
91243 Apply geography concepts and skills to demonstrate understanding of a given environment. Students should be able to: MAPPING Complete a map with some part of the outline drawn Locate on it aspects from an aerial photograph Read a more complex scale with representative fractions Calculate area Direction - accuracy of bearings to 16 points Use contours to identify key features and determine difference between features such as a U shaped and V shaped valleys Draw a cross-section from a map to demonstrate additional specific knowledge and skill Locate and determine reference using degrees and minutes of longitude and latitude and using 6 figure GR. Use of the GR is explicit OTHER MAPS Read and interpret a range of resources and apply them to the construction of maps such as Dot distribution maps, Choropleth maps, Proportional symbol, Isoline maps, Flow maps.

6
PHOTO’S Determine direction from a photograph Locate an aerial photo on map Calculate scale Compare photos to explain geographic changes Use the photograph to develop a précis sketch Compare and evaluate different types of photographs as a geographic resource DIAGRAMS/MODELS Read, and interpret relevant diagrams/models Compare, evaluate and apply the diagrams/models to a real life situation CARTOON Explain the characters, actions/events and symbolism in the cartoon VALUING SKILLS Identify and describe and explain a range of opinions or values Resources will be more complex with a wider range of opinion Students would need to justify their own opinion

7
GRAPHING Construct, read and interpret the following graphs: Triangular, Scatter, Positive/negative graph, Compound graphs. STATISTICAL Calculate and show an understanding of the following: Percentages, Percentage change, Mean, Median, Range, Mode, Data presentation. Use statistical information to make comparisons in a geographic context. KEY CONCEPTs or BIG IDEAS Provide an explanation of a concept within a geographic c ontext Apply a stated concept within a defined context. Students are required to understand how these concep ts can be app lied to new settings, as well as applying them to the contexts they have studi ed specifically. A student’s understanding of a concept at level 1 will be at a more basic level than an understanding at levels 2 or 3. Geographic concepts allow for the explorati on of relatio nsh ips and conne ctions between people and both natural and cultural envi ronments. They have a spati al co mponent. They provide a framework that geograp hers use to interpret and represent information about the world. The develo pment of understanding of these concepts will allo w students to participate as critical, active, informed and responsible citizens.

8
Key concepts Students are required to understand how these concepts can be applied to new settings, as well as applying them to the contexts they have studied specifically. Differentiation of concepts applies across the levels. A student’s understanding of a concept at level 1 will be at a more basic level than an understanding at levels 2 or 3. As students build geographical knowledge and skills, they will approach these concepts in different ways. By revisiting them in different contexts, they will come to refine and embed understandings. Environments: May be natural and/or cultural. They have particular characteristics and features which can be the result of natural and/or cultural processes. The particular characteristics of an environment may be similar to and/or different from another. Perspectives: Ways of seeing the world that help explain differences in decisions about, responses to, and interactions with environments. Perspectives are bodies of thought, theories or worldviews that shape people’s values and have built up over time. They involve people’s perceptions (how they view and interpret environments) and viewpoints (what they think) about geographic issues. Perceptions and viewpoints are influenced by people’s values (deeply held beliefs about what is important or desirable).
 and viewpoints (what they think) about geographic issues. Perceptions and viewpoints are influenced by people’s values (deeply held beliefs about what is important or desirable)..")
9
Processes: A sequence of actions, natural and/or cultural, that shape and change environments, places and societies. Some examples of geographic processes include erosion, migration, desertification and globalisation. Patterns: May be spatial: the arrangement of features on the earth’s surface; or temporal: how characteristics differ over time in recognisable ways. Interaction: Involves elements of an environment affecting each other and being linked together. Interaction incorporates movement, flows, connections, links and interrelationships. Landscapes are the visible outcome of interactions. Interaction can bring about environmental change. Change: Involves any alteration to the natural or cultural environment. Change can be spatial and/or temporal. Change is a normal process in both natural and cultural environments. It occurs at varying rates, at different times and in different places. Some changes are predictable, recurrent or cyclic, while others are unpredictable or erratic. Change can bring about further change. Sustainability : Involves adopting ways of thinking and behaving that allow individuals, groups, and societies to meet their needs and aspirations without preventing future generations from meeting theirs. Sustainable interaction with the environment may be achieved by preventing, limiting, minimizing or correcting environmental damage to water, air and soil, as well as considering ecosystems and problems related to waste, noise, and visual pollution. Additional geographic concepts: such as location, distance and region, rehabilitation and mitigation, sustainability, globalisation and citizenship.

10
Drawing a Precis Map from a Topographical map and aerial photo You will be given a map with some part of the outline drawn and will be required to locate aspects on it from an aerial photograph Remember to put grid lines on your map, where possible, for accuracy of position and size. Use pencil and coloured pencils, not felts. The key must be the same as the map. Symbols for a point, shading for an area, with a line around the area. Use the question for the title.

11
Precis Map from Aerial Photo What is the orientation of the photo? Student can locate an aerial photo on map Student can calculate scale

12
Sketch from an aerial photo Student can compare photos to explain geographic changes Student can use the photograph to develop a précis sketch. Photos can be vertical or oblique (adv/disadv) and the shape of the sketch frame is rectangular or trapezium.
 and the shape of the sketch frame is rectangular or trapezium..")
13
Scale Maps are made to scale. In each case, the scale represents the ratio of a distance on the map to the actual distance on the ground. For example, if 2 cm on a map represents 1 km on the ground. the scale would be 2 cm = 1 km, or... 2cm = 100,000cm 1cm = 50,000 cm Or 1:50000 representative fraction The Larger the number, the Less detail, the Larger the area shown on the map. The Smaller the number, the More detail, the Smaller the area shown on the map. Use a piece of string, ruler or strip of paper to measure the distance between two points on the map.

14
Calculating Area. If map grid squares are 1 km square, what is the area of the Franz Joseph glacier?

15
Direction - accuracy of bearings to 16 points

16
Using contour lines to identify key features and determine difference between features such as a U shaped valley vs a V shaped valley Cross-section drawn from map to demonstrate additional specific knowledge and skill Contour lines are lines joining places of equal height.

17
Drawing Cross-Sections Accurate Scale and Axis labelled TITLE that repeats the question Put a piece of paper along the line and mark off the contours and heights. x Put a cross and join them up x x xx x x x x x x x x x

18
Locate and determine reference using degrees and minutes of longitude and latitude and use 6 figure GR.

19
6 figure Grid References 61 62 63 64 65 66 67 68 69 70 71 72 Northing 64 60 000 Easting 51 52 53 54 55565758 59 60 61 62 26 50 000 Types of Maps · Map Reading · Map Drawing

20
Latitude and Longitude Latitude is measured from the equator, which is zero, with degrees north and south to 90. Longitude is measured from the Prime Meridian (which is the longitude that runs through Greenwich, England and is zero), with degrees west and east to 180 where they meet at the International Dateline. There are 60 seconds in 1 minute and 60 minutes in 1 degree.
, with degrees west and east to 180 where they meet at the International Dateline. There are 60 seconds in 1 minute and 60 minutes in 1 degree..")
21
Latitude and Longitude. What is the latitude of the lines that are not numbered?

22
Other Maps: read and interpret a range of resources and apply them to the construction of maps such as Dot distribution maps, Choropleth maps, Proportional symbol, Isoline maps, Flow maps. 1 Choropleth Map : Shading areas using a colour key. 2 Dot Distribution Map

23
3 Proportional circles: population UK/Scotland 4 Isoline map: air pressure USA 5 Flow Map: trips/Europe

24
DIAGRAMS/MODELS Student can read, and interpret relevant diagrams/models. Student can compare, evaluate and apply the diagrams/models to a real life situation Rostows model of Development.

25
Description: A statement outlining the nature of the cartoon’s subject matter. This might include a statement identifying the geographic issue being addressed and the perspective adopted by the cartoonist. Analysis: In interpreting the cartoon you should identify the range of geographic concepts or generalisations relevant to the issue being addressed and use these to demonstrate your understanding of the issue. You might also evaluate the point of view or perspective adopted by the cartoonist and include reference to alternative perspectives relevant to the issue. Implications: This part of your response requires you to outline the geographical implications of the issue addressed in the cartoon. Describe the details of what you can see Analyse what the cartoonist is trying to say. What is the main idea? ImplicationsImplications Identify what is in the cartoon Cartoons

26
Valuing Skills- Development of Amazon Basin Identify and describe and explain a range of opinions or values and justify your own opinion. Place the following people on the continuum and justify their position. Enawene Nawe, Maggi boss, Cattle Rancher, Rubber Tapper, Eco Tourism operator. Justify the position you have chosen by examining culture, religion, age, sex, economic and environmental factors.

27
Drawing Graphs: Students should be able to construct, read and interpret the following graphs:Triangular graphs, Scatter graphs, Positive/negative graph, Compound graphs.

28
Triangular Graphs Each axis is divided into 100, representing percentages. From each 100-0% axis, lines are drawn at angles of 60 degrees to carry the values. The data used must be in the form of three components, each component representing a percentage value, and the three component percentage values must add up to 100 per cent. Compound graphs If information can be subdivided into two (or more) types of data - eg total population growth, female population growth and male population growth - then all three can be drawn on the graph. This type of line graph is called a compound line graph.
 types of data - eg total population growth, female population growth and male population growth - then all three can be drawn on the graph. This type of line graph is called a compound line graph..")
29
STATISTICAL Students show an understanding of the following: Percentages, Percentage change, Mean, Median, Range, Mode, Data presentation. Use statistical information to make comparisons in a geographic context.

30
IGI’s/CONCEPTS/BIG IDEAS Student can provide an explanation of an IGI within a geographic context Students are expected to apply a stated IGI within a defined context. Sustainability Environments Location, distance, accessibility Pattern, process, region Interaction. Change Systems. Culture, perception. Maori concepts, for example, kaitiakitanga, manaakitanga and hekenga

31
Words used in the exam papers Explain: means give reasons for, account for, justify, compare, clarify. Label: means name. Annotate: means write explanatory notes on your map or diagram. Maori concepts: aroha, kaitiakitanga, taonga. Perspectives: indigenous, scientific, gender.

32
91240 Demonstrate geographic understanding of a large natural landscape- The Amazon Basin Aspects are selected from: the characteristics of a large natural environment (and the patterns created by them) how the elements and processes of the large natural environment interact how a large natural environment is formed and changes over time (Natural landscapes evolve as elements (characteristics) and processes interact. This interaction varies in time and space. You need to be able to explain how characteristics and interaction varies from place to place.) how people interact with a large natural environment how people's perceptions of a large natural environment change over time(Perception of groups/individuals at 2 different points in time, and why their viewpoints have changed)
 how people interact with a large natural environment how people s perceptions of a large natural environment change over time(Perception of groups/individuals at 2 different points in time, and why their viewpoints have changed).")
33
Fact Sheet AMAZON Area of 7m sq km. Located close to equator, 5-10’S. On junction of Pacific Plate and S. American Plate Flood plain = Varzea/ Soil Terra Rosa(red earth) Amazon River largest in the Amazon Basin. Flows from Andes, which are fold mts in the W, created by 2 plates converging, where the river erodes, to the Atlantic Ocean in E, where the river deposits 3m tons of sediment. In the N is the Guyana Plateau and in the S the Brazilian Plateau. Experiences 2-3000mm rain p.a./ 26-29’C/ ITCZ brings a lot of the rain. 6,400km from source in Andes to sea, mouth 300km wide, contains 25% of earths fresh water, 33% of worlds tropical forests. The gradient is so small, it drops only 100m in height from Iquitos to the sea. Plants have medicinal purposes eg Catclaw-potential for curing cancer and aids. Trans Amazon highway-5,500km Recife to Peruvian border. completed 1975..
 Amazon River largest in the Amazon Basin. Flows from Andes, which are fold mts in the W, created by 2 plates converging, where the river erodes, to the Atlantic Ocean in E, where the river deposits 3m tons of sediment. In the N is the Guyana Plateau and in the S the Brazilian Plateau. Experiences mm rain p.a./ 26-29’C/ ITCZ brings a lot of the rain. 6,400km from source in Andes to sea, mouth 300km wide, contains 25% of earths fresh water, 33% of worlds tropical forests. The gradient is so small, it drops only 100m in height from Iquitos to the sea. Plants have medicinal purposes eg Catclaw-potential for curing cancer and aids. Trans Amazon highway-5,500km Recife to Peruvian border. completed")
34
Practice drawing sketch maps locating and labelling characteristics like landform features and vegetation To West of Amazon Basin-fold mts formed At plate boundary To N and S of Amazon Basin= remnants of Gondwanaland Sedimentary rocks Drained by Amazon R and tributaries

35
Remember you can draw a cross section

36
How the LANDFORMS in your large natural environment is formed and changes over time as elements (characteristics) and processes interact. You need to be able to explain how characteristics and interaction varies from place to place and from past to present.) Spatial variations in Amazon Landforms 1.Amazon Basin is a low-lying basin in the centre of the area. Manaus is only 44m above sea-level. Iquitos on the edge of the Andes is only 100m above sea level. It was created 10m years ago when the uplift of the Andes caused the Amazon to flow east into the Atlantic. Before this, it flowed west. 2. Varzea or flood plain is on either side of Amazon River. Flat area, 10-100m wide. Newest sediments replaced every year when river floods.. 3. Guyana shield mts to North 3000m at highest point. Brazilian Shield mts to South. Remnants of ancient Gondwanaland (500m years ago split up)that have been worn down (eroded) over time. Oldest features, ancient rocks. 4. Andes mts to West average 6000m high. As the Andes have been pushed upwards, the amazon river flowed toward the Atlantic fed by snow melt. 2m years ago, glaciation weathered and eroded the Andes, depositing the sediment in the Amazon Basin. 5. Coastal Plain is a flat area where the river meets the Atlantic, at the mouth marked by a geologically recent delta.
 Spatial variations in Amazon Landforms 1.Amazon Basin is a low-lying basin in the centre of the area. Manaus is only 44m above sea-level. Iquitos on the edge of the Andes is only 100m above sea level. It was created 10m years ago when the uplift of the Andes caused the Amazon to flow east into the Atlantic. Before this, it flowed west. 2. Varzea or flood plain is on either side of Amazon River. Flat area, m wide. Newest sediments replaced every year when river floods.. 3. Guyana shield mts to North 3000m at highest point. Brazilian Shield mts to South. Remnants of ancient Gondwanaland (500m years ago split up)that have been worn down (eroded) over time. Oldest features, ancient rocks. 4. Andes mts to West average 6000m high. As the Andes have been pushed upwards, the amazon river flowed toward the Atlantic fed by snow melt. 2m years ago, glaciation weathered and eroded the Andes, depositing the sediment in the Amazon Basin. 5. Coastal Plain is a flat area where the river meets the Atlantic, at the mouth marked by a geologically recent delta..")
37
Processes that produce the landforms. 1 Tectonic processes. 500m – 200m years ago. Subduction of Nazca Plate under South American Plate pushes up Andes fold mts. The rivers then flow eastwards as tributaries to the amazon and the sea. 2 River erosion and deposition. 1m years ago. Amazon has over 1,000 tributaries eg Tambopata River, eroding rocks of the Andes and depositing the recent sediments on the flood plain. 3 Climatic processes. Rainfall 2,500mm max, av temp 27*C. These wash sediment into the rivers and encourage weathering of rocks. 4 Vegetation processes eg roots that break up rocks.

38
Spatial patterns of vegetation 4 Thorn forest Coast salt winds 1 Selva-Seasonal rainforest Central area with av 27’C and 2700mm rain pa Caused by ITCZ 2 Evergreen rainforest In rain shadow of Andes 3 Savanna to N and S on higher plateax

39
How the VEGETATION/SOILS in your large natural environment is formed and changes over time as elements (characteristics) and processes interact. You need to be able to explain how characteristics and interaction varies from place to place and from past to present.) Vegetation 1. Selva –tropical rainforest in centre of Amazon Basin. Because of the high rainfall 2,500mm all year brought by ITCZ overhead all year. High temps 27*C all year due to sun being overhead, cause convectional rainfall. 2. Seasonal rainforest caused by rain shadow close to the Andes mts and because the ITCZ is only overhead for part of the year from March-Sept. 3. Savanna grassland 1m high to north and south of rainforest. Long dry season March-Sept as ITCZ has moved north and rain only 1700mm pa. 4. Coastal thorn forest has developed along the coast to resist salty winds. Soils 1. Alluvial deposits (Terra Rosa) after flooding of Amazon 2. Latosols on varzea rich in humus at top layer but leached below by heavy rains.
 Vegetation 1. Selva –tropical rainforest in centre of Amazon Basin. Because of the high rainfall 2,500mm all year brought by ITCZ overhead all year. High temps 27*C all year due to sun being overhead, cause convectional rainfall. 2. Seasonal rainforest caused by rain shadow close to the Andes mts and because the ITCZ is only overhead for part of the year from March-Sept. 3. Savanna grassland 1m high to north and south of rainforest. Long dry season March-Sept as ITCZ has moved north and rain only 1700mm pa. 4. Coastal thorn forest has developed along the coast to resist salty winds. Soils 1. Alluvial deposits (Terra Rosa) after flooding of Amazon 2. Latosols on varzea rich in humus at top layer but leached below by heavy rains..")
40
The ITCZ

41
The ITCZ moves as the earth moves around the sun – from the southern hemisphere (Jan) to the northern hemisphere (July). Equator

42
At the equator there is more concentrated insolation.

43
This creates an area of low pressure at the equator

44
As air rises at the equator air around the region is sucked towards the equator – the air that moves is called Trade Winds

45
Evolution and Change 500m yrs ago Gondawanaland split and convection currents began moving the plates. 90m yrs ago As S America moved W it collided with the Nazca plate moving E, pushing up the Andes fold mts. 10m yrs ago Amazon changed direction and flowed towards the Atlantic 2m yrs ago During the Ice age weathering (freeze-thaw) and glacial erosion broke up the sedimentary rocks of the Andes. Present Amazon transports sediment produced downstream and deposited it to form Amazon Basin
 and glacial erosion broke up the sedimentary rocks of the Andes. Present Amazon transports sediment produced downstream and deposited it to form Amazon Basin.")
46
How people interact with a large natural environment How people's perceptions of a large natural environment change over time(Perception of groups/individuals at 2 different points in time, and why their viepoints have changed)
")
47
Who are the People and groups whose activities impact on the Amazon? How people interact with their environment in a sustainable way. 1.Shifting Cultivation/Slash and Burn-Yanomami- nomads/leave land to regenerate when they move on. Enawene Nawe grow crops and fish in Juruena River. Only take what need to eat (kaitiakitanga) and fish reproduce. 2. Floodplain cultivation-cattle on rafts. Fertility of soil replaced each year by sediment deposited by flood. 3. Rubber tappers/Brazil Nutters-slash trees and collect sap and collect Brazil nuts. Trees are not damaged and continue to produce. 4. Eco-Tourism-sustainable eg Tambopata National Reserve, 1.3m hectare conservation area. -Medicines- Quinine/Cinchona Tree
 and fish reproduce. 2. Floodplain cultivation-cattle on rafts. Fertility of soil replaced each year by sediment deposited by flood. 3. Rubber tappers/Brazil Nutters-slash trees and collect sap and collect Brazil nuts. Trees are not damaged and continue to produce. 4. Eco-Tourism-sustainable eg Tambopata National Reserve, 1.3m hectare conservation area. -Medicines- Quinine/Cinchona Tree.")
48
The Yanomami (pop 9,000)live in ‘yanos’ which are large, communal dwellings made of tree trunks and thatches of palm leaves. There are between ten to twenty families that live in a yano. Each family has its own section and fire. These dwellings are only temporary and over a period of time they will become infested by cockroaches and bats. The Yanomami are semi nomadic. They build their yanos near suitable land for cultivation. The forest provides firewood, nuts, berries and animals to hunt. The Yanomami hunt, gather, fish and farm the land for 5 to 10 years and then move onto another area. This is called shifting cultivation.

49
How people interact with their environment in a non-sustainable way. 1.Cattle ranchers-remove trees for grass which results in soil erosion and leaching (loses 45% of nutrients in 3 Yrs). 38% of deforestation is caused by ranchers grazing cattle for beef patties for McDonalds. 2.Loggers eg Yari Project-destroyed native trees 3. Settlers. Colonisation Programme began 1985-over 2m settlers from poorer parts in the NE. Given 250 acres by government. Cut down trees and damage environment. 4. Modern development projects- mining iron ore at Carajas pollutes the environment, visual pollution of open-caste mine. 5 HEP dams to provide electricity flood native Indians land (Enawene Nawe) and prevent fish migration. 5 Trans-Amazon Highway encourages development along the road. 6 Iron-ore mining-Carajas results in visual pollution.
. 38% of deforestation is caused by ranchers grazing cattle for beef patties for McDonalds. 2.Loggers eg Yari Project-destroyed native trees 3. Settlers. Colonisation Programme began 1985-over 2m settlers from poorer parts in the NE. Given 250 acres by government. Cut down trees and damage environment. 4. Modern development projects- mining iron ore at Carajas pollutes the environment, visual pollution of open-caste mine. 5 HEP dams to provide electricity flood native Indians land (Enawene Nawe) and prevent fish migration. 5 Trans-Amazon Highway encourages development along the road. 6 Iron-ore mining-Carajas results in visual pollution..")
50
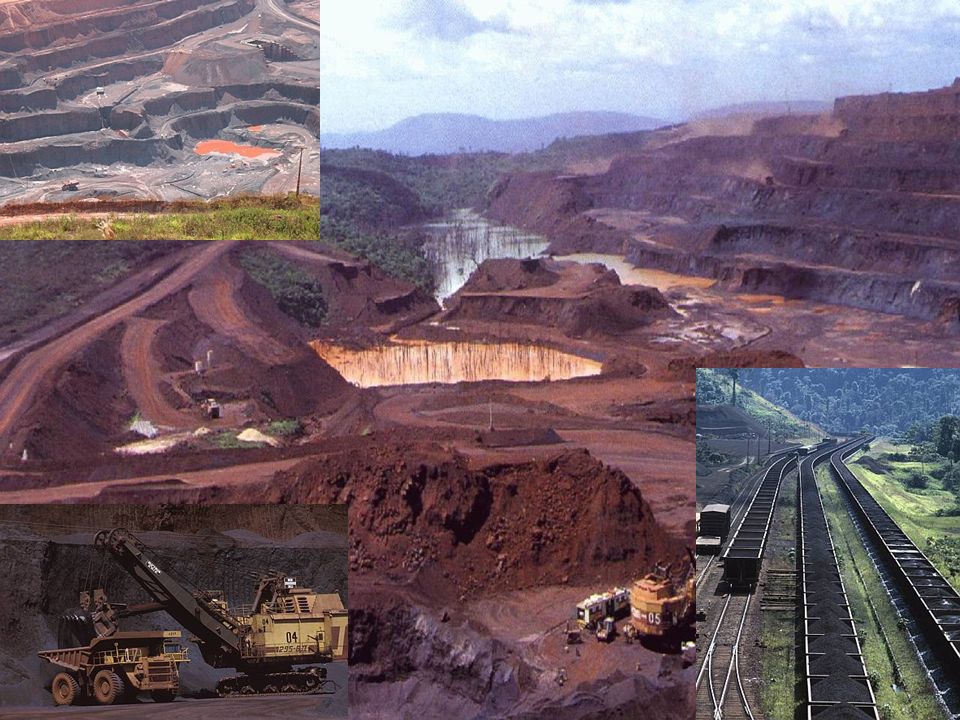
Iron ore Mining in the Amazon: Carajas Carajas Sao Luis Belem Tucurui TransAmazonian Highway rail link deep water port 0100km Carajas is an integrated mine- rail-port system processing 45 million tonnes of iron ore annually (plus manganese, gold). It is the backbone of development in the north of Brazil(680km SW of Belem). The mine contains 18 billion tonnes, taking 400 years to extract. It is one of the largest open cast mines in the world. Historically geologists found the iron ore in 1967, but it wasn’t until 1978 that the Carajas project began with the laying of 900km of railway. Costing more than NZ$6 Billion this mining project is the largest project in Brazil. A township was built to house employees, over 6000 – it is fully equipped with schools, farms, hospitals and recreation facilities. Only 1.6% of the 13,000 km ² of this project are assigned to mining activities and townships. However, the impact on the environment is significant.
. The mine contains 18 billion tonnes, taking 400 years to extract. It is one of the largest open cast mines in the world. Historically geologists found the iron ore in 1967, but it wasn’t until 1978 that the Carajas project began with the laying of 900km of railway. Costing more than NZ$6 Billion this mining project is the largest project in Brazil. A township was built to house employees, over 6000 – it is fully equipped with schools, farms, hospitals and recreation facilities. Only 1.6% of the 13,000 km ² of this project are assigned to mining activities and townships. However, the impact on the environment is significant..")
52
Impact of Mining on the Amazon Burning of trees for charcoal-now replaced by HEP. Forest cleared = increased erosion and silting up of rivers near open cast mine Chemicals used to purify the metals dumped into rivers – pollution and discolouring them Increased dust in the atmosphere – dust haze. Tailing dams built to hold waste materials (sludge from washing the ore). However, the official mines have made some efforts to repair some of the environmental damage they have caused. For example, at a large bauxite mine on the Trombetas River in the state of Para, the mining company has stopped dumping their tailings (sludge from washing the ore) into the river and they have started a reforestation project.
. However, the official mines have made some efforts to repair some of the environmental damage they have caused. For example, at a large bauxite mine on the Trombetas River in the state of Para, the mining company has stopped dumping their tailings (sludge from washing the ore) into the river and they have started a reforestation project..")
53
Sketch map/diagram to show human activities Amazon Carajas mine- Open cast Visual pollution Located by mineral deposits Amazon Indians Shifting cultivators Forest re-grows Located deep in Rain forest Ranchers destroy Forest for pasture S of Amazon. Soil loses fertility

54
How people's perceptions of a large natural environment change over time(Perception of groups/individuals at 2 different points in time, and why their viepoints have changed) 1 Native Indians-Enawene Nawe have become more militant. Live in Mato grosso state. In the past saw the land as theirs as indigenous people, now something to fight for. 11 dams planned on Juruena R. 16/8/2012 federal judge suspended work on massive Belo Monte Dam, costingUS $11billion as a result of activists who say it will devastate wildlife and livelihoods of 40,000 people who live in the area to be flooded. Interfere with Yakwa rituals. 2 Soya Bean King, mayor of Mato Grosso, Blair Maggio, now defending the forests. Past economic perspective-make money by cutting down forest and growing soya beans. 2003 destruction of the Amazon rose by 2/5ths. 2006 received “Golden Chainsaw Award” from Greenpeace. Aim to triple agricultural production in 10yrs. Now political viewpoint- needs votes to remain mayor and public opinion is defending the forests. He has created Amazon Biome and Cerrado Biome, land that cannot be cleared.

55
Demonstrate Geographic Understanding of Differences in Development Assessment will involve a selection of: Characteristics of development eg GDP, infant mortality(health), literacy (education) And explain how each demonstrate the difference in development between communities/areas. Ways development is perceived Ways development is measured and problems with measurement Natural factors that affect degree of development Cultural factors that affect degree of development Strategies for reducing differences in development

56
What is Development? The term "development" is often referred to as economic development or wealth. This does not always reflect the distribution of this wealth among the people. In addition to purely economic characteristics are often considered social dimensions of development or quality of life. Development always has a direction. If this direction is positive, then we speak of progress, if negative, of regression. Currently, the main purpose of socio-economic development in most countries is to improve the quality of life. Therefore, the process of socio-economic development includes three major components: 1 increase incomes, 2 improve health and 3 more education; This creates conditions conducive to the growth of self-esteem and human dignity of the people as a result of the formation of social, political, economic and institutional systems that give a degree of freedom to the people. Sustainable development is also becoming important.

57
Characteristics of development eg GDP, infant mortality(health), literacy (education) USA pop 300m, Afghanistan 22m. USA & Afghanistan HDI 0.939 0.346 GDP $46,000 $1,000 per head Literacy 99%24% People/ 520 1660 doctor Life 75/80 63/65 Infant deaths 8 257 Per 1000 births Media freedom 36 156 index

59
USAAfghanistan GDP World ranking2177 HDI World ranking12177 What do they tell us about development? That USA is wealthier, healthier, better educated and freer than Afghanistan. However, Objective Indicators are statistically measured and may mask differences within each country. USA - % below poverty line (1992) 14.5 but Delaware 7.6 Mississippi 24.5 Afghanistan – Adult literacy 24% Urban areas 54% Rural areas 18% Also, statistics may not include illegal income eg $4 billion from opium trade in Afghanistan. USA has between 7 – 20 million illegal immigrants whose income never appears in the official statistics. USA today has 700,000 homeless people. USA statistics includes $700billion food industry and half of them are overweight. Weight loss industry adds $32billion to the GDP.
 14.5 but Delaware 7.6 Mississippi 24.5 Afghanistan – Adult literacy 24% Urban areas 54% Rural areas 18% Also, statistics may not include illegal income eg $4 billion from opium trade in Afghanistan. USA has between 7 – 20 million illegal immigrants whose income never appears in the official statistics. USA today has 700,000 homeless people. USA statistics includes $700billion food industry and half of them are overweight. Weight loss industry adds $32billion to the GDP..")
60
LORENZ CURVE shows the distribution of income The lowest-income household in the United States oday is likely to be a black woman over 65 years of age who lives alone somewhere in the South and has fewer than nine years of elementary school education. The highest-income household in the United States today is likely to be a college-educated white married couple between 45 and 54 years of age living together with two children somewhere in the

61
What objective indicators tell us about development. Afghanistan is shown to be less developed. GDP $466 per head. Afghanistan 177 th in world according to GDP and HDI. GDP is low BECAUSE— Afghanistan has few Exports with a value of only $576m. Exports to Pakistan 55% India 12% Iran 2% (fruit, nuts, carpets) Not enough is earned to buy even necessities (food, oil, manufactured goods). As a result, their standard of living is low. Imports value $2,513m and come from Pakistan 17% China 15% Japan 12%. This uses money that could otherwise be spent on health, education etc GDP is also low because Afghanistan is 49% mountainous so even though agriculture is the main industry, it is mostly subsistence and contributes very little to development. 78% of the people work in agriculture but it only contributes 31% to GDP. Only 22% live in urban areas, where most industries are located. Many do not attend school making it hard for young people to get jobs even if there were jobs available. Youth literacy rates M 49% F 18%. Those that live in urban areas have access to improved drinking water(78%) meaning they are healthier and contribute more to GDP, while only 37% in rural areas have improved drinking water, meaning they are more susceptible to diseases and not as productive. Also, 35% of people are unemployed and so contribute nothing to GDP. Afghanistan has minerals (iron copper gold silver in NE and emerald in SE) but no money to develop them and they are not accessible. $57b AID money has been pledged by other countries since 2002 but too much conflict for development.
 Not enough is earned to buy even necessities (food, oil, manufactured goods). As a result, their standard of living is low. Imports value $2,513m and come from Pakistan 17% China 15% Japan 12%. This uses money that could otherwise be spent on health, education etc GDP is also low because Afghanistan is 49% mountainous so even though agriculture is the main industry, it is mostly subsistence and contributes very little to development. 78% of the people work in agriculture but it only contributes 31% to GDP. Only 22% live in urban areas, where most industries are located. Many do not attend school making it hard for young people to get jobs even if there were jobs available. Youth literacy rates M 49% F 18%. Those that live in urban areas have access to improved drinking water(78%) meaning they are healthier and contribute more to GDP, while only 37% in rural areas have improved drinking water, meaning they are more susceptible to diseases and not as productive. Also, 35% of people are unemployed and so contribute nothing to GDP. Afghanistan has minerals (iron copper gold silver in NE and emerald in SE) but no money to develop them and they are not accessible. $57b AID money has been pledged by other countries since 2002 but too much conflict for development..")
62
What objective indicators tell us about development. USA is more developed than Afghanistan. USA’s GDP is $52,000. USA is 12 th wealthiest country in the world according to HDI and 2 nd wealthiest according to GDP This is because USA has more investment in industries like oil (Exxon Mobll, Texas 1 st ), Electronics (Hewlett Packard, California 29 th ), chemicals, cars (General Motors, Detroit 20 th largest), as well as agricultural production of wheat, cattle etc. USA exports these products to earn more money. USA’s exports= $ 1.024trillion (no 3 =cars) To Canada (20%), Mexico (12%), China (6%) These fund many and varied imports that improve the USA’s standard of living ( no 3 medicines) Imports $2.01 trillion, from China (17%) Canada (16%) Mexico (10%) USA has a varied economy with services (50%) contributing most to GDP and over 80% of population live in urban areas where services are the main employers and industries are located.
, Electronics (Hewlett Packard, California 29 th ), chemicals, cars (General Motors, Detroit 20 th largest), as well as agricultural production of wheat, cattle etc. USA exports these products to earn more money. USA’s exports= $ 1.024trillion (no 3 =cars) To Canada (20%), Mexico (12%), China (6%) These fund many and varied imports that improve the USA’s standard of living ( no 3 medicines) Imports $2.01 trillion, from China (17%) Canada (16%) Mexico (10%) USA has a varied economy with services (50%) contributing most to GDP and over 80% of population live in urban areas where services are the main employers and industries are located..")
63
Ways in which development can be perceived: Rostow model

64
This is the American view of DEVELOPMENT. This shows how economic growth is basic to development. A country will not develop unless specialisation and industrial development, mass production, production of a surplus and trade occur.eg the 1887 gold rush in California, industrial use in phones etc and mass production and sale worldwide providing income to buy other countries goods and invest in health etc. They also think that Less developed countries should strive for economic /industrial growth to develop.

65
Alternative views would be 1.to provide basic needs like health, help women, men and indigenous people to develop their own small-scale industries that encourage sustainable development. eg Afghanistan growing safron that has a high price in world markets. 2.Communist viewpoint has not worked in Afghanistan. Based on equality for owners and workers in productive industries.

66
Afghanistan Natural Factors Landlocked by 6 countries so difficult to export and import and only 1 river flows to the sea via Indus R in Pakistan 75% Mountainous non-productive and inaccessible, Hindu Kush over 7,000m Dry, continental climate, 49*C-4.9*C, 350mm rain pa means agriculture difficult Earthquakes 1998 killed 4,700, Drought 2006 affected 2.5m people making life and subsistence difficult. Natural disasters discourage development, especially in Afghanistan where more people are affected Earthquakes in Hindu Kush eg 1998 killed 4,700. 9 major quakes since 2000. Located on the Eurasian Tectonic Plate- very active. Arid/Semi-arid eg 2006 2.5m people affected by poor cereal crops. When rains come, floods can cause damage+Insect infestations

67
Afghanistan: Natural Factors Landlocked by 6 countries. Only river link to sea via Indus R in Pakistan 75% upland 40% over 2,000m and Hindu Kush over 7,000m Climate dry continental with hot summers 49*C Cold winters-4.9*C rain only 350mm pa Hindu Kush, NE, earthquakes 1998 killed 4,700 Drought 2006 affected 2.5m

68
How natural factors contribute to disparities 1 Afghanistan landlocked by 6 countries (name them) which has slowed development because trade is difficult. Only one river (Kabul R) goes to sea via Pakistan, exports $576m imports $2,513m very small cf USA. In addition, the countries like Pakistan around them are known to shelter Taliban and make exports and imports difficult. 2 Afghanistan mostly mts (75% and Hindu Kush over 7,000m) slowed development because accessibility and transport difficult, exporting products is hard 3 Climate conditions are too harsh to grow crops (49to -4.9 temp range and 350mm rain pa), instead keep goats and sheep, yet 78% work in agriculture and contribute only 31% to GDP 4 Sparse population (88% rural cf USA 80% urban) means no economies of scale
 goes to sea via Pakistan, exports $576m imports $2,513m very small cf USA. In addition, the countries like Pakistan around them are known to shelter Taliban and make exports and imports difficult. 2 Afghanistan mostly mts (75% and Hindu Kush over 7,000m) slowed development because accessibility and transport difficult, exporting products is hard 3 Climate conditions are too harsh to grow crops (49to -4.9 temp range and 350mm rain pa), instead keep goats and sheep, yet 78% work in agriculture and contribute only 31% to GDP 4 Sparse population (88% rural cf USA 80% urban) means no economies of scale.")
69
Afghanistan Cultural Features It has had Monarchy, Republic Communism, Theocracy/Taliban Islamic republic/ democracy Years of political instability and civil war Gender inequalities Refugees 5m to Pakistan during Russian invasion Exports $276m Supplies 93% of the worlds opium. Main industries: agricultural processing, carpet manufacture, production of dried fruit. Median household income $1,000pa 78% work in agriculture, but only 31% of GDP 35%unemployed $5.7billion aid pledged but unused 1 Population 22m 2 Average family size:7.2 children 3 Race Pushtan-42% Tajik-27% Uzbek-9% Aimak-4% Turkmen-3% 4 Religion 99% muslim

70
Afghanistan: Cultural Factors Politically unstable since Alex the Great. Monarchy 1933-1973,King Zahir Shah, communist rule 1978, USSR 1979-1989, Theocracy Taliban 1996-2004, Democratically elected Islamic Republic 2004 And 2009 elected Hamid Karzai. Produce 93% worlds opium illegally. Other produce carpets, dried fruit. Has minerals oil etc but not extracted due to war During soviet occupation, over 5m refugees fled to Pakistan

71
How cultural factors contribute to disparities Afghanistans development has been held back to 177 th in the world by GDP and HDI, because of the political situation. Afghanistan unstable since late 1700’s absolute monarchy(King Zahn 1933- 1972) put his own interests before the country, hindering growth, PDPA promoted womens rights, USSR invaded causing conflict with American backed Mujihadeen. Stopped development and cost money that might have gone into development and 5m educated refugees fled the country. War also killed males. 1996 Taliban put restrictions on women and technology (eg lack of investment in clean drinking water in rural areas where only 37% have clean water, urban areas have more investment and 78% have clean water) hindering development further. Today Islamic democracy but still corrupt and busy fighting Taliban with US, Aust, UK troops, destroying any hope of growth. $57m of aid has been pledged since 2002 but has not been used because of the situation. Lack of imports and exports. GDP per capita only $466 cf USA $52,000. Also, the lack of education, the position of women etc Youth literacy rates show that males 49% literate, females 18% literate. How can growth occur when half of the population are not formally educated?
 put his own interests before the country, hindering growth, PDPA promoted womens rights, USSR invaded causing conflict with American backed Mujihadeen. Stopped development and cost money that might have gone into development and 5m educated refugees fled the country. War also killed males Taliban put restrictions on women and technology (eg lack of investment in clean drinking water in rural areas where only 37% have clean water, urban areas have more investment and 78% have clean water) hindering development further. Today Islamic democracy but still corrupt and busy fighting Taliban with US, Aust, UK troops, destroying any hope of growth. $57m of aid has been pledged since 2002 but has not been used because of the situation. Lack of imports and exports. GDP per capita only $466 cf USA $52,000. Also, the lack of education, the position of women etc Youth literacy rates show that males 49% literate, females 18% literate. How can growth occur when half of the population are not formally educated .")
72
USA: Natural Factors. 1 2 3 location-surrounded by 3 oceans Climate varies from tundra in N to tropical in S And from mediterranean in w to humid sub-tropical in E. Land varies from Rocky Mts W, logging, skiing to fertile Grt Plains, Growing wheat. Excellent waterways for transport Mississippi R, Grt Lakes waterway 800kms. Hurricanes like Katrina 2005 killed 1,836

73
USA 3 coastlines for exports and imports; Atlantic, Pacific, Gulf of Mexico. Excellent waterways for transport to the sea: Grt Lakes 800kms to the Atlantic, Mississipi River from Grt Plains to Gulf of Mexico. Large areas of flat land for agriculture: Grt Plains Mt ranges like Rocky Mts for recreation, forestry Varied climates for all types of agriculture: tundra N to tropical S, Mediterranean W to Sub tropical E. Hurricanes eg Katrina 2005 killed 1,836, Tornadoes, Volcanic eruptions eg Mt St Helens 1980 killed 57. Still erupting in 2004

74
How natural factors contribute to disparities Location has aided the development of the USA. 1 It has 3 coastlines (Atlantic, Pacific, Gulf of Mexico) helped development because world trade in manufactured and agricultural goods easy and cheap. Exports US$1.02trillion Imports US$2,513trillion. Countries traded with include Asian tigers like China. Large city ports like New Orleans have dev. Trade generates overseas income that can be used for schools, hospitals. 2 USA has flat land Great Plains, used for wheat growing and Rocky Mts used for tourism, skiing and logging so that everything they need and a surplus is produced here. 3 Climate varies from Tundra to Tropical, mediterranean to sub- tropical means that all types of crops can be grown. 4 Transport of goods and minerals is easier because of water routes like Grt Lakes 800kms for transport of iron ore, coal, and Mississippi River network.
 helped development because world trade in manufactured and agricultural goods easy and cheap. Exports US$1.02trillion Imports US$2,513trillion. Countries traded with include Asian tigers like China. Large city ports like New Orleans have dev. Trade generates overseas income that can be used for schools, hospitals. 2 USA has flat land Great Plains, used for wheat growing and Rocky Mts used for tourism, skiing and logging so that everything they need and a surplus is produced here. 3 Climate varies from Tundra to Tropical, mediterranean to sub- tropical means that all types of crops can be grown. 4 Transport of goods and minerals is easier because of water routes like Grt Lakes 800kms for transport of iron ore, coal, and Mississippi River network..")
75
Natural Resources are important in the degree of development of a country USA: Worlds 2 nd largest producer of copper and gold, exports $26 billion of minerals and employs 3m people. This provides income for the country to invest in other areas and for families to spend on their own welfare. Eg 1848 Californian gold rush, 1879 oil California, 1887 oil Texas. www.msha.gov/KIDS/MINING.HTMwww.msha.gov/KIDS/MINING.HTM AFGHANISTAN: exploitation of minerals began 1960’s. USSR piped oil and gas across Amu Darya until 1980’s. By 1990, situation meant little mineral or oil or gas mined. www.bbc.co.uk/news/10311752 www.bbc.co.uk/news/10311752 (Aug 2011) stated that $1trillion worth of mineral deposits have been found. Iron, copper (Aynak mine owned by China), cobalt, gold in Pashtun area of S Afghanistan, lithium. Comparison: cement production 2kg/200kg per capita.
 stated that $1trillion worth of mineral deposits have been found. Iron, copper (Aynak mine owned by China), cobalt, gold in Pashtun area of S Afghanistan, lithium. Comparison: cement production 2kg/200kg per capita..")
76
USA: Cultural Factors. 1 2 3 Political stability since 1788 constitution George Washington, election every 4 yrs Median household income $52,000pa NY $56,000 Mississippi $37,500 Industries oil BP Industries cars Detroit Industries electronics Silicone Valley Mining iron Appalachian Mts 25% have batchelors degree, 27% NY, 16% mississippi.

77
USA Cultural Features Democratic/Politically stable since 1788 Elections every 4 yrs Exports $1.02trillion Main industries: petroleum, steel, motor vehicles, aerospace, telecommunications, chemicals, electronics, food processing, consumer goods, timber, mining, arms, 50% work in service industries Gender equality -1920 women given the vote in USA. First woman in congress in 1916 was Jeannette Rankin. Today congress has 259 women. Median household income $52,000pa Educated:25%Batchelors degree 1 Population 300m 2 Av family size 2 children 3 Race White-80% African/American-13% Asian-4% Native American-1% Hawaiin-0.2% Mixed-1.8%

78
How cultural factors contribute to disparities Government/Political Stability contributes to the development of USA. USA has been a representative democracy since 1788. To remain in power, government is elected every 4 yrs and they try to please the people and encourage growth of industry, agriculture and increase prosperity to gain votes eg recent health reforms by Obama eg helping car industry in Detroit to survive depression and promoting educational success for all(25% have Bachelors degree) USA’s GDP is $52,000. USA is 12 th wealthiest country in the world according to HDI and 2 nd wealthiest according to GDP This is because USA has more investment in industries like electronics, chemicals, cars, Agricultural production of wheat, cattle and exports these products. USA’s exports= $1.024trillion, to Canada (20%), Mexico (12%), China (6%) These fund many and varied imports that improve the USA’s standard of living eg Imports $2.01 trillion, China (17%) Canada (16%) Mexico (10%) USA has a varied economy with services 50% contributing most to GDP and over 80% of population live in urban areas where services are the main employers. This life style requires energy and energy consumption per capita=7039 kilograms of oil equivalent (650% higher than Afghanistan)
 USA’s GDP is $52,000. USA is 12 th wealthiest country in the world according to HDI and 2 nd wealthiest according to GDP This is because USA has more investment in industries like electronics, chemicals, cars, Agricultural production of wheat, cattle and exports these products. USA’s exports= $1.024trillion, to Canada (20%), Mexico (12%), China (6%) These fund many and varied imports that improve the USA’s standard of living eg Imports $2.01 trillion, China (17%) Canada (16%) Mexico (10%) USA has a varied economy with services 50% contributing most to GDP and over 80% of population live in urban areas where services are the main employers. This life style requires energy and energy consumption per capita=7039 kilograms of oil equivalent (650% higher than Afghanistan).")
79
You must explain HOW the information you give on the factor chosen contributes to development or lack of development and give specific detail on the effect. Eg political stability (USA since 1788 constitution, democratic govt. elected every 4 yrs) Contributes to high level of dev. because 1 elected governments try to please the people who will then re-elect them and this encourages growth of industry, agriculture and increase prosperity to gain votes eg recent health reforms by Obama eg helping car industry in Detroit to survive depression and promoting educational success for all(25% have Bachelors degree) 2 political stability in USA enables industries like electronics(silicon valley, california), chemicals, cars, to grow large and gain economies of scale. Political continuity and peace enabled investment in aerospace, NASA, Cape Canaveral space centre. 3 mass production of agricultural products like wheat, cattle and thus creates a surplus for export. USA’s exports= $1.024trillion, to Canada (20%), Mexico (12%), China (6%) These make many and varied imports possible that improve the USA’s standard of living eg Imports $2.01 trillion, China (17%) Canada (16%) Mexico (10%) Stability allows relations with other countries to grow.
 Contributes to high level of dev. because 1 elected governments try to please the people who will then re-elect them and this encourages growth of industry, agriculture and increase prosperity to gain votes eg recent health reforms by Obama eg helping car industry in Detroit to survive depression and promoting educational success for all(25% have Bachelors degree) 2 political stability in USA enables industries like electronics(silicon valley, california), chemicals, cars, to grow large and gain economies of scale. Political continuity and peace enabled investment in aerospace, NASA, Cape Canaveral space centre. 3 mass production of agricultural products like wheat, cattle and thus creates a surplus for export. USA’s exports= $1.024trillion, to Canada (20%), Mexico (12%), China (6%) These make many and varied imports possible that improve the USA’s standard of living eg Imports $2.01 trillion, China (17%) Canada (16%) Mexico (10%) Stability allows relations with other countries to grow..")
82
Strategies for reducing differences in development Countries need leaders who are committed to achieving growth. "We chose to focus on growth because we think that it is a necessary condition for the achievement of a wide range of objectives that people and societies care about. One of them is obviously poverty reduction, but there are even deeper ones. Health, productive employment, the opportunity to be creative, all kinds of things that really matter to people seem to depend heavily on the availability of resources and income, so that they don't spend most of their time desperately trying to keep their families alive." Michael Spence, Chair, Commission on Growth and Development

83
Policymakers zero in on two areas to grow Afghanistan's $11.4 billion economy: agriculture and mining. Mining is currently a $52 million a year industry – less than 1 percent of the economy. But a few big-name projects highlight its potential. In a deal with the Chinese in 2007, the Aynak copper mine will bring in $1 billion of annual revenue for Kabul. And bids were due Feb. 15 to exploit Hajigak, a massive iron ore deposit.Kabul "That's estimated to bring in up to $3 billion a year in government revenues for centuries," says Craig Steffensen, Afghanistan country director for the Asian Development Bank. "I think the mining sector is this magic bullet that everyone is looking for to sustain things without [foreign donors] having to cover costs until kingdom come."Craig Steffensen Asian Development Bank Of course, magic bullets are rare. Western investors have hesitated to enter Afghanistan because of an uncertain regulatory environment, corruption, lack of transparency, and lack of security, says James Yeager, an American geologist who advised the Afghan Ministry of Mines.James Yeager

84
Other projects: Marriott Hotels invested $80 million to build a hotel and expand operations into Afghanistan. Construction started last spring and is expected to be completed by the end of 2010, according to a Marriott press release. Another document shows that David Murdock, chairman of Dole Foods Company, visited Afghanistan in 2007 to discuss a potential Afghan presence for the company. The country’s progress is still largely dependent on foreign aid. One such program lending a hand to the country is the Kabul International Ag Fair. The fair – a project assisted by USAID – ran yearly from 2007-2009, attracting 40,000 to 60,000 visitors through two days. According to the Ag Fair’s website, the festival’s even attracted an American sponsor – the Afghan affiliate of U.S. based Coca-Cola. Anderson said the largest progress is in the urban and stable areas of the North, with the rest of the country still in need of attention.

85
Afghanistan’s economy saw record real GDP growth in 2009/10 at 22.5 percent. Since 2002/03 the country has seen average growth rates in the double digits, but with great volatility because of its heavy reliance on agriculture, which is subject to weather fluctuations. Even with an uncertain and deteriorating security situation, strong output was driven by increased donor spending – a 24 percent increase in core budget donor grants and about US$ 4 billion in off-budget donor funding – and recovery from the severe drought of 2008/09. Last year’s harvest led to agriculture output growth of 36 percent (constant 2002/03 prices) and the non-agricultural component of 14 percent. However there are a number of economic indicators suggesting that Afghanistan is on an unsustainable growth path. The country is highly aid dependent with foreign aid disbursements of 47 percent of GDP in 2008/09. Only little is produced for export purposes while the country depends heavily on imports for reconstruction and food. Another major concern is the fact that gross revenues from opium trade are estimated to be equivalent to as much as third of measured GDP (opium is not reflected in the official GDP numbers). Afghanistan is the source of 93 percent of the world’s opium production and the area under cultivation more than doubled from 2003 to 2007.
 and the non-agricultural component of 14 percent. However there are a number of economic indicators suggesting that Afghanistan is on an unsustainable growth path. The country is highly aid dependent with foreign aid disbursements of 47 percent of GDP in 2008/09. Only little is produced for export purposes while the country depends heavily on imports for reconstruction and food. Another major concern is the fact that gross revenues from opium trade are estimated to be equivalent to as much as third of measured GDP (opium is not reflected in the official GDP numbers). Afghanistan is the source of 93 percent of the world’s opium production and the area under cultivation more than doubled from 2003 to")
Similar presentations


 World Bank Currency: Renminbi Gross domestic product:>")


