Download presentation
Presentation is loading. Please wait.

1
Update on EMIS 12-13 PDV, ESWG April 2013 Sources used: EMIS 12-13, Commune Database 2011, Jim Shoobridge report

2
Grade Specific Enrolments Grade 6Grade 7Grade 9Grade 10G10/6G7/6G10/9 2000-1 179,988 131,385 60,098 27,709 2001-2 211,108 153,700 86,237 40,883 0.85 0.68 2002-3 236,150 180,906 107,908 52,557 0.86 0.61 2003-4 282,746 201,095 116,219 66,655 0.85 0.62 2004-5 324,586 237,829 130,420 67,707 0.38 0.84 0.58 2005-6 330,801 268,087 134,023 89,383 0.42 0.83 0.69 2006-7 322,138 268,120 151,878 90,315 0.38 0.81 0.67 2007-8 293,632 259,480 169,055 109,629 0.39 0.81 0.72 2008-9 277,153 234,800 169,931 121,637 0.37 0.80 0.72 2009-10 274,689 226,033 172,864 124,607 0.38 0.82 0.73 2010-11 275,253 223,490 158,328 124,820 0.39 0.81 0.72 2011-12 283,920 221,166 146,106 112,081 0.38 0.80 0.71 2012-13 275,171 226,517 138,108 101,536 0.37 0.80 0.69 Note: absolute numbers …. But no improvement in proxy effeciency

3
Enrolment by Grade Source: EMIS 12-13

4
Pop 6-11 2011-122012-13 Province Aged 6-11 Change Total Banteay Meanchey 88,88990,695102.0% Battambang 135,643138,305102.0% Kampong Cham 220,914220,929100.0% Kampong Chhnang 65,99666,992101.5% Kampong Speu 103,071104,128101.0% Kampong Thom 91,38191,977100.7% Kampot 80,58580,932100.4% Kandal 127,086128,878101.4% Kep 5,3835,554103.2% Koh Kong 16,90817,415103.0% Kratie 48,87049,803101.9% Mondul Kiri 10,46410,833103.5% Otdar Meanchey 30,12031,299103.9% Pailin 9,69810,244105.6% Phnom Penh 120,717125,476103.9% Preah Sihanouk 26,74527,426102.5% Preah Vihear 27,49927,913101.5% Prey Veng 128,831128,849100.0% Pursat 53,92754,577101.2% Ratanak Kiri 25,60626,109102.0% Siemreap 128,146131,259102.4% Stung Treng 17,30217,641102.0% Svay Rieng 60,74260,798100.1% Takeo 113,599113,792100.2% Whole Kingdom1,738,1221,761,825 101.4% - Urban Area 322,191330,635102.6% - Rural Area 1,415,9301,431,190101.1% Increase in Urban Pop Increase Remote provinces Interesting: Kg Cham Prey Veng Svay Rieng Takeo Populated provinces

5
Successful Re-entry ??? Unlikely. Change in Enrolment by Grade compared to previous year Province Grade 4Grade 5Grade 6 Banteay Meanchey 101%111%95% Battambang 98%105%97% Kampong Cham 121%156%97% Kampong Chhnang 104%112%99% Kampong Speu 96%100% Kampong Thom 98%105%95% Kampot 98%105%98% Kandal 102%164%99% Kep 80%124%97% Koh Kong 95%119%98% Kratie 96%111%97% Mondul Kiri 108%143%81% Otdar Meanchey 104%108%102% Pailin 126%130%110% Phnom Penh 103%115%90% Preah Sihanouk 102%121%94% Preah Vihear 102%108%86% Prey Veng 102%129%97% Pursat 93%128%99% Ratanak Kiri 116%124%106% Siemreap 109%138%99% Stung Treng 106%100%99% Svay Rieng 94%119%98% Takeo 95%108%98% Whole Kingdom 103%124%97% - Urban Area 103%114%94% - Rural Area 103%126%98% Unrealistic changes in Grade 5 Enrolment Almost throughout the country EMIS error? Feedback from Kg Cham: POE/DOE/schools: All: EMIS not correct, even at school level big differences, and even by gender This makes it unlikely that it is a processing error (e.g. SPSS script) Impact on PNER can be 2-2.5 PP
 Impact on PNER can be PP.")
6
Comparing EMIS G 5 enrolment with POE Kg Cham Grade 5 Enrolment Perc EMIS POEEMIS higher District2011-122012-13 Batheay 2,890 4,283 2,822 152% Chamkar Leu 2,583 3,520 2,728 129% Cheung Prey 2,331 3,722 2,246 166% Dambe 1,992 3,854 2,151 179% Kampong Cham 783 982 819 120% Kampong Siem 2,439 4,108 2,487 165% Kang Meas 2,329 3,550 2,119 168% Koh Sotin 1,589 2,008 1,539 130% Krauch Chhmar 1,907 2,771 2,084 133% Memot 3,717 6,927 4,016 172% O Raing Euv 2,222 3,481 2,258 154% Ponhea Krek 3,192 4,566 3,588 127% Prey Chhor 3,038 4,827 3,224 150% Srey Santhor 2,281 3,312 2,280 145% Steung Trang 2,721 4,971 2,934 169% Suong 714 959 674 142% Tbaung Khmum 3,613 5,145 3,946 130% Whole Province 40,341 62,986 41,915 150%

7
% Over-age Enrolment 2011-122012-13Change in Province % Over-age Enrollment (Total) Percentage Points PrimaryL.Sec.PrimaryL.Sec. Kampong Cham24.237.732.029.6 7.9-8.1 Kampong Speu19.837.214.828.6 -5.0-8.6 Kep21.740.39.032.0 -12.8-8.3 Koh Kong24.948.711.342.7 -13.6-6.0 Otdar Meanchey21.951.117.541.3 -4.4-9.8 Phnom Penh16.227.07.022.9 -9.1-4.1 Preah Vihear28.051.421.246.0 -6.8-5.4 Stung Treng19.348.110.842.7 -8.5-5.4 Svay Rieng23.037.222.227.3 -0.8-9.9 Kingdom21.836.121.429.4 -0.4-6.7 - Urban Area8.531.010.226.7 1.7-4.3 - Rural Area24.037.423.230.1 -0.8-7.3 Some big changes Kg Cham ?? Impact on NER! PNER: provinces with considerably smaller % over-age: NER goes up Note: Big change for LS

8
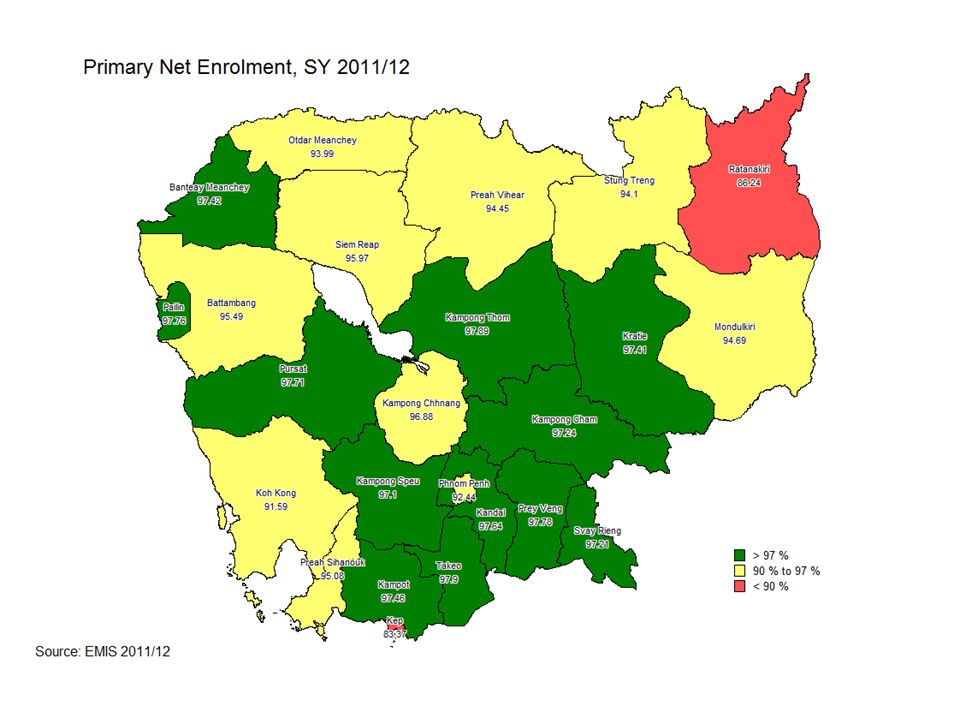
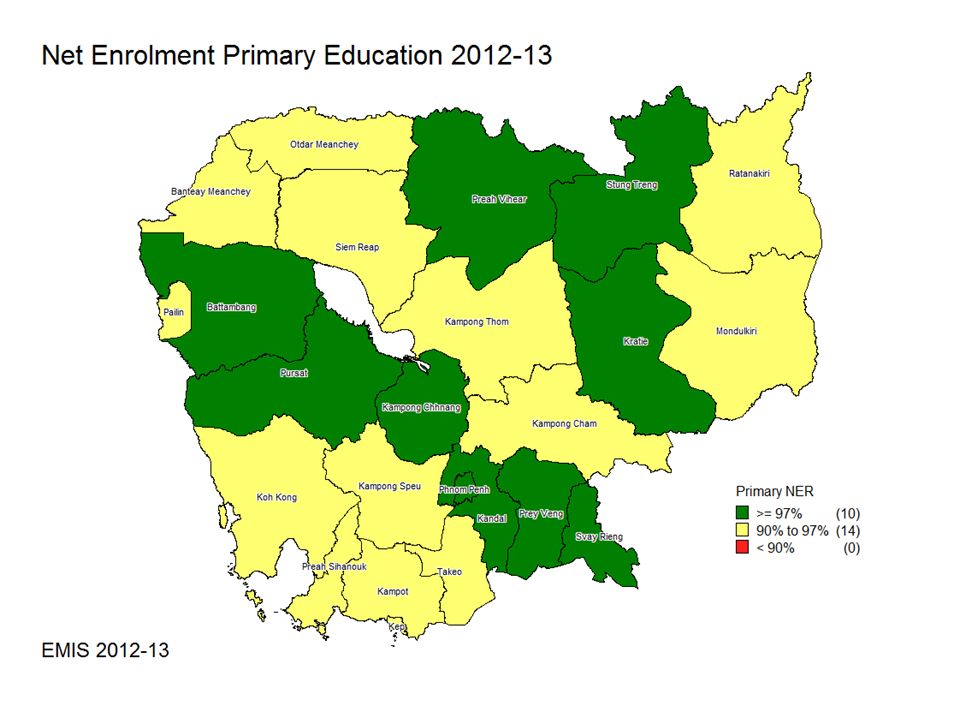
71 districts NER >= 100 15 < 80 For both: In some Surprising areas Primary NER 2012-13 (EMIS)
")
12
the regional gap has narrowed substantially 12 1: Education

13
119 districts < 80 = below target But: Private school data impacts for urban areas Need further analysis Primary Completion 2012-13 (EMIS)
")
14
Percent Enrolment in Private Primary Schools in Top 12 Districts 14 Source: CDB 2011 Commune Database: About 48,000 students in Private Primary Schools About 2% of 2.2 Million But about 15% of urban enrolment of 325,020. CDB: Annual, collected in December from communes and village chiefs National coverage M o Planning Wealth of data 1: Education PCRs Phnom Penh: -PPM: 50.7% -CHKM: 56.5% -DPH: 96.0% -TK: 84.5% -MCH: 79.6 % 50.7 56.5

15
Cambodia is on track to achieve Primary NER Targets by 2015 15 EMIS2012/13 TOTAL 87.35 URBAN 71.79 RURAL 90.86 EMIS2012/13 TOTAL 94.3 URBAN 76.7 RURAL 98.6 EMIS2012/13 TOTAL 97.0 URBAN 83.2 RURAL 100.2 U RBAN NUMBERS ARE LOWER IN EMIS: N O CAPTURING OF PRIVATE SCHOOLS 1: Education Primary Net Enrolment Primary Gender Parity

16
1) C ONSIDERABLE G AP EMIS E NROLMENT ( EXCL PRIVATE ) AND A TTENDANCE DATA FROM CDB, DHS, C ENSUS, CSES, AND 2) T REND IS LESS POSITIVE THAN EMIS 16 1: Education
 C ONSIDERABLE G AP EMIS E NROLMENT ( EXCL PRIVATE ) AND A TTENDANCE DATA FROM CDB, DHS, C ENSUS, CSES, AND 2) T REND IS LESS POSITIVE THAN EMIS 16 1: Education")
17
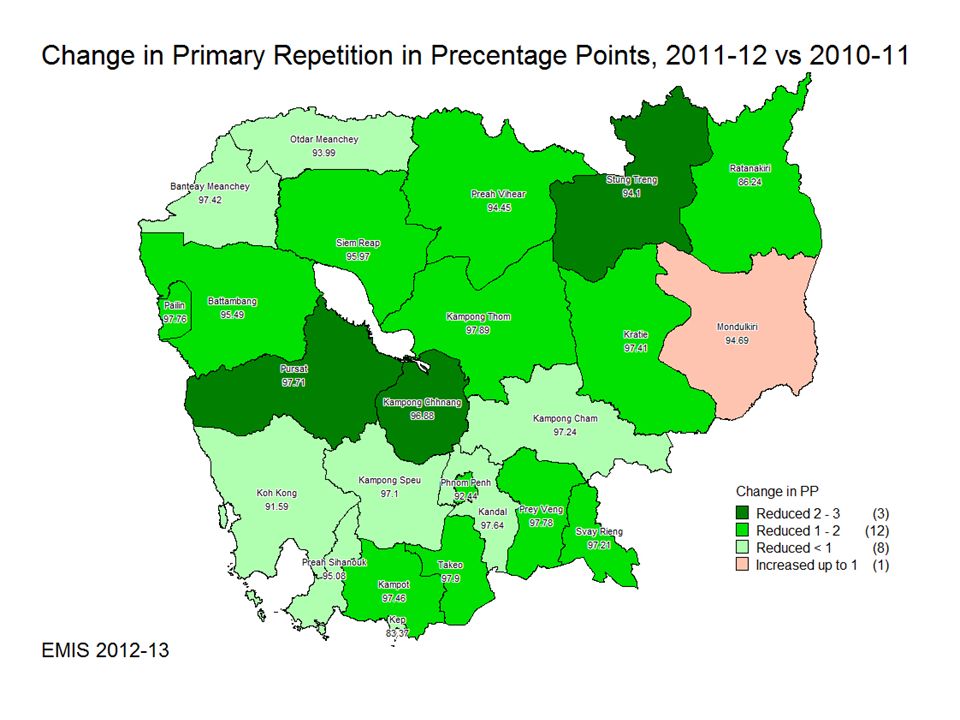
Repetition by Level

18
No more Survival Rates …. But..

19
LSS NER has doubled in the last 10 years, but it is much below even the reduced MDG target … … ALTHOUGH IT SEEMS TO BE PICKING UP RECENTLY AFTER SOME STAGNATION 19 1: Education

20
there is recent progress with repetition rates, B UT DROP OUT RATES HAVE REMAINED STAGNANT … M O EYS T ARGET WAS TO HALF R EPETITION AND D ROP O UT RATES BETWEEN 2007/08 AND 2014/15 20 1: Education

21
The transition rate to LSS is less than projected and stagnating … A ND THE DROP OUT RATE IN LSS REMAINS HIGH 21 T HESE REPRESENT A 40% L OSS TO THE HUMAN RESOURCE DEVELOPMENT PROCESS 1: Education

22
That’s It For now … Next: - a bit more analysis - come up with main issues to be improved - check with DoP

Similar presentations


 - water 4,520 km².>")

 Lessons.>")
![Irrigation Service Centre Project Part III: Results [July 2009 to June 2010] Coordination meeting 24 August 2010 A. Deligne, L. Piseth, S. Sophak.](/13/4131874/big_thumb.jpg "Irrigation Service Centre Project Part III: Results [July 2009 to June 2010] Coordination meeting 24 August 2010 A. Deligne, L. Piseth, S. Sophak.>")
