Download presentation
Presentation is loading. Please wait.

1
Ecology – Organisms & Their Environment Dr. Childs Science Computer Lab Spring, 2005

2
Ecology Ecology is the interaction of living organisms and their environment This lesson will emphasize: Relationships between organisms Food webs

3
Biotic & Abiotic Factors Biotic Factors - Living organisms Abiotic Factors– Nonliving

4
Biotic Factors Plants & Animals

5
Abiotic Factors Soil Sunlight Water Climate Rocks Air

6
Aquatic Ecosystem Population Community Ecosystem Terrestrial Ecosystem Organism Relationships Marine Ecosystem

7
Organism - A single living individual

8
Population - -A group of organisms of the same species - -Live in same area - - Interact & interbreed

9
Community - -Populations of different species of plants and animals that live together and interact with each other

10
Ecosystem - -A community with biotic and abiotic factors. - -terrestrial land - -aquatic fresh water - -marine salt water

11
Ecosystem

12
Terrestrial Ecosystem - -Terrestrial ecosystem - -Examples: - - forest - desert - - field - jungle - - large dead tree

13
Aquatic Ecosystem - -Aquatic ecosystem - -Examples: - - lake - stream - - river

14
Marine Ecosystem - -Marine ecosystem - -Examples: - - ocean - estuary - tidepools

15
Community Interrelationships - -Symbiosis: - -Mutualism - -Commensalism - -Parasitism - -Predation

16
Mutualism - -Both organisms benefit Clownfish & anemone Insects and flowers Lichen – algae & fungi Termite protozoa – digests cellulose

17
Commensalism - -One organism benefits, other not harmed Remora fish on turtle Barnacles on mussel Cattle egrets with cows Spanish moss on oak

18
Parasitism - -One organism benefits, other harmed, but not killed Tapeworm in intestine Ticks on dog Fungus on human Malaria in human blood

19
Predation - -One organism benefits (predator), other is killed (prey)
, other is killed (prey)")
20
Food Chains Food chains show how animals get their food. They also show how energy is gained and lost in an ecosystem.

21
Autotrophs Produce own carbon compounds (sugars) Energy from sunlight - photosynthesis Includes algae and plants
 Energy from sunlight - photosynthesis Includes algae and plants")
22
Heterotrophs Carbon compounds from other organisms Fungi (include decomposers) Protozoa and animals
 Protozoa and animals")
23
Herbivores Herbivores are animals that eat only plants Flat grinding molars

24
Carnivores Carnivores are animals that eat other animals - - Meat-eaters

25
Carnivores Pointed canines for grasping and tearing

26
Omnivores Omnivores are animals that eat both plants and animals

27
Omnivores Both sharp canines & grinding molars

28
And our favorite Pizza-vores

29
Food Chains Sunlight Producer Secondary consumer Primary consumer Scavenger Decomposer

30
Sunlight Sunlight is the source of energy in an ecosystem.

31
Producers Producers: - are green plants - capture energy from the sun - convert to sugars by photosynthesis - fix CO 2 into sugars - release oxygen (O 2 ) - are autotrophs
 - are autotrophs")
32
Producers Algae Microscopic plankton

33
Primary Consumers / Herbivores Primary consumers eat producers / plants - herbivores - heterotrophs - among the smallest and largest creatures

34
Primary Consumers / Herbivores

35
Secondary Consumers Secondary consumers eat primary consumers.

36
Secondary Consumers

37
Scavengers Scavengers: - Eat dead and rotting meat Vulture Hyena

38
Decomposers Decomposers: Digest and break down dead bodies into simple molecules. Recycle nutrients. - Includes: fungi insects bacteria worms

39
Decomposers

40
Food Webs - -The interactions among animals for food is never as simple as food chains. For example, bears may eat plants or small animal. Eagles may eat fish or small mammals. - -These interactions are called a “food web”.

41
Food Webs - Terrestrial

42
Food Webs - Marine

43
Trophic Levels - - Levels is a food chain may be defined in terms as energy as “trophic levels”. - -Energy is lost through each trophic level. This energy is used to maintain the organism or even lost as heat.

44
Trophic Levels - -Organisms are the same trophic level get their energy from the same sources. - -There are rarely more than 4 or 5 trophic levels because of the amount of energy lost.

45
Trophic Levels Sunlight 1 st trophic Level 2nd trophic Level 3 rd trophic Level 4th trophic Level Note: grasshopper and rabbit are at the same trophic level

46
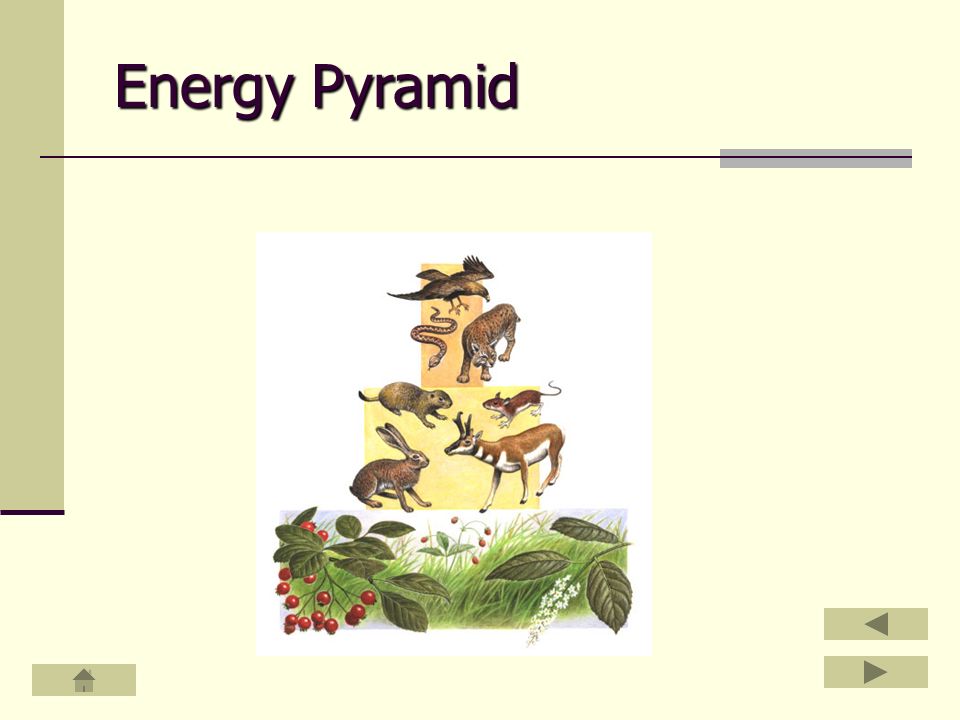
Energy Pyramids Energy pyramids represent the amount of total energy in a trophic level. May be represented as “calories” or “joules” Producers are at the bottom and each trophic level in on top.

47
Energy Pyramids - -The size of each level represents the biomass – the sum of the mass of all the organisms at that level. - -Be aware that sometimes the producer levels are smaller than the consumers because the producer may reproduce much faster. - - There may be only about 10% of energy from one level to the next.

48
Energy Pyramid

Similar presentations


 –plants, bacteria and algae are the first to capture the energy.>")


