Download presentation
Presentation is loading. Please wait.

1
PY 101 Research Studying Behavior

2
4 out of 5 Dentists Recommend Crest Toothpaste

3
Psychology as a Science
Attempts to describe, predict, influence and explain thought and behavior. Uses scientific method

4
What is “normal” Can this happen by “chance”? What else could effect this outcome? Remove emotions and take a methodical approach to reasoning.

6
Advantages of science:
Terminology: Hypothesis - a possible way things could be Theory - an explanation for the way things are, usually supported by a lot of data. Advantages of science: Scientific methods are deductive Science is more systematic, and less subject to human bias

7
Variable Any event, situation, behavior, or individual characteristic that varies - that is, has at least two values

8
Examples Variable Name Levels (values) Gender Male or Female
Test Scores # correct Room Temp. Hot, Warm, Cold Room Temp. Degrees Fahrenheit

9
Operational Definition
A definition of the variable in terms of the operations or techniques the researcher uses to measure or manipulate it

10
In Class Exercise Operationally define Love Happiness Anger Sadness

11
Values of a variable Nominal Quantitative
Different groups with no numeric properties Male-female, distraction-no distraction Quantitative Amounts or quantities Numerical

12
Relationships Between Variables
Is gender related to happiness? Do males and females differ in their happiness? Is distraction while studying related to exam performance? Do people perform better when they are not distracted than when distracted?

13
Relationships Between Quantitative Variables
Positive Negative Curvilinear No Relationship

14
Positive relationships
Increases in the values of one variable are associated with increases in the second variable Increasing study time is associated with higher grades

15
Pizza Consumption High Low Body Weight

16
Pizza Consumption High Low Body Weight

17
Negative relationships
Increases in the values of one variable are associated with decreases in the second variable Increasing hours of work are associated with lower grades

18
Time at Parties High Low GPA

19
Time at Parties High Low GPA

20
Curvilinear Relationships
Increases in the values of one variable are associated with both increases and decreases of the second variable Anxiety can help increase performance until it gets too high – then it decreases performance

21
PERFORMANCE High Low Low Moderate High ANXIETY

22
Are the Following Relationships Positive or Negative?
GPA and Alcohol Consumption # of sexual partners and # of STDs ACT scores and freshman GPA # hrs TV viewed and # hrs studying

23
Research methods Naturalistic Observation Laboratory Observation Case Studies Surveys Experiments

24
Naturalistic Observation
Observe behavior in its natural setting, attempt to avoid influencing or controlling it Advantage: Good way to collect normative data Disadvantage: Must wait for the behavior to occur naturally

25
Laboratory Observation
Observe behavior in a laboratory where extraneous variables can be controlled and specialized equipment can be used Advantage: Better control of outside factors. More precise equipment can be used Disadvantage: Surroundings may affect results

26
Case Studies Observe one or a very few subjects in great depth, usually over a long period of time Advantage: The only method appropriate for very unusual cases Disadvantage: Problems with generalizing the results

27
Two Ways of Studying Relationships
Non-experimental method Experimental method

28
Non-experimental Method
Behavior is observed as it naturally occurs Variables are measured only Examples

29
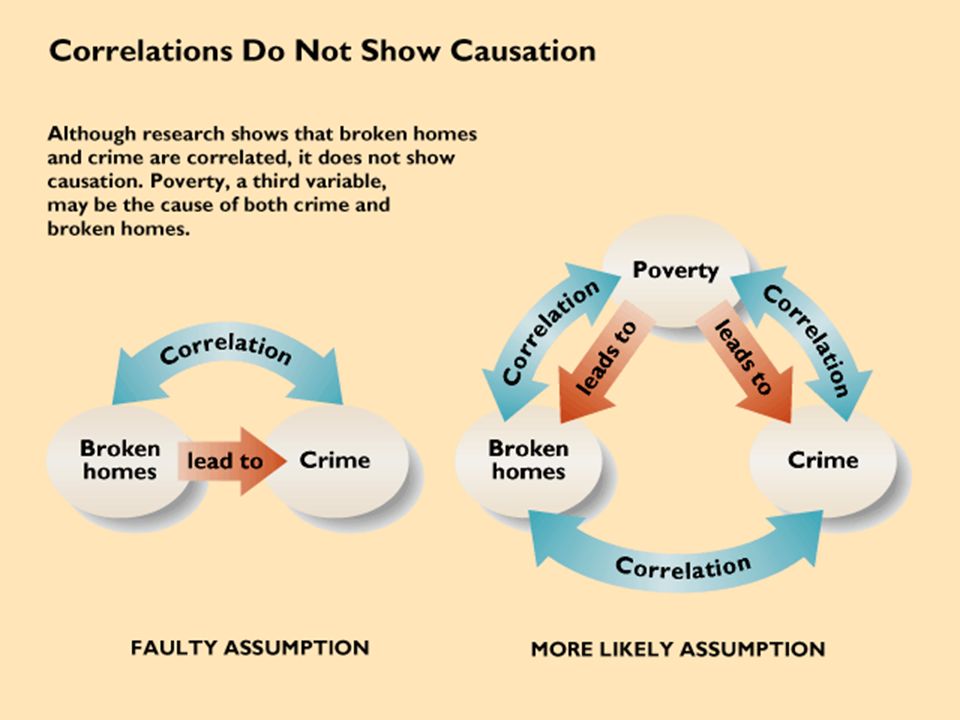
Problems Direction of cause and effect Uncontrolled third variables
Does X cause Y? Or does Y cause X? Uncontrolled third variables Perhaps Z causes both X and Y If so X and Y will appear to be related

30
Experimental Method Addresses the problems of inferring cause and effect Manipulate the first variable and observe the effect on the second variable Control for all other variables

31
Effect of IV on the DV Independent Variable Dependent Variable
Does distraction cause poor performance on an exam? Independent Variable “cause” variable Manipulated first Dependent Variable “effect” variable Measured as a response to the IV

32
Causal sequence The IV comes first
The DV is then measured to examine the effect of the IV Thus, X causes Y Y could not cause X

33
Relationship of Fall Semester Final Exams and Christmas
Have you ever noticed that EVERY fall semester shortly after final exams, the entire country celebrates Christmas?

34
Control Other Variables
Experimental Control Variables are kept constant Randomization Randomly assign participants to conditions Run the conditions of the study in a random order Some other variable could not cause the relationship between X and Y

35
Advantages of the Non-Experimental Method
Real life situations Prediction Study aspects of people such as personality characteristics Can study variables that would be unethical to manipulate in a true experiment

36
Validity Is something “valid”?
Three ways of evaluating research in terms of validity

37
Construct Validity Were the variables studied adequately measured or manipulated? Look at the operational definition of the variables that were studied

38
Internal Validity Can I infer that variable X caused variable Y?
Higher internal validity with the experimental method

39
External Validity Can I generalize beyond this particular study?
Other types of participants, other ways of studying the variables

40
Experiments Involve random assignment and controlled manipulation
Causal claims possible Independent variables manipulated by E Dependent variables supposedly affected by independent variables Experimental groups get the different values of the independent variables. Control groups do not.

41
Experiments Can make causal claims: Disadvantages:
Manipulation removes directionality Random assignment removes third variables Disadvantages: Random assignment sometimes impossible, sometimes unethical Control can reduce validity

43
Cannot imply causation due to: Directionality problems
Correlation Cannot imply causation due to: Directionality problems Third Variables

44
The Correlation Co-efficient
The preceding methods are correlational. They can determine if X and Y go together, but not if X causes Y. The Correlation Co-efficient HIGHER High Corr. Size Low -1 1

45
Developmental Methods
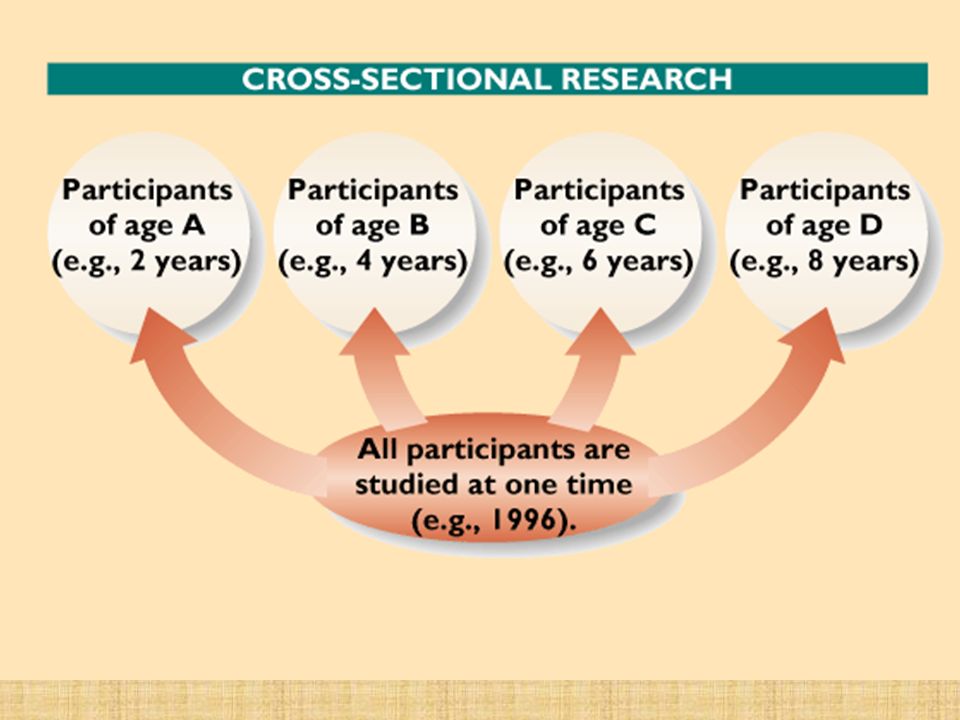
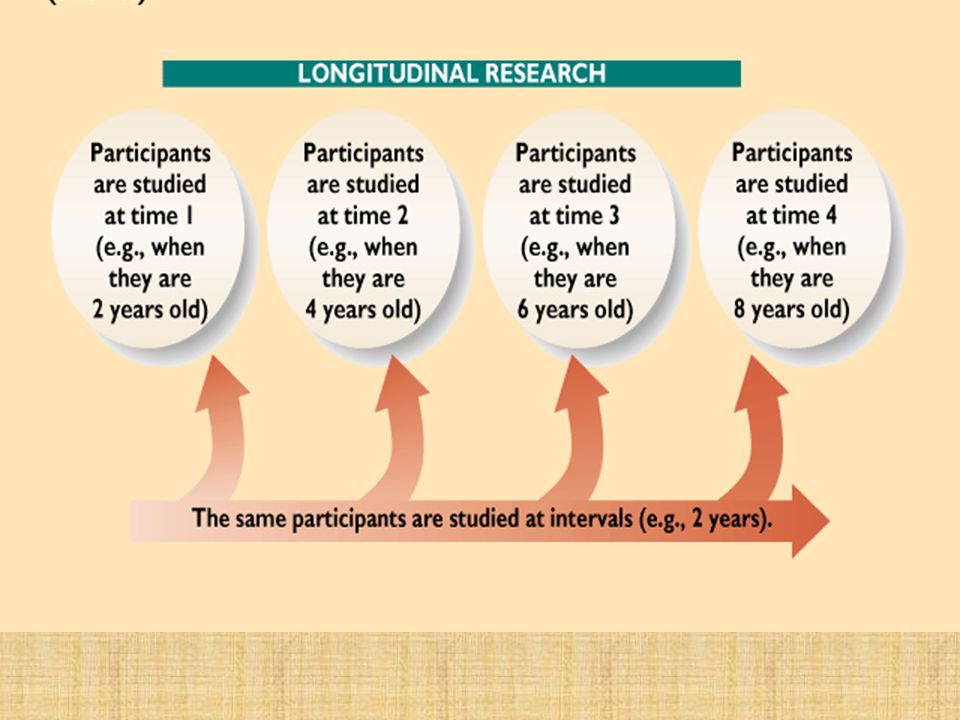
Longitudinal Studies: Follow the same group across time to determine age-related changes in thought and behavior Cross-sectional Studies: Assess groups of differing ages, usually at the same time

46
A longitudinal study from ages 4-7

47
A cross-sectional study from ages 4-7
Pros/Cons: Cross-sectional studies are generally quicker, but compare different people rather than determine changes within an individual

48
Longitudinal We want to know………
How much does a child’s vocabulary increase from age 2 until 8 years of age? TWO basic research methods: Cross sectional Longitudinal

51
Ethical Issues Informed Consent Deception Foreseeable risks
Children as subjects

52
Informed Consent: Deception:
Human subjects must be told of all foreseeable risks. Animals can't give informed consent, must be protected from unnecessary suffering. Deception: Some psychologists oppose all deception. Others tolerate deception as long as it poses no foreseeable risks and debriefing occurs.

53
Risk: In psychology, the standards for acceptable risk must be very stringent, because potential benefits for the participating subject are very low Children: Young children may have difficulty giving informed consent, due to a desire to obey & please adults & a lack of understanding of possible risks

54
Survey Research

55
Surveys Collect data from groups of people using questionnaires or interviews. Data is useless unless sample is representative. Advantage: Can collect information such as attitudes and beliefs Disadvantage: Subjects may lie or mislead

56
Questions to Ask Before Doing Survey Research
Do you have a clear hypothesis? Do your questions focus on that hypothesis? Will participants answers provide accurate answers to your questions?* To whom will your results apply?*

57
Answers May Be Inaccurate Because:
People don’t know the causes of their own behavior People’s memories are inaccurate People are not good at predicting their future behavior People are not telling you what they know because of Social desirability bias Demand characteristics Response sets

58
Generalizing Your Results
Do you know what your population is? How can you get a representative sample of that population? Will nonresponse bias prevent you from generalizing your results to that population?

59
Advantages and Disadvantages of Survey Research:Conclusions
Easy way to get a lot of information However, that information: Will not have internal validity May not have construct validity because of self-report problems May not have external validity because of poor sampling or because of nonresponse bias May not answer research question because survey questions weren’t focused on hypotheses

60
The Advantages and Disadvantages of Different Survey Instruments
Written Instruments * Interviews*

61
Written Instruments Self-administered questionnaires
Cheap, easy to distribute to large sample--but nonresponse bias is big problem Anonymous which may promote honest responses Investigator-administered questionnaires Higher response rates May hurt sense of anonymity and thus decrease honesty of responses Note: A highly refined version of the investigator-administered questionnaire is the psychological test*

62
Psychological tests May be part or all of a questionnaire
Even if you don’t use questions from tests, you can try to use strategies that test-makers use*

63
Things Questionnaire Writers Can Learn from Test Makers
Pretest questions and measure Standardize how measure is administered Be objective Be aware of response sets Seek evidence for measure’s reliability and validity

64
Interviews May be worth added expense if
It increases response rate Need ability to clarify questions, follow up on responses May not be worth added expense if construct validity is harmed by Interviewer bias Participant trying to impress interviewer Telephone interviews may be ideal solution*

65
Advantages of Telephone Interviews
Cheaper than face-to-face interviews Can have high relatively high response rate Interviewer bias controlled by Lack of body cues Monitoring/taping interviewer’s calls

66
Planning a Survey Deciding on a research question
Choosing the format of your questions* Choosing the format of your interview--if you use an interview* Editing your questions* Sequencing your questions* Refining your survey instrument* Choosing a sampling strategy*

67
Choosing the Format of Your Questions
Fixed alternative Yes/No Reliable Not powerful Likert Open-ended May not be properly answered May be difficult to score

68
Choosing the Format of Your Interview
Unstructured Interviewer bias is a serious problem Data may not be hard to analyze Semi-structured Follow-up questions allowed Probably best for pilot studies Structured Standardized, reducing interviewer bias

69
Editing Questions: Nine Mistakes to Avoid
1. Avoid leading questions 2. Avoid questions that invite the social desirability bias 3. Avoid double-barreled questions 4. Avoid long questions 5. Avoid negations 6. Avoid irrelevant questions 7. Avoid poorly worded response options 8. Avoid big words 9. Avoid ambiguous words & phrases

70
Sequencing Questions To boost response rate, put innocuous questions first, personal questions last To avoid wasting time, qualify early To increase accuracy, keep similar questions together To boost response rate, put demographic questions last

71
Putting the Final Touches on Your Survey Instrument
Professional appearance Proof reading Pilot testing Practice coding responses--may lead to refining questionnaire so that it is easier to code responses

72
Choosing a Sampling Strategy
Random sampling Stratified random sampling Convenience sampling Quota sampling Conclusions Only random sampling will be representative Non-response bias may ruin your sample

73
Administering the Survey
Informed consent Clear instructions Debriefing Confidentiality

74
Analyzing Survey Data Summarizing data Inferential statistics

75
Conclusions: Survey Research
Survey research is the most used research method Survey research is the most misused research method You know how to use rather than abuse survey research

Similar presentations


>")


