Download presentation
Presentation is loading. Please wait.

1
2008 Election Prof. B. Jones

2
Outcome As of 1:19 PM, Nov. 5 (from CNN) Obama: 63,568,329 (349 ECV) McCain: 56,198,499 (162 ECV) –Missouri, North Carolina TCTC –Map from NYT
 Obama: 63,568,329 (349 ECV) McCain: 56,198,499 (162 ECV) –Missouri, North Carolina TCTC –Map from NYT.")
3
Presidential Race Vote Shares (from New York Times) –Nationally Obama: 52% McCain: 47% –Selected States (Obama): California: 61% Florida: 51% North Carolina: 50%* Ohio: 51% Georgia: 46% Wyoming: 33% Utah: 34% Arizona: 45%
 –Nationally Obama: 52% McCain: 47% –Selected States (Obama): California: 61% Florida: 51% North Carolina: 50%* Ohio: 51% Georgia: 46% Wyoming: 33% Utah: 34% Arizona: 45%")
4
House and Senate Senate: Dem—56, Rep—40 (+5 Dem) –4 States TCTC: Mn., Ak., Or., Ga. House: Dem—254, Rep—173 (+19 Dem) Implications? What is Lieberman’s future in the Senate? What is the Senate’s magic number? (And why?) Ted Stevens in Alaska?
 Implications. What is Lieberman’s future in the Senate. What is the Senate’s magic number. (And why ) Ted Stevens in Alaska .")
5
California Obama: 61 percent McCain: 37 percent Selected Counties: Obama Vote –Yolo: 67% –Sacramento: 59% –Marin: 78% –San Mateo: 74% –San Francisco: 85% –Los Angeles: 69% –San Diego: 54% –San Bernardino: 50% –Solano: 64%

6
California Selected Counties: McCain Vote –Modoc: 68% –Lassen: 65% –Fresno: 49.2% –Orange: 51% –Del Norte: 52% –Madera: 56% –Mariposa: 55% –El Dorado: 54%

7
California Ballot Issues: 4 and 8 Prop 4: Parental Notification: 47.9% Yes –Yolo: 36% Yes Prop 8: Gay Marriage Ban: 52.4% Yes –Yolo: 41% Yes –San Francisco: 24% Yes –Sacramento: 54% Yes –Modoc: 74% Yes

8
Obama Counties and Prop 8 Counties Imperial: 57% Obama; 70% Yes –Persons of Hispanic Origin: 75.7 Percent Riverside: 50% Obama; 63% Yes –Persons of Hispanic Origin: 42.1 Percent San Bernadino: 52% Obama; 67% Yes –Persons of Hispanic Origin: 46 Percent Inference? –Hard to say until we know turnout. –But an interesting question wrt Latino turnout and Prop 8 Sacramento: 59% Obama; 54% Yes No “red counties” went “No” on Prop 8 Several “blue counties” went “Yes” on Prop 8

9
Presidential Election Of Historic Proportions Some Demographics and the Obama Vote (based on Exit Polls): –Men: 49-48 (Obama first number) –Women: 56-43 Race/Ethnicity –White: 43-55 –Black: 95-4 –Hispanic: 66-31 –Asian: 62-35
: –Men: (Obama first number) –Women: Race/Ethnicity –White: –Black: 95-4 –Hispanic: –Asian: 62-35")
10
Presidential Election: Age Age (what are your predictions?) 18-29: 66% 30-44: 53% 45-59: 49% 60+: 46% Implications?
 18-29: 66% 30-44: 53% 45-59: 49% 60+: 46% Implications")
11
Presidential Election: Final Polls

12
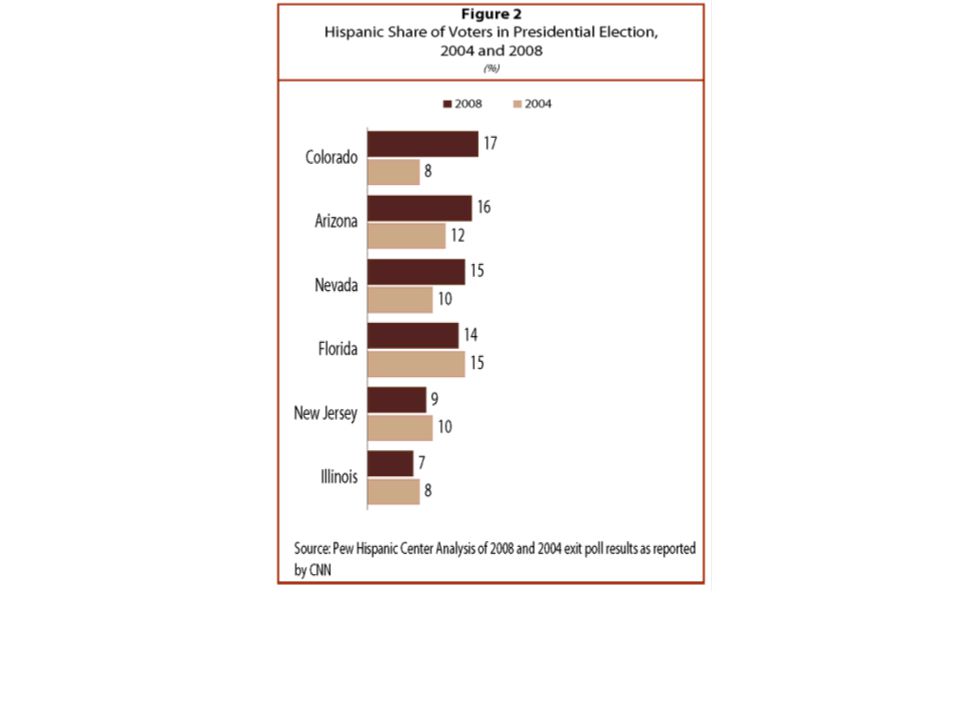
Latinos and the 2008 Election Analysis just released today by Pew Let’s consider some statistics… Estimated Vote Share and Voting Behavior Data from Exit Polls As a proportion of the total electorate:

15
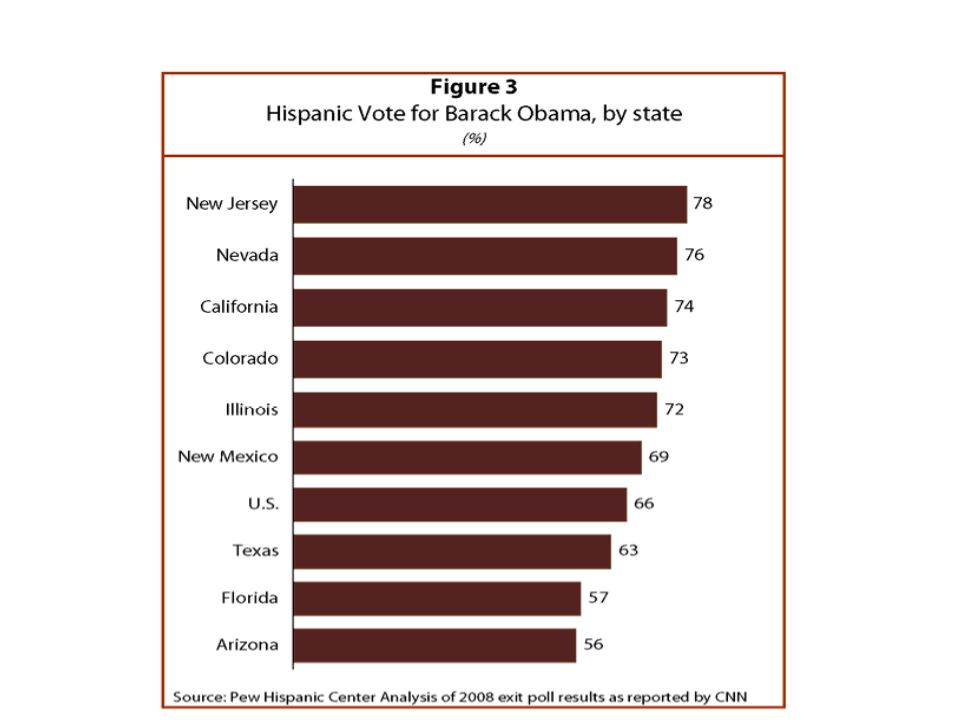
Monolithic Voting? Not quite…but in some states, clearly. Recall African-American vote break-down however. Some selected states: 2004 to 2008 differences

16
Arizona and California

17
Florida and New Mexico

18
Implications? Was there or now is there a Latino vote? Did Latinos effect the outcome? Going forward, any implications? Does Barack Obama “owe” the Latino community? Turning to the election more generally…

19
Post-Election Analysis Why did Obama win? How will he govern? –Democratic control is now solid. –But we do not have a cloture-proof Senate –Democrats will find it hard to hide! Implications of Campaign for Subsequent Governance?

Similar presentations

 Arkansas Michigan CALIFORNIA MINNESOTA COLORADO NEVADA CONNECTICUT New Hampshire.>")


