Download presentation
Presentation is loading. Please wait.

1
Demographic Trends in the West Department of Business, Economic Development & Tourism Honolulu, Hawaii August 2, 2011 Jerry Wong U.S. Census Bureau

2
2

3
3

4
Population Growth in the West

5
Population Growth Western States State20002010Numeric Change% Change West63,197,93271,945,5538,747,62113.8% Alaska626,932710,23183,29913.3% Arizona5,130,6326,392,0171,261,38524.6% California33,871,64837,253,9563,382,30810.0% Colorado4,301,2615,029,196727,93516.9% Hawaii1,211,5371,360,301148,76412.3% Idaho1,293,9531,567,582273,62921.1% Montana902,195989,41587,2209.7% Nevada1,998,2572,700,551702,29435.1% New Mexico1,819,0462,059,179240,13313.2% Oregon3,421,3993,831,074409,67512.0% Utah2,233,1692,763,885530,71623.8% Washington5,894,1216,724,540830,41914.1% Wyoming493,782563,62669,84414.1%

6
6

7
Population Growth for States by Decade

8
8

9
9 94 Representatives from the West

10
County Population The most populous county in the nation is located in the West 11 of the top 25 counties are in the West The West contains 26 of the nation’s top 100 most populous counties.

11
Top Counties Rank County Population 1 Los Angeles County, CA9,818,605 4 Maricopa County, AZ3,817,117 5 San Diego, CA3,095,313 6 Orange, CA3,010,232 11 Riverside, CA2,189,641 12 San Bernardino, CA2,035,210 13 Clark County, NV1,951,269 14 King County, WA1,931,249 17 Santa Clara County, CA1,781,642 22 Alameda County, CA1,510,271 25 Sacramento County, CA1,418,788 37 Contra Costa County, CA1,049,025 38 Salt Lake County, UT1,029,655 11

12
Top Counties Rank County Population 41 Pima County, AZ980,263 43 Honolulu County, HI953,207 46 Fresno County, CA930,450 62 Kern County, CA839,631 63 Ventura County, CA823,318 66 San Francisco County, CA805,235 72 Pierce County, WA795,225 79 Multnomah County, OR735,334 82 San Mateo County, CA718,451 83 Snohomish County, WA713,335 87 San Joaquin County, CA685,306 92 Bernalillo County, NM662,564 99 El Paso County, CO622,263 12

13
Pop Population Growth by County

14
City Population The second most populous city in the nation is located in the West 16 of the nation’s top 50 cities are in the West 4 Western cities gained more than 100,000 people

15
Top Cities Rank City Population 2 Los Angeles, CA3,792,621 6 Phoenix, AZ1,445,632 8 San Diego, CA1,307,402 10 San Jose, CA945,942 13 San Francisco, CA805,235 26 Denver, CO600,158 29 Portland, OR583,776 30 Las Vegas, NV583,756 32 Albuquerque, NM545,852 33 Tucson, AZ520,116 34 Fresno, CA494,665 35 Sacramento, CA466,488 36 Long Beach, CA462,257 38 Mesa, AZ439,041 41 Colorado Springs, CO416,427 47 Oakland, CA390,724 15

17
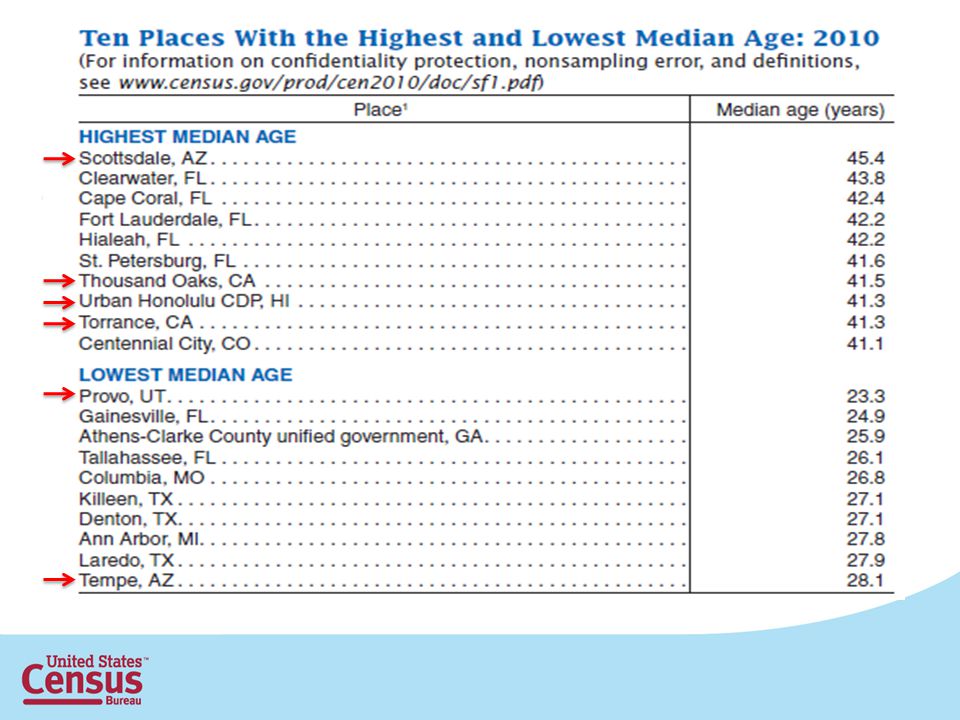
Age 1. Which city in the nation has the highest median age? Hint: The city is in the West 2. Which city in the nation has the lowest median age? Hint: The city is in the West

19
Age Area Population Under 18 Years18 to 64 Years65 Years and OverMedian Age Number% % % U.S.308,745,53874,181,46724.0194,296,08762.940,267,98413.037.2 REGION Northeast55,317,24012,333,19222.335,179,21563.67,804,83314.139.2 Midwest66,927,00116,128,10824.141,776,55962.49,022,33413.537.7 South114,555,74427,788,75724.371,873,00262.814,893,98513.037.0 West71,945,55317,931,41024.945,467,31163.28,546,83211.935.6

20
Median Age by State

21
Median Age for Western States Years

22
Percent Under Age 18 Population Western States

23
Percent Older Population

24
Total Dependency Ratio Total dependency ratio is the number of children (0-17) and older adults (ages 65 and over) per 100 people of working ages (ages 18-64) in the state.
 and older adults (ages 65 and over) per 100 people of working ages (ages 18-64) in the state.")
25
Diversity in the West Total Minority Population The West contains the largest concentration of minorities in the Nation— nearly 34 million. They comprise 47% of the region, the highest percentage of all regions. The West contains nearly 1/3 of the total minority population in the United States.

26
26 West 47.2% Midwest 22.2% Northeast 31.3% South 40.0%

27
Minority Population

28
Minority Population Growth Western States State20002010Numeric Change% Change West26,286,34533,939,1907,652,84529.1% Alaska203,144254,91151,76725.5% Arizona1,856,3742,696,370839,99645.2% California18,054,85822,297,7034,242,84523.5% Colorado1,098,3811,508,403410,02237.3% Hawaii934,4461,050,958116,51212.5% Idaho154,662251,33996,67762.5% Montana94,372120,78726,41528.0% Nevada695,2561,238,470543,21478.1% New Mexico1,005,5511,225,369219,81821.9% Oregon563,783825,226261,44346.4% Utah328,904542,166213,26264.8% Washington1,241,6311,847,736606,10548.8% Wyoming54,98379,75224,76945.0%

29
Minority Population by State StateTotal PopulationMinorityPercent West71,945,55333,939,190 47.2% Alaska 710,231254,911 35.9% Arizona6,392,0172,696,370 42.2% California37,253,95622,297,703 59.9% Colorado5,029,1961,508,403 30.0% Hawaii1,360,3011,050,958 77.3% Idaho1,567,582251,339 16.0% Montana989,415120,787 12.2% Nevada2,700,5511,238,470 45.9% New Mexico2,059,1791,225,369 59.5% Oregon3,831,074825,226 21.5% Utah2,763,885542,166 19.6% Washington6,724,5401,847,736 27.5% Wyoming563,62679,752 14.1%

30
Diversity in the West 20002010Numeric Change% Change West63,197,93271,945,5538,747,62113.8% Hispanic15,340,50320,596,4395,255,93634.3% The West has the largest number of Hispanics or Latinos – both in terms of numbers (20,596,439) and in percentage of total population (28.6%) than any region. 41% of all Hispanics in the United States (50,477,594) live in the West. Growth in the Hispanic population (5,255,936) accounted for 60% of the region’s total growth (8,747,621) The Hispanic or Latino Population
 live in the West. Growth in the Hispanic population (5,255,936) accounted for 60% of the region’s total growth (8,747,621) The Hispanic or Latino Population.")
31
Hispanic or Latino Population

32
Hispanic Population Growth Western States State20002010Numeric Change% Change West15,340,50320,596,4395,255,93634.3% Alaska25,852 39,24913,39751.8% Arizona1,295,617 1,895,149599,53246.3% California10,966,55614,013,7193,047,16327.8% Colorado735,6011,038,687303,08641.2% Hawaii87,699120,84233,14337.8% Idaho101,690175,90174,21173.0% Montana18,08128,56510,48458.0% Nevada393,970716,501322,53181.9% New Mexico765,386953,403188,01724.6% Oregon275,314450,062174,74863.5% Utah201,559358,340156,78177.8% Washington441,509755,790314,28171.2% Wyoming31,66950,23118,56258.6%

33
Hispanic Population by State StateTotal PopulationHispanicPercent West71,945,55320,596,439 28.6% Alaska 710,231 39,249 5.5% Arizona6,392,017 1,895,149 29.6% California37,253,95614,013,719 37.6% Colorado5,029,1961,038,687 20.7% Hawaii1,360,301120,842 8.9% Idaho1,567,582175,901 11.2% Montana989,41528,565 2.9% Nevada2,700,551716,501 26.5% New Mexico2,059,179953,403 46.3% Oregon3,831,074450,062 11.7% Utah2,763,885358,340 13.0% Washington6,724,540755,790 11.2% Wyoming563,62650,231 8.9%

34
Diversity in the West 20002010Numeric Change% Change West63,197,93271,945,5538,747,62113.8% Asian5,003,6116,670,9501,667,33933.3% The West has the highest concentration of Asian population – 6,670,950 9.3% of the West’s population is Asian. 46% of the nation’s Asian population of 14,465,124 are residents of the West. Growth in the Asian population (1,667,339) accounted for 19% of the region’s total growth (8,747,621) The Asian Population
 accounted for 19% of the region’s total growth (8,747,621) The Asian Population.")
35
Asian Population Growth Western States State20002010Numeric Change% Change West5,003,611 6,670,950 6,670,9501,667,33933.3% Alaska25,116 38,135 13,01951.8% Arizona92,236 176,695 84,45991.6% California3,697,513 4,861,007 1,163,49431.5% Colorado95,213 139,028 43,81546.0% Hawaii503,868 525,078 21,2104.2% Idaho11,889 19,069 7,18060.4% Montana4,691 6,253 1,56233.3% Nevada90,266 195,436 105,170116.5% New Mexico19,255 28,208 8,95346.5% Oregon101,350 141,263 39,91339.4% Utah37,108 55,285 18,17749.0% Washington322,335 481,067 158,73249.2% Wyoming2,771 4,426 1,65559.7%

36
Asian Population by State StateTotal PopulationAsianPercent West71,945,553 6,670,950 6,670,950 9.3% 9.3% Alaska 710,231 38,135 5.4% Arizona6,392,017 176,695 2.8% California37,253,956 4,861,007 13.0% Colorado5,029,196 139,028 2.8% Hawaii1,360,301 525,078 38.6% Idaho1,567,582 19,069 1.2% Montana989,415 6,253 0.6% Nevada2,700,551 195,436 7.2% New Mexico2,059,179 28,208 1.4% Oregon3,831,074 141,263 3.7% Utah2,763,885 55,285 2.0% Washington6,724,540 481,067 7.2% Wyoming563,626 4,426 0.8%

37
The Foreign-Born Population The West contains the largest concentration of the foreign born in the Nation – 13,867,376. They comprise 19% of the region. 36% of all persons in the United States who are foreign born (38,517,234) reside in the West.
 reside in the West..")
38
Foreign-Born Population by State StateTotal PopulationForeign-BornPercent West71,945,55313,867,376 19.3% Alaska 710,23148,849 6.9% Arizona6,392,017925,376 14.5% California37,253,9569,949,758 26.7% Colorado5,029,196486,615 9.7% Hawaii1,360,301224,227 16.5% Idaho1,567,58297,642 6.2% Montana989,41519,309 2.0% Nevada2,700,551506,505 18.8% New Mexico2,059,179196,006 9.5% Oregon3,831,074367,202 9.6% Utah2,763,885218,142 7.9% Washington6,724,540810,637 12.1% Wyoming563,62617,108 3.0% 2009 American Community Survey

39
Home Ownership 2009 American Community Survey

40
Median Value Owner-Occupied Housing Units 2000 2006 Estimate 2007 Estimate 2008 Estimate 2009 Estimate U.S.$111,800$197,000$201,000$196,700$185,200 Alaska 137,400 226,800239,300235,200232,900 Arizona 109,400 251,600245,900228,300187,700 California 198,900 569,900550,600465,100384,200 Colorado 160,100 247,800242,000241,200237,800 Hawaii 249,300 563,500574,600556,600517,600 Idaho 102,100 174,400184,300183,100171,700 Montana 95,800 165,400175,900179,800176,300 New Mexico 132,500 150,200160,800164,400160,900 Nevada 94,600 335,300322,000270,200207,600 Oregon 145,800 251,700266,200271,700257,400 Utah 142,600 200,600226,200235,100224,700 Washington 158,800 284,700311,200306,800287,200 Wyoming 91,500 158,400178,300186,700184,000 2009 American Community Survey

41
Median Value Owner-Occupied Housing Units

43
Median Household Income: 2009 ACS Dollars

44
44 U.S. Census Bureau Partnership & Data Services Program 15350 Sherman Way, Suite 400 Van Nuys, CA 91406 (888) 806-6389 Toll Free (888) 806-6389 Toll Free L.A. Regional Website: www.census.gov/losangeles L.A. Regional Website: www.census.gov/losangeles laro.isp-partnership@census.gov laro.isp-partnership@census.gov Jerry.B.Wong@census.gov Jerry.B.Wong@census.gov Resources: Need Assistance?
 Toll Free (888) Toll Free L.A. Regional Website: L.A. Regional Website: Resources: Need Assistance .")
Similar presentations


 and Peter Choe (KAC-CIC) First National Convention.>")


>")


