Download presentation
Presentation is loading. Please wait.

1
POL 168: Chican@/Latin@ Politics Professor Brad Jones Dept. of Political Science UC-Davis

2
Today Latino Public Opinion Participation

3
Is the a “Latino” Public Opinion? What would this require to measure it? Should we care about it? Where might you think Latinos differ from non-Latino communities? –What issues? –Which kinds of candidates? Issues when thinking about Latino public opinion arise: –Is the group monolithic…probably not!

4
How do we understand Latino public opinion? Surveys History Lesson –Chicano Survey (1979) –Latino National Political Survey (1989) –Pew Hispanic Trust surveys (mostly of recent vintage and periodic) –Latino National Survey (2006) Problem with national surveys?
 –Latino National Political Survey (1989) –Pew Hispanic Trust surveys (mostly of recent vintage and periodic) –Latino National Survey (2006) Problem with national surveys .")
5
So What? This is a really important question and the question sort of goes like this: –Why should we care if public opinion differs in the Latino community compared to other racial or ethnic communities? Answers are probably easy to come by… –Demographic shifts make understanding attitudes within the “community” very salient. –Intergroup differences are important

6
Some Recent Events” Why care about attitudes? Proposition 8 in California –http://latimesblogs.latimes.com/lanow/2008/08/will- latinos-de.html (required reading)http://latimesblogs.latimes.com/lanow/2008/08/will- latinos-de.html –Ad for “Yes on Pro 8” http://www.youtube.com/watch?v=rCCdtf9zKbk http://www.youtube.com/watch?v=rCCdtf9zKbk Please note: NO POLITICAL AGENDA HERE on my part! (Jones’ disclaimer) The point is, attitudes within the community matter in important ways.
 latinos-de.html –Ad for Yes on Pro 8 v=rCCdtf9zKbk v=rCCdtf9zKbk Please note: NO POLITICAL AGENDA HERE on my part. (Jones’ disclaimer) The point is, attitudes within the community matter in important ways..")
7
2008 Presidential Election and Associated Issues Most survey data is embargoed but I can look at aggregates. Pew National Survey of Latinos (2008) Let’s look at some data.
 Let’s look at some data..")
8
Presidential Election

9
Race and Presidential Politics

10
Favorability Ratings

11
Party Affiliation Over Time

12
Turnout: Racial Context

13
Party Breakdown: Monolithic?

14
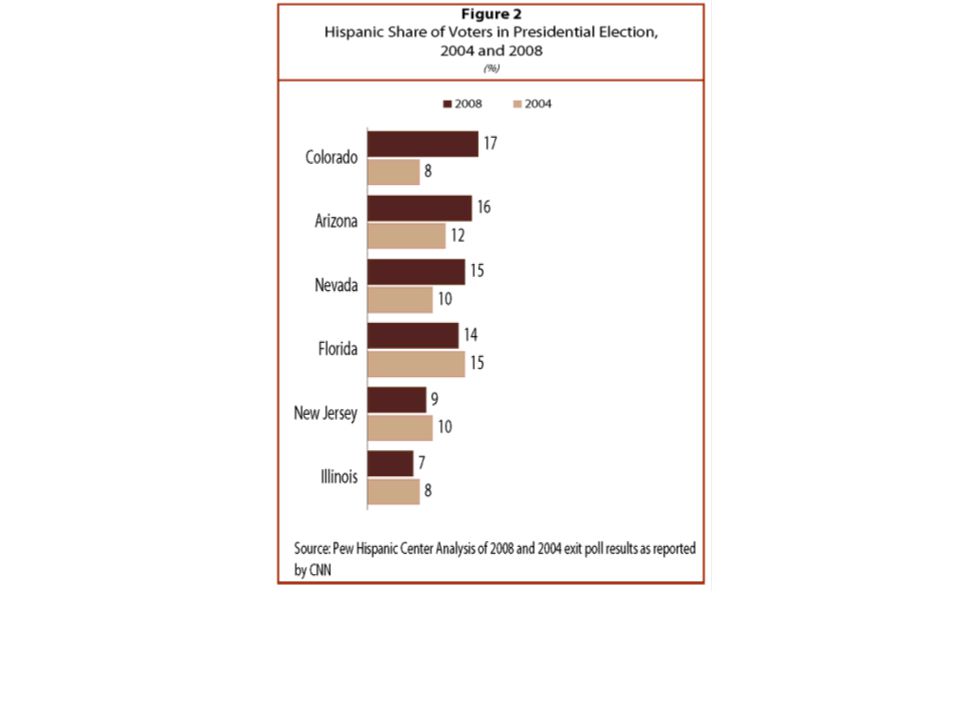
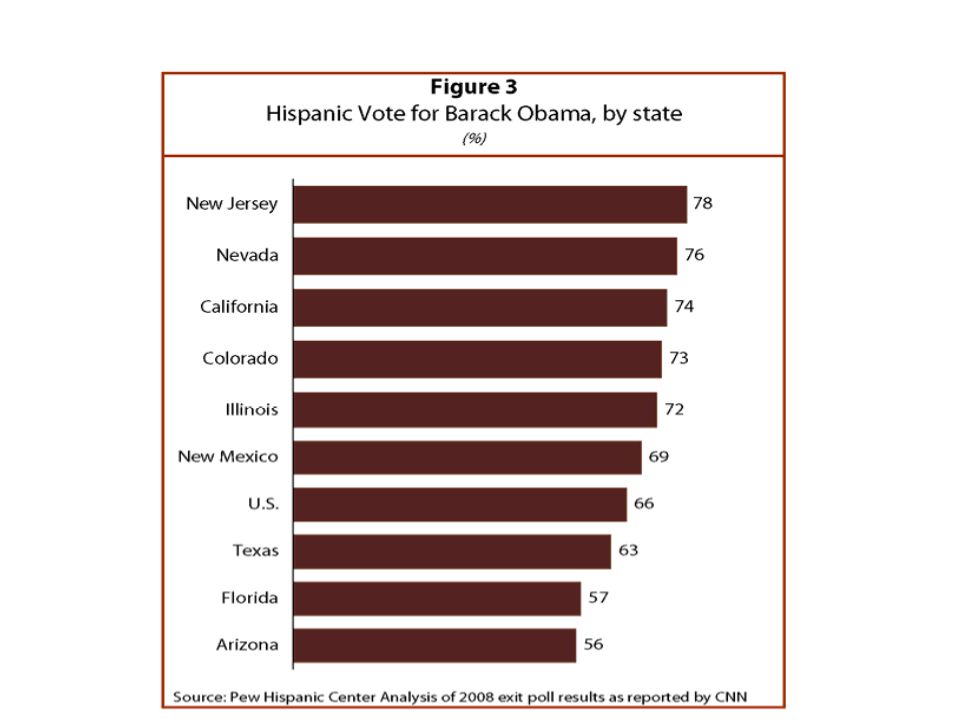
Latinos and the 2008 Election Analysis by Pew Let’s consider some statistics… Estimated Vote Share and Voting Behavior Data from Exit Polls As a proportion of the total electorate:

17
Monolithic Voting? Not quite…but in some states, clearly. Recall African-American vote break-down however. Some selected states: 2004 to 2008 differences

18
Arizona and California

19
Florida and New Mexico

20
Implications? Was there or now is there a Latino vote? Did Latinos effect the outcome? Going forward, any implications? Does Barack Obama “owe” the Latino community? Turning to the election more generally…

21
Take-away Points? Trends seem to favor Democratic party. Implications for Republican Party? –Ignore the group at your own peril. –The group is large and getting larger. Sanchez article –Group Consciousness and its Role in Shaping Latino attitudes Let’s delve into Latino public opinion some more. 2004 Pew Study

22
Trust-in-Government

23
Trust-in-Government by Sub-Group

24
Trust…take-away points Major features? What are the important sub-group differences? Overall, how would you characterize levels of trust-in-government? Does this surprise you? What about belief politicians are interested in Latino issues?

25
Political Leaders Interested in Latino Issues?

26
More Indicators of Efficacy

27
Implications What does this suggest about political efficacy? Does it matter if one is US born or foreign born? –Differences are not as pronounced by most respondents agree with the statement. What about perceived influence of citizens? “In the US, citizens can have an influence at all levels of government…by voting and engaging in other political activities.” (Agree/Disagree) 78 percent of respondents agree with this. Interesting juxtaposition with item on the previous slide. Makes no difference if respondent is foreign born or US born.
 78 percent of respondents agree with this. Interesting juxtaposition with item on the previous slide. Makes no difference if respondent is foreign born or US born..")
28
Forms of Participation Contribute Money? 9.4 percent have (over 90 percent have not!) 14.2 percent of US born have (still low number) ● Volunteer for Candidate? 5.5 percent have; 8.7 percent of US born have. ● Civic Participation (attend a meeting/demonstration?) 19.3 percent have; 26.9 percent of US born have. ● What about voting?
 14.2 percent of US born have (still low number) ● Volunteer for Candidate. 5.5 percent have; 8.7 percent of US born have. ● Civic Participation (attend a meeting/demonstration ) 19.3 percent have; 26.9 percent of US born have. ● What about voting .")
29
Turnout Rates Based on Census Data 2004: Estimated 47 percent of eligible Latinos voted –Estimated 67 percent of white non-Latino –Estimated 60 percent of African-American –Estimated 44 percent of Asian –Again, numbers high because they are based on Census data. –Take away point? –Source: http://www.census.gov/prod/2006pubs/p20- 556.pdfhttp://www.census.gov/prod/2006pubs/p20- 556.pdf

30
Turnout 2000 Presidential –Latino Estimate: 45.1 percent –White, non-Latino: 61.8 –African-American: 56.8 –Asian/PI: 43.3 2002 Midterms –Latino Estimate: 30.4 percent –White, non-Latino: 49.1 percent –African-American: 42.3 percent –Asian/PI: 31.2 percent 1998/1994 Midterms –Latino Estimate: 32.8 percent/34.0 percent Source for data: US Census Bureau Take-away points?

31
What about political parties? Which party has the most concern for Latinos? What might you expect? Let’s consider some data.

32
Party best for Latino Issues

33
Best Party? In 2004, is there one? What about now? In 2006, survey results suggested a similar story. What’s going on in 2008?

34
Some “Overtime” Analysis Let’s consider some of the data from last week in temporal perspective. Party having most concern is a useful item to consider. –It foreshadows the future, possibly…

35
Party having most concern for Latino Issues, 2002, 2004, 2006

36
Implications? Findings? This slide has some interesting stuff in it. –Note the change over time; in some sense there is not much. –However, note the drop in 2006 in the no difference category. –Where do these respondents go to? Dem. Increases, Rep. Decreases BUT, DK increases primarily: this suggests some ambiguity on the issue. One way to think about this is this: there is a lot of uncertainty on this issue among Latinos about who will serve their interests best. Dems make gains, slightly. But still, there exists a lot of uncertainty (Evinced by DK category) Side-trip to partisanship
 Side-trip to partisanship.")
37
Party affiliation among Latinos with and without leaners

38
Main Points There actually is a noticeable difference when accounting for leaners (not unpredictable) –Latino leaners go more in favor of Democrats when pushed. To think of Latinos as monolithic partisans, however, is clearly wrong. (Cubanos relevant here) Independent streak is fairly strong Now control for partisanship on “best party” question.
 Independent streak is fairly strong Now control for partisanship on best party question..")
39
Party Having Most Concern: Republican Identifiers

40
What? The previous slide looks at the “most concern” question for Republicans. At least from 2004 to 2006, it is clear Republican identifiers are moving more readily to the Democratic or “DK” camps. –Implication: Republicans are moving away from the party (at the margins) Next, Democrats
 Next, Democrats.")
41
Party Having Most Concern: Democratic Identifiers

42
What? Democratic identifiers clearly see the Dems as the best party. However, the shift from the “no difference” category is clearly toward the Dem. Party. I think what we’re seeing among Democrats is a decrease in uncertainty about who is best able to deal with Latino issues. What about Independent identifiers, of which there are a ton for Latinos?

43
Party Having Most Concern: Independents

44
What? Look at the drop in “no difference” category? And then look at the gain in Democratic category once we factor out Leaners.

Similar presentations


>")
 Obama: 63,568,329 (349 ECV) McCain: 56,198,499 (162 ECV) –Missouri, North Carolina.>")


