Download presentation
Presentation is loading. Please wait.

1
Visualization Tools Scottish Neighbourhood Statistics Scottish Neighbourhood Statistics& Scottish Index of Multiple Deprivation GRAEME KERR OFFICE OF THE CHIEF STATISTICIAN SCOTTISH GOVERNMENT

2
WHAT IS SNS? Scottish Neighbourhood Statistics is the Scottish Government's (SG) on-going programme to improve the availability, consistency and accessibility of small area statistics in Scotland. Scottish Neighbourhood Statistics is the Scottish Government's (SG) on-going programme to improve the availability, consistency and accessibility of small area statistics in Scotland. Used to inform the SG’s approach to improving the quality of life for people living in Scotland and especially in the most disadvantaged areas. Used to inform the SG’s approach to improving the quality of life for people living in Scotland and especially in the most disadvantaged areas. Now considered as the SG’s statistical flagship for local area statistics Now considered as the SG’s statistical flagship for local area statistics
 on-going programme to improve the availability, consistency and accessibility of small area statistics in Scotland. Scottish Neighbourhood Statistics is the Scottish Government s (SG) on-going programme to improve the availability, consistency and accessibility of small area statistics in Scotland. Used to inform the SG’s approach to improving the quality of life for people living in Scotland and especially in the most disadvantaged areas. Used to inform the SG’s approach to improving the quality of life for people living in Scotland and especially in the most disadvantaged areas. Now considered as the SG’s statistical flagship for local area statistics Now considered as the SG’s statistical flagship for local area statistics.")
3
Around 2,800 indicators Over 800,000 views since February 2007 launch ESRI ArcSDE and ArcIMS spatial data management and delivery software Current developments: Report on Non-Standard Geographies Interoperability SNS Background

4
Data zones: rural and urban

19
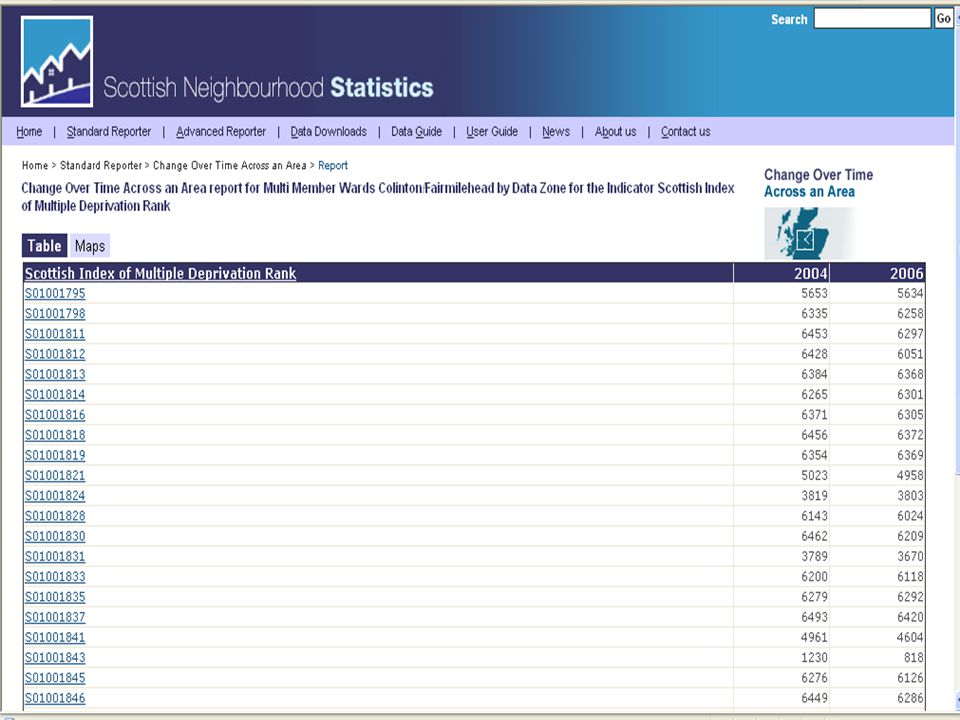
What is SIMD? First published in June 2004 First published in June 2004 Divides the whole of Scotland into 6,505 areas and ranking each area in terms of multiple deprivation Divides the whole of Scotland into 6,505 areas and ranking each area in terms of multiple deprivation Combines individual indicators on income, employment, health, education, access, housing and crime into ‘domains’ and overall index rank Combines individual indicators on income, employment, health, education, access, housing and crime into ‘domains’ and overall index rank

20
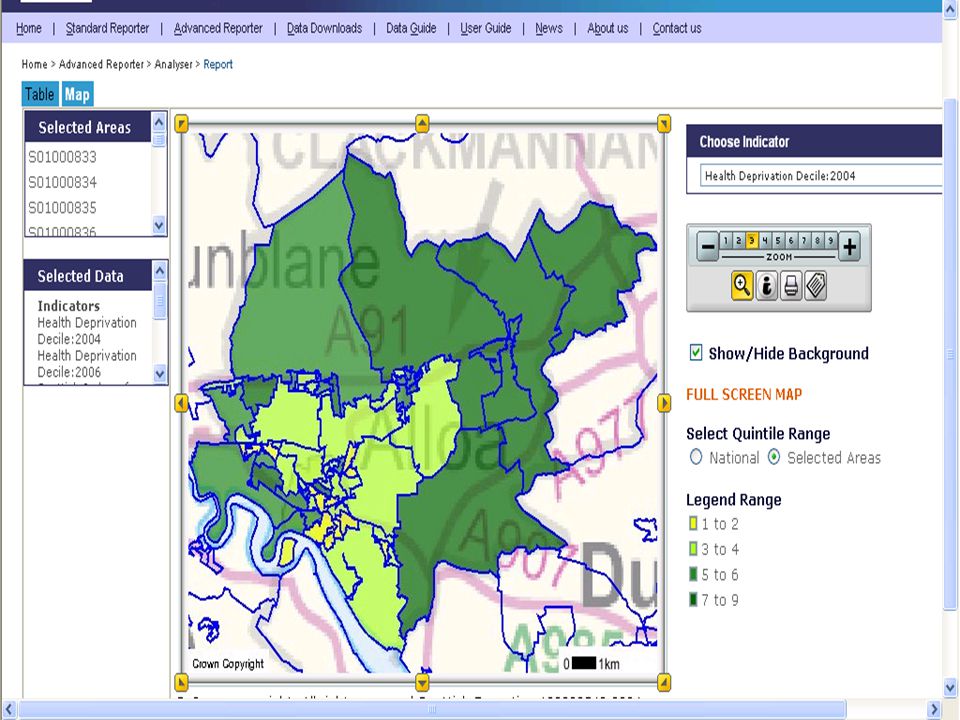
Interactive Mapping Uses Adobe SVG Viewer Uses Adobe SVG Viewer Not supported from January 2009 (!) Not supported from January 2009 (!) Allows user to browse by geography, theme and over by comparison over time Allows user to browse by geography, theme and over by comparison over time
 Not supported from January 2009 (!) Allows user to browse by geography, theme and over by comparison over time Allows user to browse by geography, theme and over by comparison over time")
24
Scottish Government Statistics www.scotland.gov.uk/statistics Scottish Neighbourhod Statistics www.sns.gov.uk Scottish Index of Multiple Deprivation www.scotland.gov.uk/simd neighbourhood.statistics@scotland.gsi.gov.uk Graeme.kerr@scotland.gsi.gov.uk

Similar presentations


 Officer 14 October 2014.>")

 2009 Dumfries & Galloway Andrew White Office of the Chief Statistician 05 th February.>")


 2004 TRACEY STEAD OFFICE OF THE CHIEF STATISTICIAN SCOTTISH EXECUTIVE.>")


 2009 Inverclyde Council Niamh Laffan Office of the Chief Statistician Scottish Government.>")


 2009 East Ayrshire Andrew White Office of the Chief Statistician 16 th February.>")


