Download presentation
Presentation is loading. Please wait.

1
Edinburgh Community Councils, 1 st March 2013 Euan Smith Office of the Chief Statistician and Performance Scottish Neighbourhood Statistics

2
Running Order o Introduction (10:30) o Small Area Geography (10:40) o Scottish Neighbourhood Statistics (10:50) o Break (11:20) o Scottish Index of Multiple Deprivation (11:30) o Wrap-up and Questions (12:15)
 o Small Area Geography (10:40) o Scottish Neighbourhood Statistics (10:50) o Break (11:20) o Scottish Index of Multiple Deprivation (11:30) o Wrap-up and Questions (12:15)")
3
Geography Hierarchy Postcodes Output Areas Data Zones Intermediate Geography Local Authority ● Council Areas – Majority of Statistics available on LA level. ● ~4,000 residents – mainly used for data too disclosive/unreliable at data zone level. ● ~800 residents – core small area statistics geography. ● ~50 households – mainly used for the Small Area Census results. ● ~15 address points – highly disclosive.

4
Data Zones Statistical geography 6,505 data zones in Scotland Average population of 800 people Fixed boundaries over time Used as a geographical building block

5
What is SNS? ● Public website (www.sns.gov.uk)www.sns.gov.uk ● Used as single point for accessing small area statistics for Scotland ● Indicators across various topics and geographies ● Many at data zone level ● Range of pre-defined and custom reports

6
SNS Website If the internet works: www.sns.gov.uk Activities Otherwise, more slides…

21
Standard Reporter ● Quick and easy to use ● Generate pre-determined reports ● Make simple comparisons

22
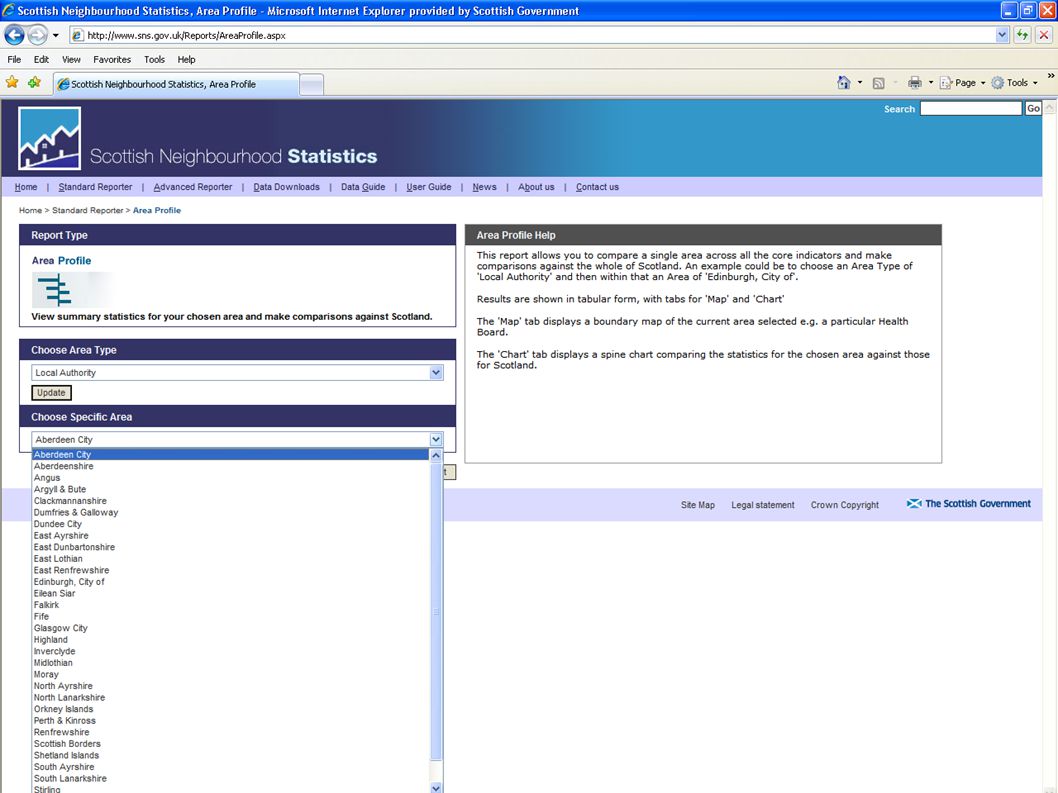
● Allows you to create areas of interest ● Wider choice of indicators Advanced Reporter

24
Choose Your Area: Method 1

25
Choose Your Area: Method 2

29
This side for making choicesThis side for information

30
Tick boxes appear

35
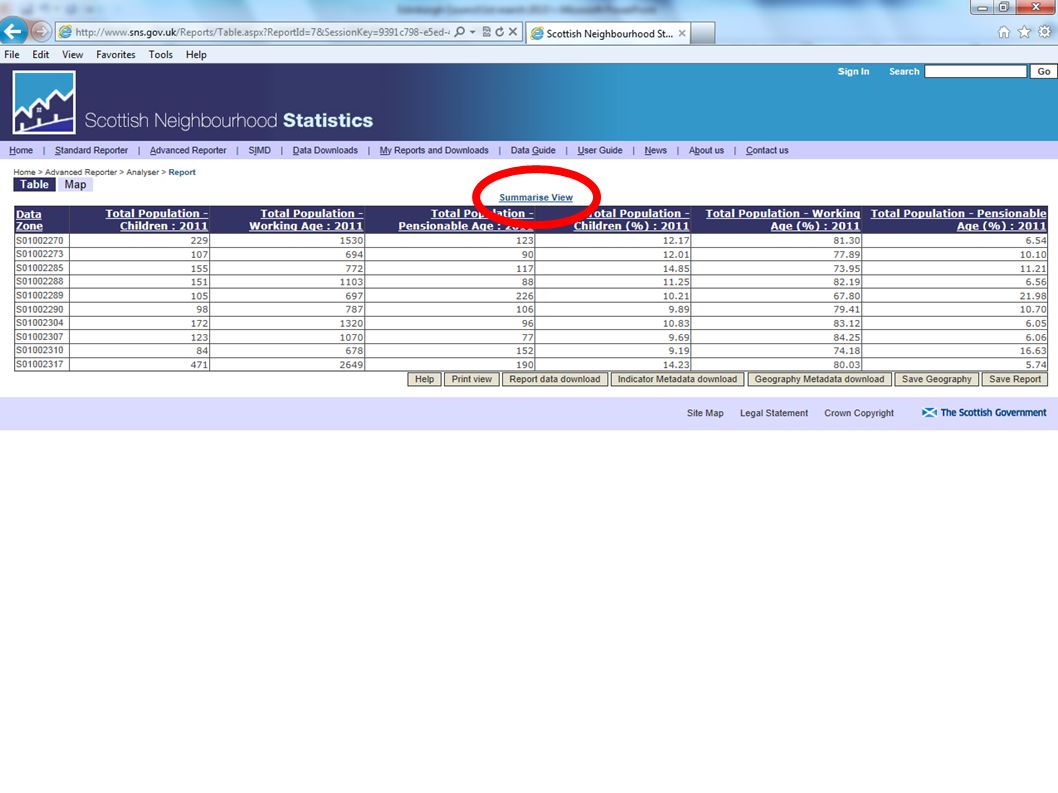
Using Quick Profile 1) Search for a postcode; 2) What proportion of residents are of pensionable age? 3) How does that compare with Edinburgh as a whole? 4) Look at the map for this data zone; 5) Is there anything in that area which might explain/influence the statistics for the area?
 How does that compare with Edinburgh as a whole. 4) Look at the map for this data zone; 5) Is there anything in that area which might explain/influence the statistics for the area .")
36
Advanced Reporter ● Use the map to pick two data zones you are familiar with; ● Generate a report that contains: – % children; – Claimant Count (Male); – Claimant Count (Female); – % dwellings in Council Tax band E
; – Claimant Count (Female); – % dwellings in Council Tax band E")
37
● CONTACTS Always happy to help Euan Smith 0131 244 4092 euan.smith@scotland.gsi.gov.uk 0131 244 4092 www.sns.gov.uk ScotStat: http://www.scotland.gov.uk/Topics/Statistics/scotstat http://www.scotland.gov.uk/Topics/Statistics/scotstat

Similar presentations


 2009 Dumfries & Galloway Andrew White Office of the Chief Statistician 05 th February.>")


 2004 TRACEY STEAD OFFICE OF THE CHIEF STATISTICIAN SCOTTISH EXECUTIVE.>")


 2009 Inverclyde Council Niamh Laffan Office of the Chief Statistician Scottish Government.>")

 2009 East Ayrshire Andrew White Office of the Chief Statistician 16 th February.>")


