Download presentation
Presentation is loading. Please wait.

1
www.scotland.gov.uk/simd Scottish Index of Multiple Deprivation (SIMD) 2009 Inverclyde Council Niamh Laffan Office of the Chief Statistician Scottish Government 13 th November 2009
 2009 Inverclyde Council Niamh Laffan Office of the Chief Statistician Scottish Government 13 th November 2009")
2
www.scotland.gov.uk/simd SIMD 2009 Things you need to know to use SIMD Main findings Outputs Questions

3
www.scotland.gov.uk/simd What is the SIMD? The Scottish Index of Multiple Deprivation identifies small area concentrations of multiple deprivation across all of Scotland The SIMD ranks the 6,505 datazones in Scotland from 1 being most deprived to 6,505 being the least deprived in Scotland. Relative measure so always a most deprived 15% (976 datazones)
.")
4
www.scotland.gov.uk/simd What are datazones? Statistical geography Fixed boundaries over time 6,505 datazones in Scotland Average population of 750 people

5
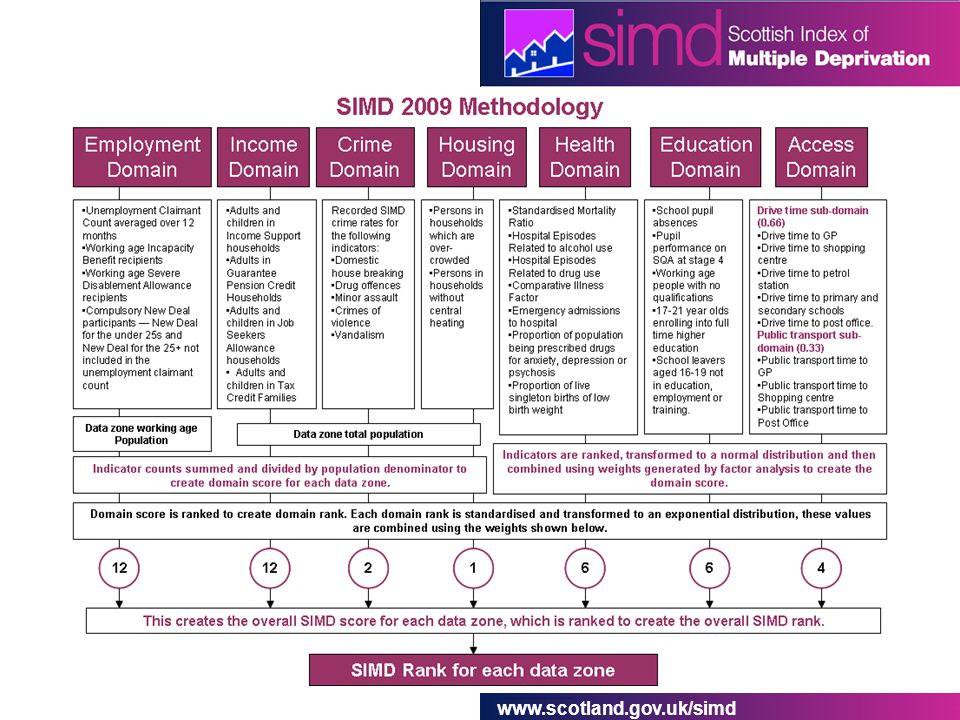
www.scotland.gov.uk/simd Calculating the SIMD 2009 Minimise change since SIMD 2006 to ensure comparability 38 indicators across 7 aspects of deprivation (domains) Same domains in SIMD 2009 No change to domain weights Some changes to indicators Mostly 2007 / 2008 data 2007 populations
 Same domains in SIMD 2009 No change to domain weights Some changes to indicators Mostly 2007 / 2008 data 2007 populations")
6
www.scotland.gov.uk/simd What is included in the SIMD 2009? Income domain – including tax credits Employment domain – no change Education domain – NEET indicator Health domain – very minor changes Access domain – methodology changes Crime domain – move to FY data Housing domain – still Census data

7
www.scotland.gov.uk/simd
8
Points to watch There will always be 976 datazones in the 15% most deprived – if a datazone moves out another will move in. The Index is relative ie shows an area is more or less deprived than another one but not how much more deprived. Changes to methodology so care is needed when comparing over time eg crime domain, tax credit data. The least deprived area is not the most affluent, it just lacks deprivation eg in the income domain there is a lack of benefit claimants

9
www.scotland.gov.uk/simd More points to watch Data from 2007 and 2008 means the recent economic downturn not picked up but it is unlikely to have a large effect on the relative differences across Scotland. No datazones in the 15% most deprived does not mean no deprivation, just no concentrations of multiple deprivation Not all people who are deprived live in deprived areas and Not all people living in a deprived area are deprived. 36% of income deprived people live in the 15% most deprived areas 64% live out with 15% most deprived.

10
www.scotland.gov.uk/simd SIMD 2009 Summary Results

11
www.scotland.gov.uk/simd Headline findings Improvements in Glasgow Concentrations of multiple deprivation becoming more spread out geographically Concentrations of deprivation in most deprived datazones reduced slightly

12
www.scotland.gov.uk/simd Datazones in the 15% most deprived overall

13
www.scotland.gov.uk/simd Headline findings Improvements in Glasgow Concentrations of multiple deprivation becoming more spread out geographically Concentrations of deprivation in most deprived datazones reduced slightly 4 in 5 datazones that moved out between SIMD 2004 and SIMD 2006 stayed out in SIMD 2009 4 in 5 datazones in 15% most deprived in SIMD 2009 have been in on both SIMD 2004 and SIMD 2006

14
www.scotland.gov.uk/simd Datazones moving out of 15% MD

15
www.scotland.gov.uk/simd Datazones moving into 15% MD

16
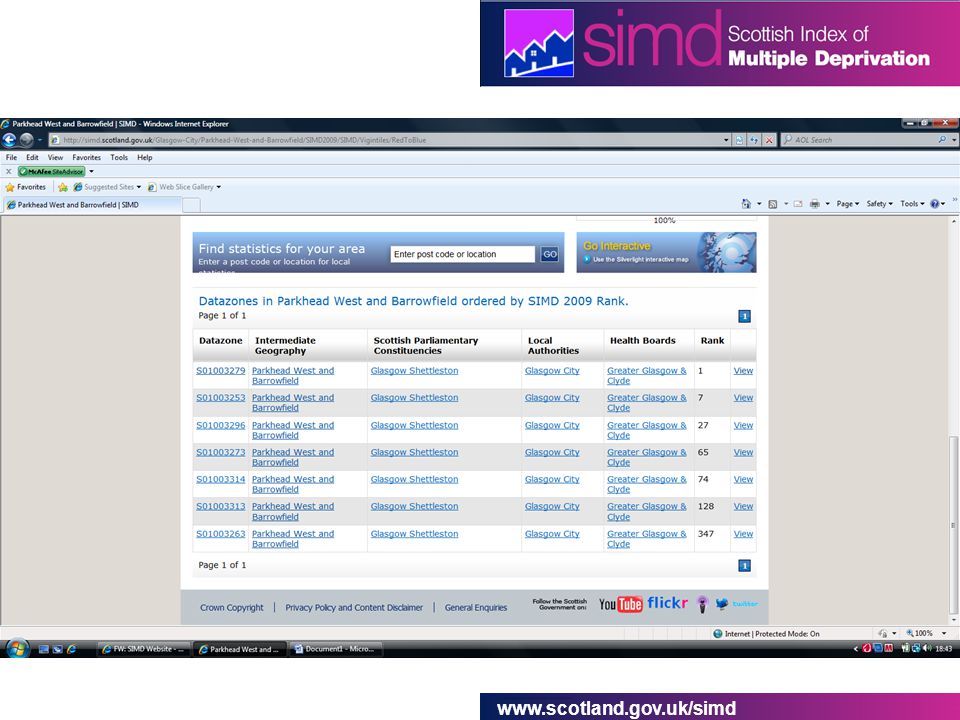
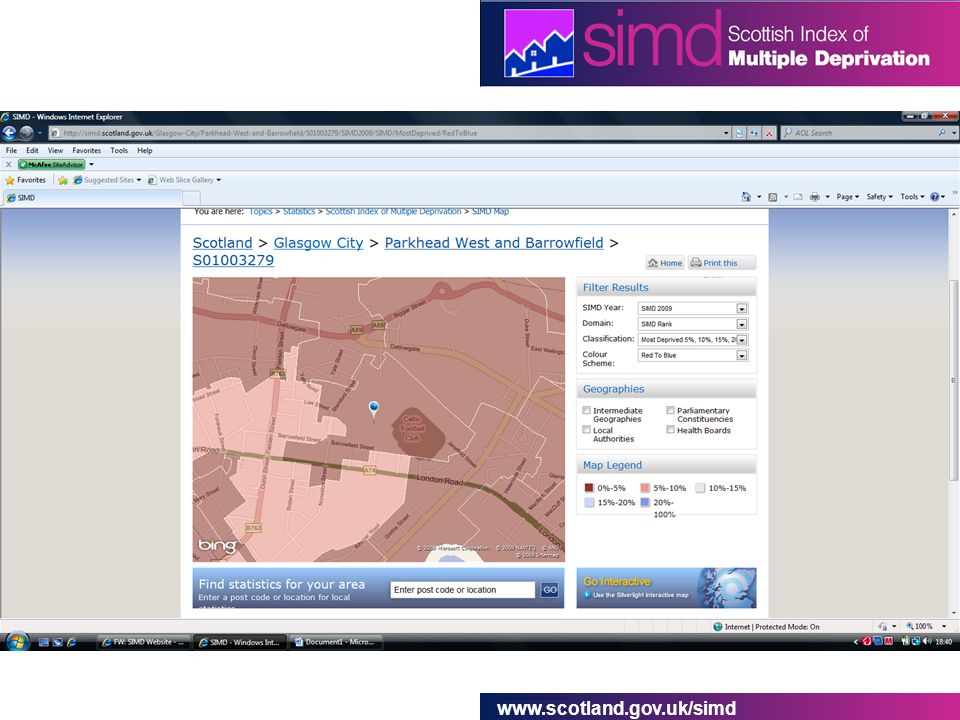
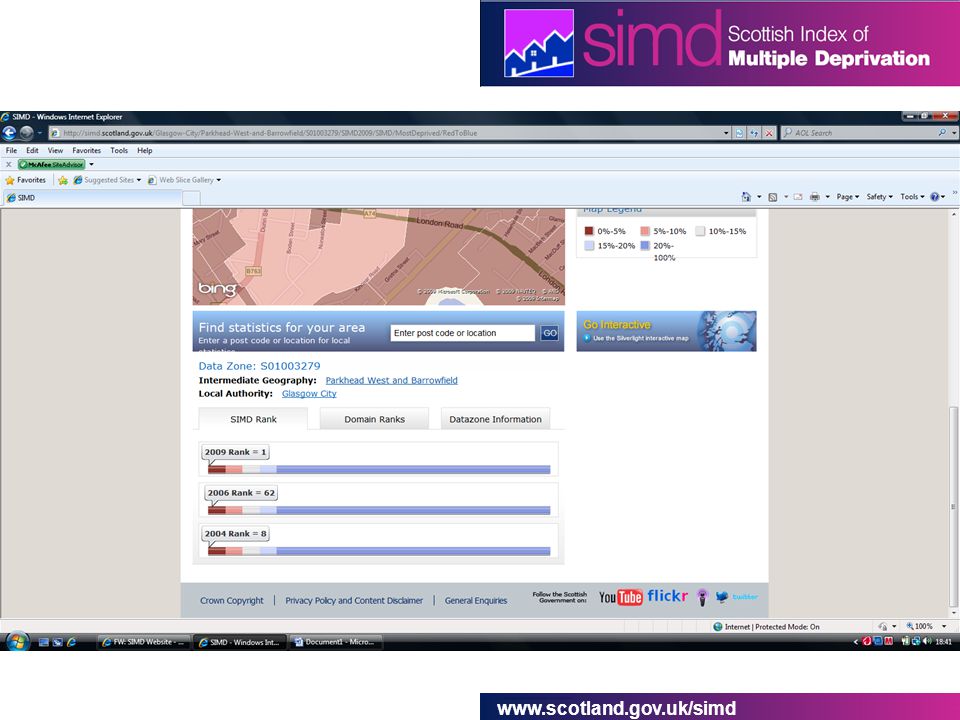
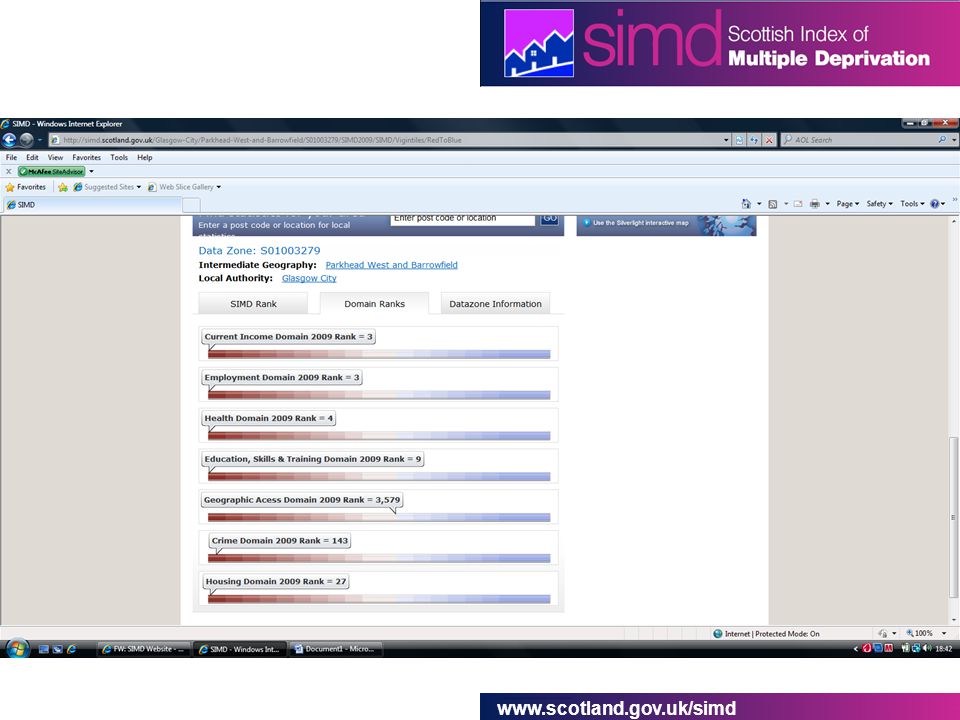
www.scotland.gov.uk/simd Most deprived datazone nationally S01003279 East end of Glasgow. Ranked 62 in SIMD 2006 DZ ranked 1 in SIMD 2006 now ranked 2

17
www.scotland.gov.uk/simd Most deprived datazone in Inverclyde S01004032 Ranked 49 in SIMD 2006 and 64 in 2009 Employment Deprivation 42% to 35% Income Deprivation 47% to 59%

18
www.scotland.gov.uk/simd Key Facts 45% of datazones in Inverclyde are in the 20% most deprived in SIMD 2009. Increasing numbers of datazones in the 5%, 10%, 15% most deprived, making it relatively worse off between 2004 and 2009. Inverclyde has the second highest percentage of employment deprived people, but has seen a decrease between SIMD 2006 and SIMD 2009.

19
www.scotland.gov.uk/simd On the income domain, Inverclyde has 39 of the 15% most deprived datazones in Scotland, compared to 40 in 2006 and 31 in 2004. Two datazones moved out and one moved in. All three border datazones that have been in the 15% most deprived in SIMD 2006 and SIMD 2009.

20
www.scotland.gov.uk/simd Inverclyde has the second highest percentage of employment deprived people, but has seen a decrease between SIMD 2006 and SIMD 2009. Those datazones that moved out were mainly in the 10-15% band in SIMD 2006. Those moving in were in the 15-20% band of the employment domain. Those moving in and out are mostly bordering datazones that remained in the 15% most deprived.

21
www.scotland.gov.uk/simd SIMD 2009 National & Local Share

22
www.scotland.gov.uk/simd SIMD 2009 – National Share *The national share is the number/percentage of datazones in the 15% most deprived in Scotland that fall in each Local Authority

23
www.scotland.gov.uk/simd SIMD 2009 – Local Share *The local share is the percentage of datazones within a Local Authority that fall within the 15% most deprived in Scotland

24
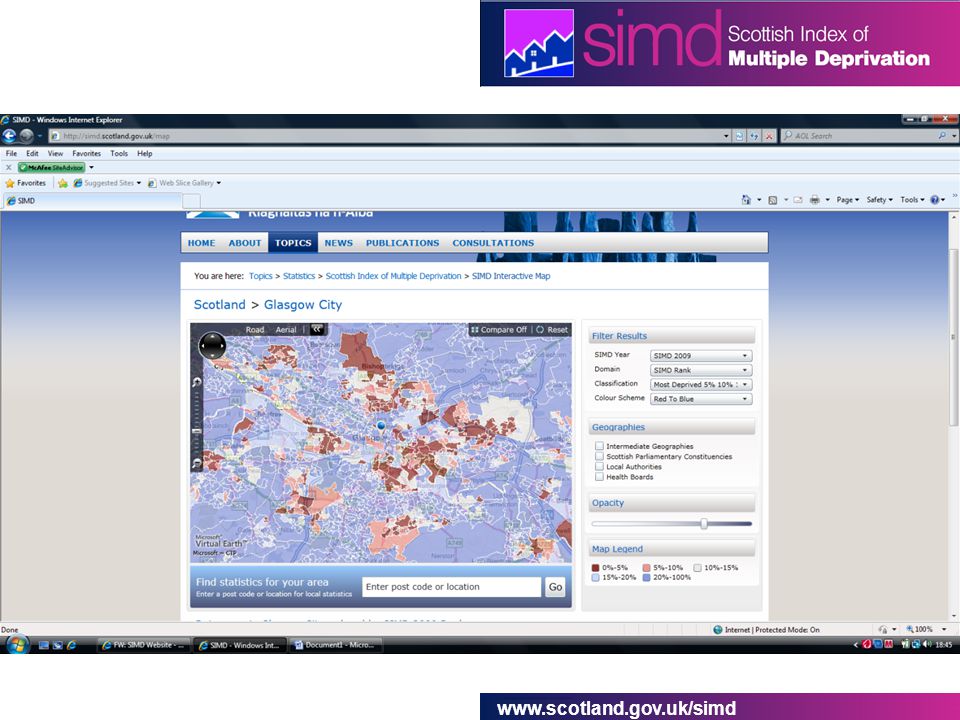
www.scotland.gov.uk/simd Where to find more.. General report with initial analysis Technical report Guidance leaflet Interactive mapping website Statistical Compendium –tables, charts & maps Background data for SIMD 2006 www.scotland.gov.uk/simd

25
Interactive mapping

26
www.scotland.gov.uk/simd
31
ANY QUESTIONS? Contacts: Niamh Laffan 0131 2443331 niamh.laffan@scotland.gsi.gov.uk Neighbourhood Statistics (SNS & SIMD) 0131 2440442 neighbourhoodstatistics@scotland.gov.uk
")
Similar presentations


 Officer 14 October 2014.>")
 2009 Dumfries & Galloway Andrew White Office of the Chief Statistician 05 th February.>")


 2004 TRACEY STEAD OFFICE OF THE CHIEF STATISTICIAN SCOTTISH EXECUTIVE.>")


 2009 East Ayrshire Andrew White Office of the Chief Statistician 16 th February.>")


 ScotPHO training course – day 4 Andrew White Office of the Chief Statistician, Scottish.>")


