Download presentation
Presentation is loading. Please wait.

1
Scottish Neighbourhood Statistics and the Scottish Index of Multiple Deprivation (SIMD) 2004 TRACEY STEAD OFFICE OF THE CHIEF STATISTICIAN SCOTTISH EXECUTIVE
 2004 TRACEY STEAD OFFICE OF THE CHIEF STATISTICIAN SCOTTISH EXECUTIVE")
2
Summary Background Data delivered through SNS Examples from the website Using SNS in policy – SIMD 2004

3
Before SNS Different geographies 1991, 1996, 1999 Wards; Postcode Sectors… Different dissemination Just not there Geographic referencing Confidentiality: issues and perceptions overlapping geographies

4
What is SNS? Programme to improve small area statistics 2001 Onwards Data supports a number of the SE’s commitments Those with small area emphasis – Closing the Opportunity Gap – Area deprivation: SIMD Access to Central Government information will improve policy development at a local level

5
Data delivered through SNS New stable small area statistical geography: data zone 6505 data zones = approx 750 people Also new intermediate geography 1235 intermediate zones = approx 4,000 people Being used across the Public Sector Input from statisticians across the SE and UK Making the most of administrative data

7
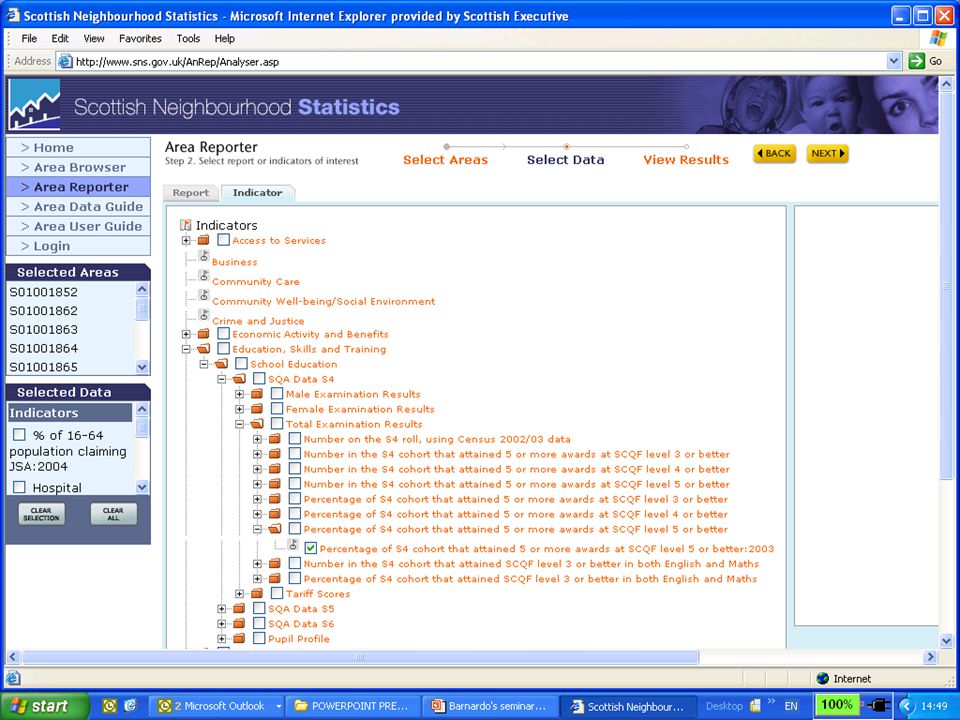
Data delivered through SNS Deprivation Population Housing Education Health Community care Labour market Benefits Access Physical Environment

8
How are SNS disseminated? Freely disseminated over the Internet www.sns.gov.uk SNS Statistics and Geography available on CD neighbourhood.statistics@scotland.gov.uk

11
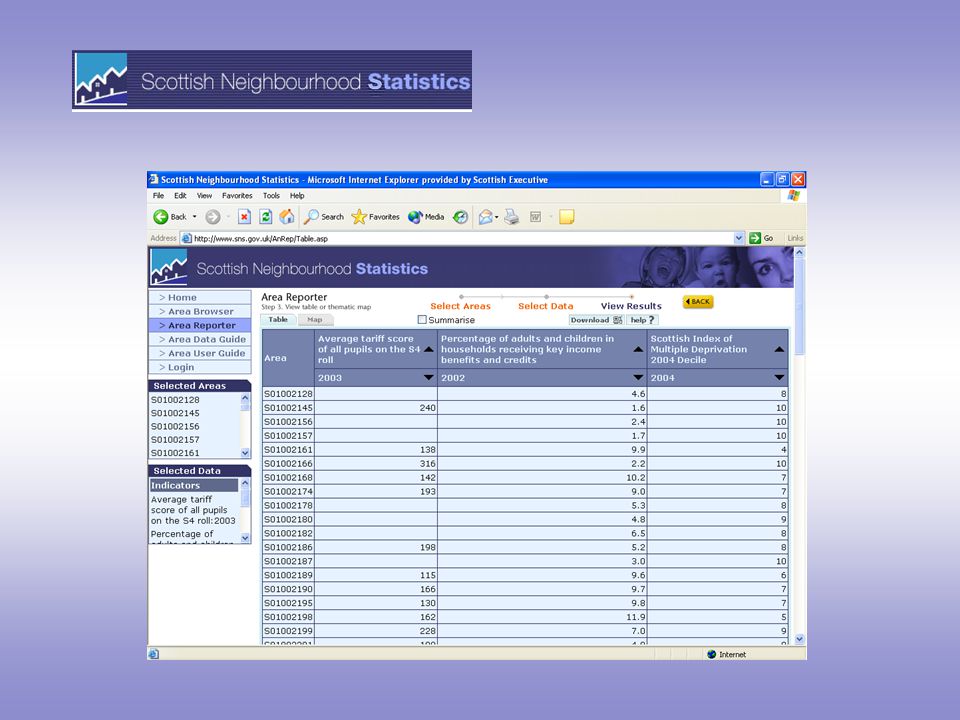
Average tariff score

12
Percentage of the population on key income benefits and credits

13
Using SNS in Policy Planning and profiling Compare delivery between areas Analysing and Monitoring Examine the impact of policies Targeting and allocating resources Identify concentrations of deprivation at small area level: SIMD

14
Example of using SNS:SIMD 2004 Well respected methodology developed by Oxford University 6 domains, 31 indicators Current Income, Employment, Health, Education, Access, Housing Ranking of data zones by overall multiple measure Identifies pockets of deprivation

15
Uses of SIMD 2004 SE’s official measure of area based multiple deprivation Support funding allocations

16
Local Authority share of most deprived 15% of data zones across Scotland

17
Edinburgh City

18
Glasgow City

19
Scottish Index of Multiple Deprivation 2004 : Decile

20
For further information: neighbourhood.statistics@scotland.gov.uk www.sns.gov.uk

Similar presentations


 Officer 14 October 2014.>")

 2009 Dumfries & Galloway Andrew White Office of the Chief Statistician 05 th February.>")


 2009 Inverclyde Council Niamh Laffan Office of the Chief Statistician Scottish Government.>")

 2009 East Ayrshire Andrew White Office of the Chief Statistician 16 th February.>")


>")


