Download presentation
Presentation is loading. Please wait.

1
Voters’ Education and Electoral Participation: Barabanki (U.P.) SC 53 Focus : Women Empowerment Representing the District Team Ministhy S. D E O Barabanki, Uttar Pradesh, 2014, Lok Sabha Elections

2
The Elections and the Women: A historical perspective Women and Elections: International Women Suffrage In Pre 1950 India The right of women to vote and stand as Candidate : 1947 In Post 1950 India, The article 14 of the Constitution of India empowered all by proclaiming equality for all

3
The First Few General Elections in India The data is not available with respect to male-female Voters for first general elections. Not even for next 3 more of 1957, 1962, 1967 ! Only from 1971 elections male female vote % is available

4
Barabanki Status of Women Suffering from some of the worst development indicators of female empowerment Maternal mortality rate Infant mortality rate Toilet facilities for women

5
Basic Analysis of Women Participation in Elections 2009 Parliamentary Election : 52.3% Total voter turnout 44.7 % Women voter turnout The worst voter turnout Ass. Constituency in P E 2009 : Haidergarh - 46.37% Total voter turnout, - 39.96 % Women voter turnout The best voter turnout Ass. Constituency in P E 2009 : Kursi - 56.39% Total voter turnout, - 49.32 % Women voter turnout 2012 Assembly Elections : Gender Ratio 843 Women voters enrolled for every 1000 Male voters (Extremely low against desirable statics of 908)
.")
6
The 2009 Parliamentary elections Poll % of Lok Sabha’ General Election – 2009, 53 Barabanki (S.C.) S.noAC No. & NameElectors as per 2009 roll The number of voters who participated in voting The percentage of male in voting The percentage of female in voting Total Turnout % MaleFemaleTotalMaleFemaleTotal 12 34 56789 1011 1 266&dqlhZ 159312 135460 29477299417 66810 16622762.4049.3256.39 2 267&jkeuxj 142408 115542 25795082797 49946 13274358.1443.2351.46 3 268&ckjkca dh 155803 131330 28713389157 56224 14538157.2242.8150.63 4 269&tSniqj¼ v0tk0½ 158922 139663 298585100890 66930 16782063.4847.9256.21 5 272&gSnjx< + ¼v0tk0½ 151556 131764 28332078709 52655 13136451.9339.9646.37 ;ksx& 768001 653759 1421760450970 292565 74353558.7244.7552.3

7
2012 Ass. Election Voter Gender Ratio of District A C NameGender Ratio (No. of Female Voter /1000 Male Voters) Ram Nager807 Rudauli (Partial)817 Barabanki841 Dariabad841 Kursi844 Jaitpur857 Haidergard868 District Average843 (Desirable 908)
 Ram Nager807 Rudauli (Partial)817 Barabanki841 Dariabad841 Kursi844 Jaitpur857 Haidergard868 District Average843 (Desirable 908).")
8
District Team’s Strategy for 2014 Par. Elections Pull up Gender Ratio – Enroll maximum women voters Analyze within each AC the 10 PBs with worst women enrollment Go with full force to enroll women as voters after understanding reasons Pull up female voter turnout : Encourage women to vote Analyze within each AC the 10 PBs with worst women voter turnout Go with full force to encourage women to vote after understanding reasons

10
ykssdlHkk lkekU; fuokZpu&2009 ds le; 10 erns; LFkyksa ij ernku dk izfr'kr fo/kkulHkk fuokZpu {ks=&272&gSnjx<+¼v0tk0½ deakderns ; LFk y dh la[;k erns; LFky dk uke ernkrkvksa dh la[;k Mkys x;s erernku esa iq:"k dk izfr'kr ernku esa efgyk dk izfr'kr dqy izfr'kr iq:"kefgyk;ksxiq:"kefgyk;ksx 1 234567891011 1 73 m0iz0ik0ea>kj dejk ua0&2 16514030529134217.589.2913.77 2 298 izk0ik0bLykeiqj if'0Hkkx 70947711861245417817.4911.3215.01 3 301 uofufeZr izk0ik0 flf/k;koka if'peh Hkkx 55357611291456320826.2210.9418.42 4 302 tw0gk0u;kHkou jksgukehjkiqj mRrjh Hkkx 63853411721786224027.9011.6120.48 5 296 izk0ik0 tehugqlsukckn n0Hkkx 749653140220112933026.8419.7523.54 6 306 iapk0?kj uhekeÅ m0Hkkx 3693447131245217633.6015.1224.68 7 299 izk0ik0 nsoiqjk e0blykeiqj 61855111691989128932.0416.5224.72 8 257 tw0gk0Fkyokjk 19218037256389429.1721.1125.27 Analysis of Haidergarh in 2009 (46.37%) Lowest in Voter turnout
 Lowest in Voter turnout")
11
General Strategies at District Level 1.Identification of mazras and hamlets falling in lower EP and Gender Ratio booths 2.Identifying the reasons of low registration 3.Involving elders and youngsters to motivate the unregistered electors to be part of the proud voter group 4.Involving motivated students and organizations like NCC and NSS volunteers 5.Involving political functionaries and BLAs of political parties to speak to the potential voters 6.Launching media campaigns to educate and motivate

12
7.Using ICE material provided by ECI and CEO U P Office from time to time 8.Involving all government functionaries at village level particularly the female workers like Asha Bahu, Anganvadi workers and female teachers and locally habited shiksha-mitras 9.Involving local artistes like folk singers of Awadhi and Bhojpuri 10. Touring of women NYK volunteers in the worst GR and worst female voter turnout polling booths General Strategies at District Level

13
Results achieved (2014) Figures in 2009 52.346.3756.2150.6351.4656.39
 Figures in")
14
Results achieved (2014) Figures in 2009 44.7539.9647.9242.8143.2349.32
 Figures in")
15
ykssdlHkk lkekU; fuokZpu&2014 ds le; 10 erns; LFkyksa ij ernku dk izfr'kr fo/kkulHkk fuokZpu {ks=&272&gSnjx<+¼v0tk0½ deakderns ; LFk y dh la[;k erns; LFky dk uke ernkrkvksa dh la[;k Mkys x;s erernku esa iq:"k dk izfr'kr ernku esa efgyk dk izfr'kr dqy izfr'kr iq:"kefgyk;ksxiq:"kefgyk;ksx 1 234567891011 1 323 izk0ik0bLykeiqj if'0Hkkx 712629134134434669048.3155.0151.45 2 325 uofufeZr izk0ik0 flf/k;koka if'peh Hkkx 751713146426018144134.6225.3930.12 3 326 tw0gk0u;kHkou jksgukehjkiqj mRrjh Hkkx 720654137434127861947.3642.5145.05 4 319 izk0ik0 tehugqlsukckn n0Hkkx 39932772620114434550.3844.0447.52 5 330 iapk0?kj uhekeÅ m0Hkkx 39438077423718942660.1549.7455.04 6 322 izk0ik0 nsoiqjk e0blykeiqj 724646137034230764947.2447.5247.37 7 277 tw0gk0Fkyokjk 2402144541309722754.1745.3350.00 8 279 tw0gk0Fkyokjk 46039185123816440251.7441.9447.24 Analysis of Haidergarh in 2014 (58.26%) Voter turnout
 Voter turnout")
16
Contd.

17
Result Achieved 2014 Par. Election Voter Gender Ratio of District A C NameGender Ratio (No. of Female Voter /1000 Male Voters) 2012 Gender Ratio (No. of Female Voter /1000 Male Voters) 2014 Ram Nager807825 Rudauli (Partial)817823 Barabanki841852 Dariabad841854 Kursi844861 Jaitpur857868 Haidergard868872 District Average843 (Desirable 908)855 District team awarded on Voters Day 2014 for the result
 2012 Gender Ratio (No. of Female Voter /1000 Male Voters) 2014 Ram Nager Rudauli (Partial) Barabanki Dariabad Kursi Jaitpur Haidergard District Average843 (Desirable 908)855 District team awarded on Voters Day 2014 for the result.")
18
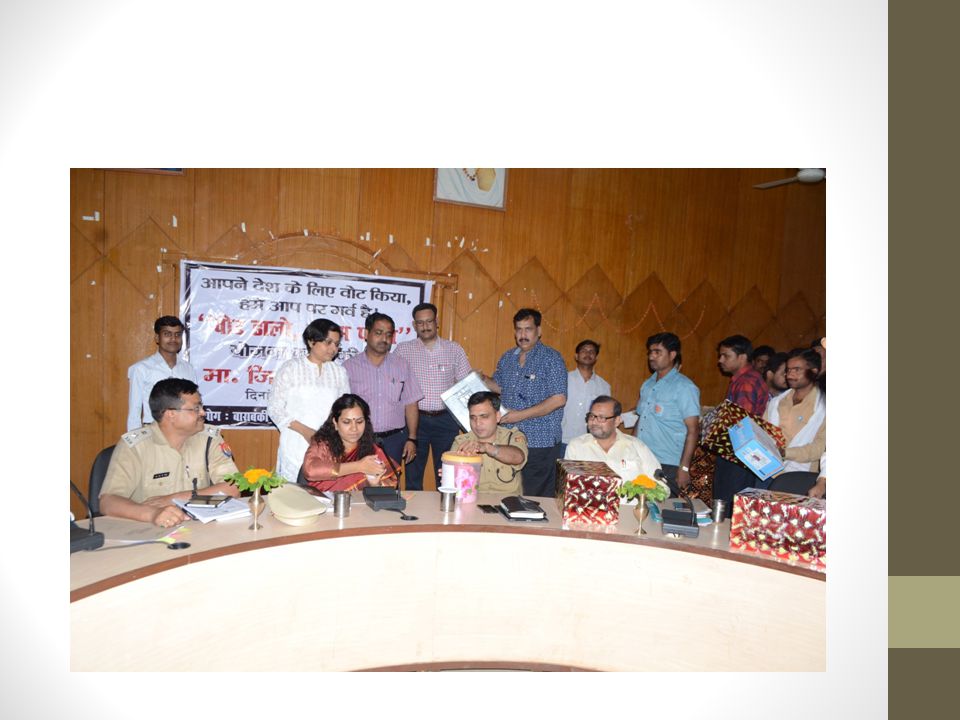
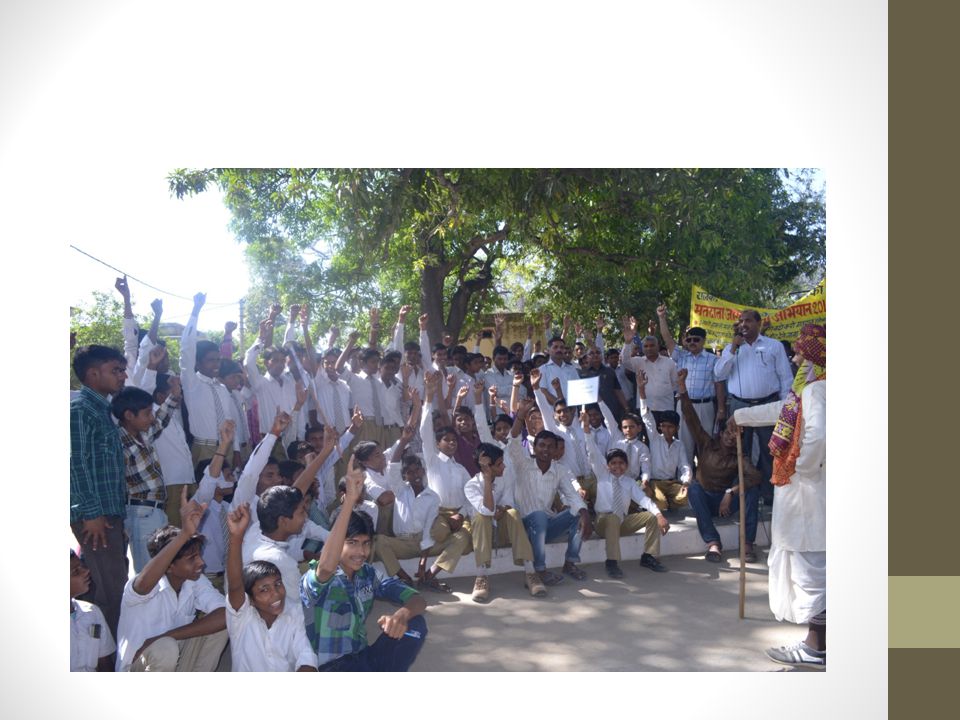
A Few Glimpses of our Journey..

34
Thank you from Team Barabanki

Similar presentations