Download presentation
Presentation is loading. Please wait.

1
International Center for Leadership in Education Dr. Willard R. Dagget 21 st Century Skills & Your Leadership February 23, 2011

2
Schools are Improving School Improvement

3
Schools are Improving School Improvement Changing World

4
Skills Gap

5
Schools are Improving School Improvement Changing World

6
School Improvement Changing World Schools are Improving

7
School Improvement Changing World Schools are Improving

8
1. Create a Culture 2. Shared Vision 3. Leadership 4. Clear Expectations 5. Focus on Instruction 6. Structure 7. Assessment 8. Monitor/Refine 8 COMPONENTS

9
3. Leadership 8 COMPONENTS

10
Coherent Vision Empowerment Leadership Focus

11
ControlControl Vision Driven Quad D Leadership Framework Low HighLow High

12
ControlControl Vision Driven A Quad D Leadership Framework Low HighLow High

13
ControlControl Vision Driven A B Quad D Leadership Framework Low HighLow High

14
ControlControl Vision Driven A B C Quad D Leadership Framework Low HighLow High

15
ControlControl Vision Driven A B D C Quad D Leadership Framework Low HighLow High

16
Leadership A CD B Rules Results

17
Leadership A CD B Control Empower Rules Results

18
Leadership A CD B Teaching / Teachers Learning / Students Rules Control Results Empower

19
Leadership A CD B Compliance Engaged Rules Control Teaching/Teachers Results Empower Learning / Students

20
Leadership A CD B Inputs Outputs Compliance Rules Control Teaching/Teachers Engage Results Empower Learning / Students

21
Vision Driven Leadership A CD B Rules Control Teaching/Teachers Compliance Inputs Results Empower Learning / Students Engaged Outputs

22
ControlControl Vision Driven A B D C Quad D Leadership Framework Low HighLow High

23
1. Create a Culture 8 COMPONENTS

24
Culture Drives Strategy

25
Financial Challenges Larger Context

26
New York 15.2% State Shortfalls

27
Alabama 8.6% State Shortfalls

28
Tennessee 9.8% Alabama 8.6% State Shortfalls

29
Texas10.2% Tennessee 9.8% Alabama 8.6% State Shortfalls

30
Ohio11.3% Texas10.2% Tennessee 9.8% Alabama 8.6% State Shortfalls

31
New York15.2% Ohio11.3% Texas10.2% Tennessee 9.8% Alabama 8.6% State Shortfalls

32
Colorado21.6% New York15.2% Ohio11.3% Texas10.2% Tennessee 9.8% Alabama 8.6% State Shortfalls

33
California21.6% Colorado21.6% New York15.2% Ohio11.3% Texas10.2% Tennessee 9.8% Alabama 8.6% State Shortfalls

34
Georgia26.2% California21.6% Colorado21.6% New York15.2% Ohio11.3% Texas10.2% Tennessee 9.8% Alabama 8.6% State Shortfalls

35
Illinois41.5% Georgia26.2% California21.6% Colorado21.6% New York15.2% Ohio11.3% Texas10.2% Tennessee 9.8% Alabama 8.6% State Shortfalls

36
Nevada54% Illinois41.5% Georgia26.2% California21.6% Colorado21.6% New York15.2% Ohio11.3% Texas10.2% Tennessee 9.8% Alabama 8.6% State Shortfalls

37
THE CLIFF State Shortfalls State Shortfalls Stimulus Stimulus -$100 Billion -$100 Billion - $4 Billion - $4 Billion

38
Federal Legislation Formula Grants

39
Population (Billions)
")
40
Debt (Trillions)
")
41
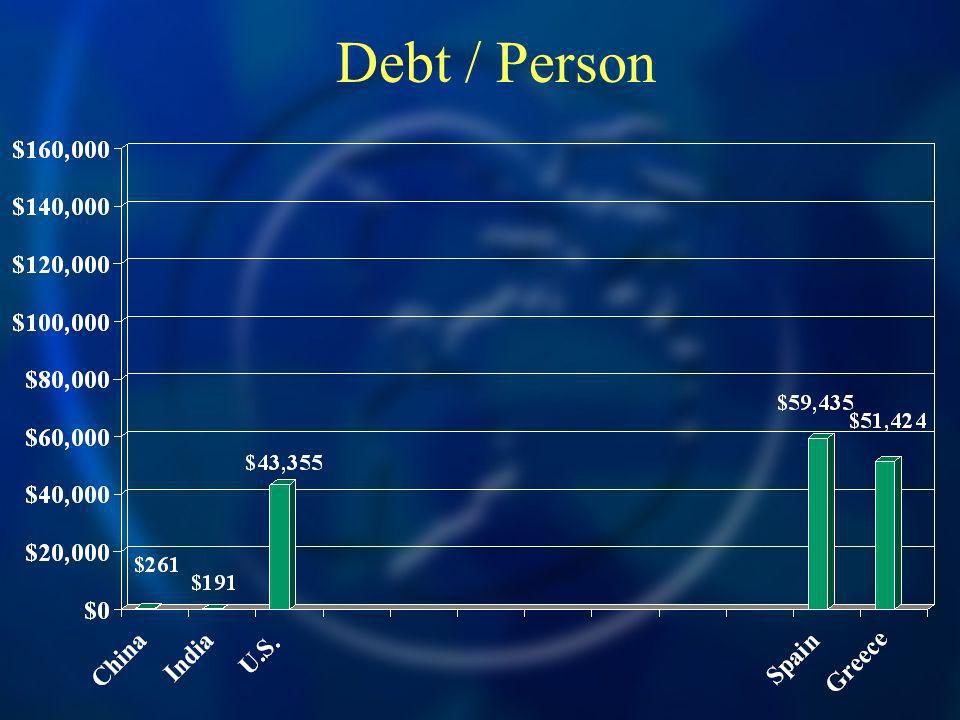
Debt / Person

45
GermanyFrance U.K.

46
Debt / Person Germany France U.K. Bangladesh Brazil PakistanIndonesia

47
Effective and Efficient Framework High Cost Low Cost

48
Effective and Efficient Framework High Cost Low Cost High Student Performance Low Student Performance EfEffecfecttivenessivenessEfEffecfecttivenessivenesst

49
Effective and Efficient Framework High Cost Low Cost High Student Performance Low Student Performance CDCDABABCDCDABAB EfEffecfecttivenessivenessEfEffecfecttivenessivenesst

50
Financial Challenges Technology Larger Context

51
Semantic Web Analyze Documents Analyze Documents Key words and headers (Google) Key words and headers (Google) Meaning / Concepts Meaning / Concepts Wolfram Alpha Wolfram Alpha Complete Task Complete Task
 Key words and headers (Google) Meaning / Concepts Meaning / Concepts Wolfram Alpha Wolfram Alpha Complete Task Complete Task")
52
Implications Home Work Home Work Term Paper Term Paper

55
SPOT Integrated ProjectionIntegrated Projection Projection KeyboardProjection Keyboard

56
Projection Keyboard

57
Projection Keyboard and Projector

58
LEARN to DO

59
LEARN to DO vs. DO to LEARN

60
How Much Are Times Changing How Much Are Times Changing 20002010 Daily Google Search

61
How Much Are Times Changing How Much Are Times Changing 20002010 Daily Google Search 100 m

62
How Much Are Times Changing How Much Are Times Changing 20002010 Daily Google Search 100 m2 b

63
How Much Are Times Changing How Much Are Times Changing 20002010 Daily Google Search 100 m2 b Active Blogs 12,000

64
How Much Are Times Changing How Much Are Times Changing 20002010 Daily Google Search 100 m2 b Active Blogs 12,000141 m

65
How Much Are Times Changing How Much Are Times Changing 20002010 Daily Google Search 100 m2 b Active Blogs 12,000141 m Daily E-mails 12 m

66
How Much Are Times Changing How Much Are Times Changing 20002010 Daily Google Search 100 m2 b Active Blogs 12,000141 m Daily E-mails 12 m247 m

67
How Much Are Times Changing 20002010 Daily Google Search 100 m2 b Active Blogs 12,000141 m Daily E-mails 12 m247 m Text Messages 400,000

68
How Much Are Times Changing How Much Are Times Changing 20002010 Daily Google Search 100 m2 b Active Blogs 12,000141 m Daily E-mails 12 m247 m Text Messages 400,0004.5 b

69
How Much Are Times Changing How Much Are Times Changing 20002010 Daily Google Search 100 m2 b Active Blogs 12,000141 m Daily E-mails 12 m247 m Text Messages 400,0004.5 b Daily Newspaper 4,480

70
How Much Are Times Changing How Much Are Times Changing 20002010 Daily Google Search 100 m2 b Active Blogs 12,000141 m Daily E-mails 12 m247 m Text Messages 400,0004.5 b Daily Newspaper 4,4801,302

71
How Much Are Times Changing How Much Are Times Changing 20002010 Daily Google Search 100 m2 b Active Blogs 12,000141 m Daily E-mails 12 m247 m Text Messages 400,0004.5 b Daily Newspaper 4,4801,302 Time Spent Online 2.7 hrs/wk

72
How Much Are Times Changing How Much Are Times Changing 20002010 Daily Google Search 100 m2 b Active Blogs 12,000141 m Daily E-mails 12 m247 m Text Messages 400,0004.5 b Daily Newspaper 4,4801,302 Time Spent Online 2.7 hrs/wk18 hrs/wk

73
How Much Are Times Changing How Much Are Times Changing 20002010 Daily Google Search 100 m2 b Active Blogs 12,000141 m Daily E-mails 12 m247 m Text Messages 400,0004.5 b Daily Newspaper 4,4801,302 Time Spent Online 2.7 hrs/wk18 hrs/wk CD Sales Revenue $ 943 m

74
How Much Are Times Changing How Much Are Times Changing 20002010 Daily Google Search 100 m2 b Active Blogs 12,000141 m Daily E-mails 12 m247 m Text Messages 400,0004.5 b Daily Newspaper 4,4801,302 Time Spent Online 2.7 hrs/wk18 hrs/wk CD Sales Revenue $ 943 m$ 427.9 m

75
How Much Are Times Changing How Much Are Times Changing 20002010 Daily Google Search 100 m2 b Active Blogs 12,000141 m Daily E-mails 12 m247 m Text Messages 400,0004.5 b Daily Newspaper 4,4801,302 Time Spent Online 2.7 hrs/wk18 hrs/wk CD Sales Revenue $ 943 m$ 427.9 m iTunes Downloads 0

76
How Much Are Times Changing How Much Are Times Changing 20002010 Daily Google Search 100 m2 b Active Blogs 12,000141 m Daily E-mails 12 m247 m Text Messages 400,0004.5 b Daily Newspaper 4,4801,302 Time Spent Online 2.7 hrs/wk18 hrs/wk CD Sales Revenue $ 943 m$ 427.9 m iTunes Downloads 010 b Source: Newsweek – July 26, 2010

77
What will our Students need to: Know Know Do Do

78
Lexile Framework ® for Reading Study Summary of Text Lexile Measures 600 800 1000 1400 1600 1200 Text Lexile Measure (L) High School Literature College Literature High School Textbooks College Textbooks Military Personal Use Entry-Level Occupations SAT 1, ACT, AP* * Source of National Test Data: MetaMetrics Interquartile Ranges Shown (25% - 75%)
 High School Literature College Literature High School Textbooks College Textbooks Military Personal Use Entry-Level Occupations SAT 1, ACT, AP* * Source of National Test Data: MetaMetrics Interquartile Ranges Shown (25% - 75%)")
79
On-the Job Lexile Requirements Construction 1,500 1,400 1,300 1,200 1,100 1,000 900 800 Lexile CraftsmanNurseSalesSecretary National Adult Literacy Study 1992 International Center for Leadership in Education 2009

80
100 % 18 Year Olds Entry Requirements Range of Proficiency

81
2010 High School Graduation Rates U.S.70% Denmark96% Japan93% Poland92%

82
100 % 18 Year Olds Entry Requirements Range of Proficiency 70 % High School Graduate

83
100 % 18 Year Olds 90+ % College Eligible Entry Requirements Range of Proficiency 70 % High School Graduate

84
40% of College Students need Remediation

85
100 % 18 Year Olds 90+ % College Eligible Entry Requirements Range of Proficiency 70 % High School Graduate 55-60% College Ready

86
100 % 18 Year Olds Entry Requirements Range of Proficiency 70 % High School Graduate 90% Work : Minimal Wage

87
Lexile Framework ® for Reading Study Summary of Text Lexile Measures 600 800 1000 1400 1600 1200 Text Lexile Measure (L) High School Literature College Literature High School Textbooks College Textbooks Military Personal Use Entry-Level Occupations SAT 1, ACT, AP* * Source of National Test Data: MetaMetrics Interquartile Ranges Shown (25% - 75%)
 High School Literature College Literature High School Textbooks College Textbooks Military Personal Use Entry-Level Occupations SAT 1, ACT, AP* * Source of National Test Data: MetaMetrics Interquartile Ranges Shown (25% - 75%)")
88
100 % 18 Year Olds Entry Requirements Range of Proficiency 70 % High School Graduate 90% Work : Minimal Wage 60-65% Work : Livable Wage

89
100 % 18 Year Olds 90+ % College Eligible Entry Requirements Range of Proficiency 70 % High School Graduate 55-60% College Ready 90% Work : Minimal Wage 60-65% Work : Livable Wage

90
23% of High School Graduates not eligible for the Military

91
100 % 18 Year Olds 90+ % College Eligible Entry Requirements Range of Proficiency 70 % High School Graduate 50 % Military Ready 55-60% College Ready 90% Work : Minimal Wage 60-65% Work : Livable

92
100 % 18 Year Olds 90+ % College Eligible Entry Requirements Range of Proficiency 70 % High School Graduate 50 % Military Ready 90% Work : Minimal Wage 60-65% Work : Livable 55-60% College Ready

93
Financial Challenges Technology Globalization Larger Context

94
Equity Excellence

95
Wal Mart Source: The Post-American World Largest Corporation 8 times Size of Microsoft 2 % of GDP 1.4 Million Employees More Employees than: GM, Ford, G.E. and IBM Combined

96
China today exports in a single day more than exported in all of 1978. Source: The Rise of India and China...

97
U.S. – 2 nd Half of 20 th Century Only Superpower Highest per Capita Income 1 st in Economic Growth 5% of Population > 24% of Consumption Source: National Academy of Science

98
Work to Worker

99
PISA 2009 1 Shanghai-China556 2 Korea539 3 Finland536 4 Hong Kong-China533 5 Singapore526 6 Canada524 7 New Zealand521 8 Japan520 9 Australia515 10 Netherlands508 17 United States500 20 Germany497 21 Ireland496 22 France496 25 United Kingdom494 33 Spain481 43 Russian Federation459 48 Mexico425 53 Brazil412 57 Indonesia402 Overall Reading Scale Significantly Above OECD Average Not Significantly Different (OECD Average 493) Significantly below OECD Average
 Significantly below OECD Average")
100
PISA 2009 Overall Math Scale Significantly Above OECD Average Not Significantly Different (OECD Average 496) Significantly below OECD Average 1Shanghai-China600 2Singapore562 3Hong Kong-China555 4Korea546 6Finland541 9Japan529 10Canada527 11Netherlands526 13New Zealand519 15Australia514 16Germany513 22France497 28United Kingdom492 31United States487 32Ireland487 34Spain483 38 Russian Federation468 51Mexico419 57Brazil386 61Indonesia371
 Significantly below OECD Average 1Shanghai-China600 2Singapore562 3Hong Kong-China555 4Korea546 6Finland541 9Japan529 10Canada527 11Netherlands526 13New Zealand519 15Australia514 16Germany513 22France497 28United Kingdom492 31United States487 32Ireland487 34Spain Russian Federation468 51Mexico419 57Brazil386 61Indonesia371")
101
PISA 2009 Overall Science Scale Significantly Above OECD Average Not Significantly Different (OECD Average 501) Significantly below OECD Average 1Shanghai-China575 2Finland554 3Hong Kong-China549 4Singapore542 5Japan539 6Korea538 7New Zealand532 8Canada529 10Australia527 11Netherlands522 13Germany520 16United Kingdom514 20Ireland508 23United States502 27France498 36Spain488 39Russian Federation478 50Mexico416 53Brazil405 60Indonesia383
 Significantly below OECD Average 1Shanghai-China575 2Finland554 3Hong Kong-China549 4Singapore542 5Japan539 6Korea538 7New Zealand532 8Canada529 10Australia527 11Netherlands522 13Germany520 16United Kingdom514 20Ireland508 23United States502 27France498 36Spain488 39Russian Federation478 50Mexico416 53Brazil405 60Indonesia383")
102
Elementary Schools 6 Years Integrated Science Biology / ChemistryGrade 7 Biology / PhysicsGrade 8 Physics / ChemistryGrade 9 Integrated ScienceGrades 10 - 12 Source: Ed Week 6/6/07 Chinese Science

103
1. Create a Culture 2. Shared Vision/Data 8 COMPONENTS

104
Application Model 1. Knowledge in one discipline 2. Application within discipline 3. Application across disciplines 4. Application to real-world predictable situations 5. Application to real-world unpredictable situations

105
Rigor/Relevance For All Students

106
1.Awareness 2.Comprehension 3.Application 4.Analysis 5.Synthesis 6.Evaluation Knowledge Taxonomy Knowledge Taxonomy

107
Application Model 1. Knowledge in one discipline 2. Application within discipline 3. Application across disciplines 4. Application to real-world predictable situations 5. Application to real-world unpredictable situations

108
Levels CDCDABABCDCDABAB 1 2 3 4 5 4 5 6 3 2 1 Blooms Application

109
1 2 3 4 5 6 12345 A B D C Rigor/Relevance Framework Express probabilities as fractions, percents, or decimals. Classify triangles according to angle size and/or length of sides. Calculate volume of simple three- dimensional shapes. Given the coordinates of a quadrilateral, plot the quadrilateral on a grid. Analyze the graphs of the perimeters and areas of squares having different-length sides. Determine the largest rectangular area for a fixed perimeter. Identify coordinates for ordered pairs that satisfy an algebraic relation or function. Determine and justify the similarity or congruence for two geometric shapes. Obtain historical data about local weather to predict the chance of snow, rain, or sun during year. Test consumer products and illustrate the data graphically. Plan a large school event and calculate resources (food, decorations, etc.) you need to organize and hold this event. Make a scale drawing of the classroom on grid paper, each group using a different scale. Calculate percentages of advertising in a newspaper. Tour the school building and identify examples of parallel and perpendicular lines, planes, and angles. Determine the median and mode of real data displayed in a histogram Organize and display collected data, using appropriate tables, charts, or graphs.
 you need to organize and hold this event. Make a scale drawing of the classroom on grid paper, each group using a different scale. Calculate percentages of advertising in a newspaper. Tour the school building and identify examples of parallel and perpendicular lines, planes, and angles. Determine the median and mode of real data displayed in a histogram Organize and display collected data, using appropriate tables, charts, or graphs..")
110
1 2 3 4 5 6 12345 A B D C Rigor/Relevance Framework Analyze the graphs of the perimeters and areas of squares having different-length sides. Determine the largest rectangular area for a fixed perimeter. Identify coordinates for ordered pairs that satisfy an algebraic relation or function. Determine and justify the similarity or congruence for two geometric shapes. Obtain historical data about local weather to predict the chance of snow, rain, or sun during year. Test consumer products and illustrate the data graphically. Plan a large school event and calculate resources (food, decorations, etc.) you need to organize and hold this event. Make a scale drawing of the classroom on grid paper, each group using a different scale. Calculate percentages of advertising in a newspaper. Tour the school building and identify examples of parallel and perpendicular lines, planes, and angles. Determine the median and mode of real data displayed in a histogram Organize and display collected data, using appropriate tables, charts, or graphs. Express probabilities as fractions, percents, or decimals. Classify triangles according to angle size and/or length of sides. Calculate volume of simple three- dimensional shapes. Given the coordinates of a quadrilateral, plot the quadrilateral on a grid.
 you need to organize and hold this event. Make a scale drawing of the classroom on grid paper, each group using a different scale. Calculate percentages of advertising in a newspaper. Tour the school building and identify examples of parallel and perpendicular lines, planes, and angles. Determine the median and mode of real data displayed in a histogram Organize and display collected data, using appropriate tables, charts, or graphs. Express probabilities as fractions, percents, or decimals. Classify triangles according to angle size and/or length of sides. Calculate volume of simple three- dimensional shapes. Given the coordinates of a quadrilateral, plot the quadrilateral on a grid..")
111
1 2 3 4 5 6 12345 A B D C Rigor/Relevance Framework Express probabilities as fractions, percents, or decimals. Classify triangles according to angle size and/or length of sides. Calculate volume of simple three- dimensional shapes. Given the coordinates of a quadrilateral, plot the quadrilateral on a grid. Analyze the graphs of the perimeters and areas of squares having different-length sides. Determine the largest rectangular area for a fixed perimeter. Identify coordinates for ordered pairs that satisfy an algebraic relation or function. Determine and justify the similarity or congruence for two geometric shapes. Obtain historical data about local weather to predict the chance of snow, rain, or sun during year. Test consumer products and illustrate the data graphically. Plan a large school event and calculate resources (food, decorations, etc.) you need to organize and hold this event. Make a scale drawing of the classroom on grid paper, each group using a different scale. Calculate percentages of advertising in a newspaper. Tour the school building and identify examples of parallel and perpendicular lines, planes, and angles. Determine the median and mode of real data displayed in a histogram. Organize and display collected data, using appropriate tables, charts, or graphs.
 you need to organize and hold this event. Make a scale drawing of the classroom on grid paper, each group using a different scale. Calculate percentages of advertising in a newspaper. Tour the school building and identify examples of parallel and perpendicular lines, planes, and angles. Determine the median and mode of real data displayed in a histogram. Organize and display collected data, using appropriate tables, charts, or graphs..")
112
1 2 3 12345 A B D C Calculate with numbers, including decimals, ratios, percents, and fractions. Understand two-dimensional motion and trajectories by separating the motion of an object into x and y components.

113
1 2 3 12345 A B D C Know the characteristics and phenomena of sound waves and light waves. Understand the effect of sounds, words, and imagery on a listening audience.

114
Levels CDCDABABCDCDABAB 1 2 3 4 5 4 5 6 3 2 1 Blooms Application

115
Criteria Foundation Learning (Achievement in the core subjects of English language arts, math and science and others identified by the school)
")
116
Criteria Foundation Learning (Achievement in the core subjects of English language arts, math and science and others identified by the school) Stretch Learning (Demonstration of rigorous and relevant learning beyond the minimum requirements)
 Stretch Learning (Demonstration of rigorous and relevant learning beyond the minimum requirements)")
117
Criteria Foundation Learning (Achievement in the core subjects of English language arts, math and science and others identified by the school) Stretch Learning (Demonstration of rigorous and relevant learning beyond the minimum requirements) Student Engagement (The extent to which students are motivated and committed to learning; have a sense of belonging and accomplishment; and have relationships with adults, peers, and parents that support learning)
 Stretch Learning (Demonstration of rigorous and relevant learning beyond the minimum requirements) Student Engagement (The extent to which students are motivated and committed to learning; have a sense of belonging and accomplishment; and have relationships with adults, peers, and parents that support learning)")
118
Criteria Foundation Learning (Achievement in the core subjects of English language arts, math and science and others identified by the school) Stretch Learning (Demonstration of rigorous and relevant learning beyond the minimum requirements) Student Engagement (The extent to which students are motivated and committed to learning; have a sense of belonging and accomplishment; and have relationships with adults, peers, and parents that support learning) Personal Skill Development (Measures of personal, social, service, and leadership skills and demonstrations of positive behaviors and attitudes)
 Stretch Learning (Demonstration of rigorous and relevant learning beyond the minimum requirements) Student Engagement (The extent to which students are motivated and committed to learning; have a sense of belonging and accomplishment; and have relationships with adults, peers, and parents that support learning) Personal Skill Development (Measures of personal, social, service, and leadership skills and demonstrations of positive behaviors and attitudes)")
119
Guiding Principles Responsibility Responsibility Contemplation Contemplation Initiative Initiative Perseverance Perseverance Optimism Optimism Courage Courage Respect Respect Compassion Compassion Adaptability Adaptability Honesty Honesty Trustworthiness Trustworthiness Loyalty Loyalty

120
Survey Tools for Rigor, Relevance and Relationships We Learn Student Survey We Teach Instructional Staff Survey We Lead Whole Staff Survey

121
Teacher vs. Student Comparison T – Students can apply what I am teaching to their everyday lives. 92% S – I can apply what I learn to my everyday life. 58%

122
Teacher vs. Student Comparison T – Students in my classroom engage in hands-on activities. 88% S – We do lots of hands-on activities in my classes. 45%

123
Teacher vs. Student Comparison T – I encourage students to explore career pathways. 80% S – My teachers encourage me to explore different careers. 49%

124
Teacher vs. Student Comparison T – I make learning exciting for my students.84% S – My teachers make learning exciting.40%

125
Teacher vs. Student Comparison T – I am aware of my students interests outside of school. 87% S – My teachers know my interests outside of school. 30%

126
Teacher vs. Student Comparison T – I recognize students when they demonstrate positive behavior in school. 95% S – Good citizenship is rewarded in this school. 40%

127
Criteria Foundation Learning (Achievement in the core subjects of English language arts, math and science and others identified by the school) Stretch Learning (Demonstration of rigorous and relevant learning beyond the minimum requirements) Student Engagement (The extent to which students are motivated and committed to learning; have a sense of belonging and accomplishment; and have relationships with adults, peers, and parents that support learning) Personal Skill Development (Measures of personal, social, service, and leadership skills and demonstrations of positive behaviors and attitudes)
 Stretch Learning (Demonstration of rigorous and relevant learning beyond the minimum requirements) Student Engagement (The extent to which students are motivated and committed to learning; have a sense of belonging and accomplishment; and have relationships with adults, peers, and parents that support learning) Personal Skill Development (Measures of personal, social, service, and leadership skills and demonstrations of positive behaviors and attitudes)")
128
1. Create a Culture 2. Shared Vision 3. Leadership 8 COMPONENTS

129
ControlControl Vision Driven A B D C Quad D Leadership Framework Low HighLow High

130
1. Create a Culture 2. Shared Vision 3. Leadership 4. Clear Expectations 8 COMPONENTS

131
Common Core State Standards Fewer, Clearer, Higher

132
We will soon be Evaluated at the Teacher Level AYP Teacher Evaluation

133
Ohio English Language Arts Indicators Tested

134
State Tests State Standards

135
State Tests State Standards Now

136
State Tests State Standards A A

137
National Essential Skills Study

138
State Standards to CCSS Existing State Standards New Common Core State Standards

139
State Standards to CCSS Existing State Standards New Common Core State Standards Grade 3 4 5 6 7 8 9 10 New York - English Language Arts 5.88% - Mathematics 26.62%

140
Percentage of State Standards Not Aligned to Common Core Standards ELAMathematics FL2.8121 HI3.433 IN16.9933.41 KY27.524.37 MS14.8948.42 NC15.9428.7 NY32.8730.29 OH5.8826.62 OK8.3539.36 TN3248

141
Proficiency

142
Lexile Framework ® for Reading Study Summary of Text Lexile Measures 600 800 1000 1400 1600 1200 Text Lexile Measure (L) High School Literature College Literature High School Textbooks College Textbooks Military Personal Use Entry-Level Occupations SAT 1, ACT, AP* * Source of National Test Data: MetaMetrics Interquartile Ranges Shown (25% - 75%)
 High School Literature College Literature High School Textbooks College Textbooks Military Personal Use Entry-Level Occupations SAT 1, ACT, AP* * Source of National Test Data: MetaMetrics Interquartile Ranges Shown (25% - 75%)")
143
Proficiency Grade 4 Reading Proficiency Grade 4 Reading Proficient Required NAEP Score North Carolina 82 % Texas 81 % Ohio 77 % Florida 71 % Massachusetts 48 % California 48 % South Carolina 35 %

144
Proficiency Grade 4 Reading Proficiency Grade 4 Reading Proficient Required NAEP Score North Carolina 82 %183 Texas 81 %190 Ohio 77 %199 Florida 71 %202 Massachusetts 48 %234 California 48 %210 South Carolina 35 %228

145
Proficiency Grade 8 Reading Proficiency Grade 8 Reading Proficient Required NAEP Score North Carolina 88 % Texas 83 % Ohio 80 % Florida 44 % California 39 % South Carolina 30 %

146
Proficiency Grade 8 Reading Proficiency Grade 8 Reading Proficient Required NAEP Score North Carolina 88 %217 Texas 83 %225 Ohio 80 %241 Florida 44 %265 California 39 %262 South Carolina 30 %276

147
Proficiency Grade 4 Mathematics Proficiency Grade 4 Mathematics Proficient Required NAEP Score North Carolina 91 % Texas 82 % Michigan 73 % Ohio 65 % Florida 63 % California 51 % South Carolina 39 % Massachusetts 39 %

148
Proficiency Grade 4 Mathematics Proficiency Grade 4 Mathematics Proficient Required NAEP Score North Carolina 91 %203 Texas 82 %219 Michigan 73 %222 Ohio 65 %233 Florida 63 %230 California 51 %231 South Carolina 39 %246 Massachusetts 39 %255

149
Proficiency Grade 8 Mathematics Proficiency Grade 8 Mathematics Proficient Required NAEP Score North Carolina 84 % Ohio 63 % Texas 61 % Michigan 61 % Florida 58 % Massachusetts 42 % South Carolina 24 %

150
Proficiency Grade 8 Mathematics Proficiency Grade 8 Mathematics Proficient Required NAEP Score North Carolina 84 %247 Ohio 63 %274 Texas 61 %273 Michigan 61 %269 Florida 58 %269 Massachusetts 42 %301 South Carolina 24 %305

151
NESS & Lexile State Tests State Standards C A C

152
Common Core Standards NESS & Lexile State Tests State Standards C

153
Common Core Standards NESS & Lexile State Tests State Standards C A

154
Common Core Standards NESS & Lexile State Tests State Standards Consortium Assessment

155
Common Core Standards NESS & Lexile State Tests State Standards Consortium Assessment DA

156
1. Create a Culture 2. Shared Vision 3. Leadership 4. Clear Expectations 8 COMPONENTS

157
Common Core State Standards Fewer, Clearer, Higher

158
A B D C

159
1. Create a Culture 2. Shared Vision 3. Leadership 4. Clear Expectations 8 COMPONENTS

160
Common Core Standards NESS & Lexile State Tests State Standards Consortium Assessment DA

161
The Navigator The Navigator

162
1. Create a Culture 2. Shared Vision 3. Leadership 4. Clear Expectations 5. Focus on Instruction 8 COMPONENTS

163
Instruction NOT Structure Instruction NOT Structure

164
Gold Seal Lessons

165
Levels CDCDABABCDCDABAB 1 2 3 4 5 4 5 6 3 2 1 Blooms Application

166
Career & Technical Education Ohio English Language Arts Benchmarks/Indicators Grade 10 OTG Agriculture, Food & Natural Resources Architecture & Construction Food Products & Processing Systems Agribusiness Systems Power, Structural & Technical Systems Environmental Service Systems Plant Systems Natural ResourceSystems Animal Systems Design/ Pre-Construction Maintenance/ Operations 1. Define unknown words through context clues and the authors use of comparison, contrast and cause and effect. H 2. Analyze the relationships of pairs of words in analogical statements (e.g., synonyms and antonyms, connotation and denotation) and infer word meanings from these relationships. L 3. Infer the literal and figurative meaning of words and phrases and discuss the function of figurative language, including metaphors, similes, idioms and puns. H 4. Analyze the ways that historical events influenced the English language. H 5. Use knowledge of Greek, Latin and Anglo-Saxon roots, prefixes and suffixes to understand complex words and new subject-area vocabulary (e.g., unknown words in science, mathematics and social studies). H 6. Determine the meanings and pronunciations of unknown words by using dictionaries, glossaries, technology and textual features, such as definitional footnotes or sidebars. M 1. Apply reading comprehension strategies, including making predictions, comparing and contrasting, recalling and summarizing and making inferences and drawing conclusions. H
 and infer word meanings from these relationships. L 3. Infer the literal and figurative meaning of words and phrases and discuss the function of figurative language, including metaphors, similes, idioms and puns. H 4. Analyze the ways that historical events influenced the English language. H 5. Use knowledge of Greek, Latin and Anglo-Saxon roots, prefixes and suffixes to understand complex words and new subject-area vocabulary (e.g., unknown words in science, mathematics and social studies). H 6. Determine the meanings and pronunciations of unknown words by using dictionaries, glossaries, technology and textual features, such as definitional footnotes or sidebars. M 1. Apply reading comprehension strategies, including making predictions, comparing and contrasting, recalling and summarizing and making inferences and drawing conclusions. H.")
167
Ohio Arts Education Ohio English Language Arts Benchmarks/Indicators Grade 6 NESS Grade 6 Achievement Test Visual Arts DanceMusicTheatre 1. Define the meaning of unknown words by using context clues and the authors use of definition, restatement and example. E5H 1. Establish and adjust purposes for reading, including to find out, to understand, to interpret, to enjoy and to solve problems. E2 E12 H 2. Predict or hypothesize as appropriate from information in the text, substantiating with specific references to textual examples that may be in widely separated sections of text. E12 E13 H 3. Make critical comparisons across texts, noting authors style as well as literal and implied content of text. E24H 4. Summarize the information in texts, recognizing important ideas and supporting details, and noting gaps or contradictions. E2 E9 H 5. Select, create and use graphic organizers to interpret textual information. E6 E22 E31 M 6. Answer literal, inferential, evaluative and synthesizing questions to demonstrate comprehension of grade-appropriate print texts and electronic and visual media. E2H

168
Levels CDCDABABCDCDABAB 1 2 3 4 5 4 5 6 3 2 1 Blooms Application

169
RIGORRIGOR RELEVANCE A B D C Rigor/Relevance Framework Teacher Works StudentThinks Student Thinks and Works StudentWorks High Low Teacher/Student Roles

170
Rigor and Relevance Handbook

171
Instructional Strategy for Quadrant D Lessons

172
Selection of Strategies Based on Rigor/ Relevance Framework

173
Instructional Strategies: How to Teach for Rigor and Relevance

174
What AYP Teacher Evaluation 3 Year Transition Plan

175
1. Create a Culture 2. Shared Vision 3. Leadership 4. Clear Expectations 5. Focus on Instruction 6. Structure 8 COMPONENTS

176
Lessons Learned 1. Looping

177
Lessons Learned 1.Looping 2.9 th Grade Academy

178
Lessons Learned 1.Looping 2.9 th Grade Academy 3.Interdisciplinary Department Chairpersons

179
1. Create a Culture 2. Shared Vision 3. Leadership 4. Clear Expectations 5. Focus on Instruction 6. Structure 7. Assessment 8 COMPONENTS

180
Lexile Framework ® for Reading Study Summary of Text Lexile Measures 600 800 1000 1400 1600 1200 Text Lexile Measure (L) High School Literature College Literature High School Textbooks College Textbooks Military Personal Use Entry-Level Occupations SAT 1, ACT, AP* * Source of National Test Data: MetaMetrics Interquartile Ranges Shown (25% - 75%)
 High School Literature College Literature High School Textbooks College Textbooks Military Personal Use Entry-Level Occupations SAT 1, ACT, AP* * Source of National Test Data: MetaMetrics Interquartile Ranges Shown (25% - 75%)")
181
Lexile Framework ® - Student Profile Matt - Age 15, Grade 10, Lexile 1090, GPA 3.0 600 800 1000 1400 1600 1200 Text Lexile Measure (L) Matt * Source of National Test Data: MetaMetrics 910
 Matt * Source of National Test Data: MetaMetrics 910")
182
Lexile Framework ® - Student Profile 600 800 1000 1400 1600 1200 Text Lexile Measure (L) High School Literature College Literature High School Textbooks College Textbooks Military Personal Use Entry-Level Occupations SAT 1, ACT, AP* * Source of National Test Data: MetaMetrics Matt 600 800 1000 1400 1600 1200 High School Literature College Literature High School Textbooks College Textbooks Military Personal Use Entry-Level Occupations SAT 1, ACT, AP* 1 st Quarter 2 nd Quarter 3 rd Quarter 4 th Quarter
 High School Literature College Literature High School Textbooks College Textbooks Military Personal Use Entry-Level Occupations SAT 1, ACT, AP* * Source of National Test Data: MetaMetrics Matt High School Literature College Literature High School Textbooks College Textbooks Military Personal Use Entry-Level Occupations SAT 1, ACT, AP* 1 st Quarter 2 nd Quarter 3 rd Quarter 4 th Quarter")
183
1. Create a Culture 2. Shared Vision 3. Leadership 4. Clear Expectations 5. Focus on Instruction 6. Structure 7. Assessment 8. Monitor/Refine 8 COMPONENTS

184
Brain Research

185
Sight Connections / Pathways Prefrontal Cortex Hearing Association Area

186
19 th Annual Model Schools Conference June 26 – 29, 2011 www.ModelSchoolsConference.com

187
Effective and Efficient Framework High Cost Low Cost

188
Effective and Efficient Framework High Cost Low Cost High Student Performance Low Student Performance EfEffecfecttivenessivenessEfEffecfecttivenessivenesst

189
Effective and Efficient Framework High Cost Low Cost High Student Performance Low Student Performance CDCDABABCDCDABAB EfEffecfecttivenessivenessEfEffecfecttivenessivenesst

190
1587 Route 146 Rexford, NY 12148 Phone (518) 399-2776 Fax (518) 399-7607 E-mail - info@LeaderEd.com www.LeaderEd.com International Center for Leadership in Education, Inc.
 Fax (518) International Center for Leadership in Education, Inc.")
Similar presentations