Download presentation
Presentation is loading. Please wait.

1
FETs-1 (Field Effect Transistors)
Engineering 43 FETs-1 (Field Effect Transistors) Bruce Mayer, PE Registered Electrical & Mechanical Engineer
 Bruce Mayer, PE. Registered Electrical & Mechanical Engineer")
2
Learning Goals Understand the Basic Physics of MOSFET Operation
Describe the Regions of Operation for a MOSFET Device Use the Graphical LOAD-LINE method to analyze the operation of basic MOSFET Amplifiers Determine the LARGE-SIGNAL Bias-Point (Q-Point) for MOSFET circuits
 for MOSFET circuits.")
3
Learning Goals Use SMALL-SIGNAL models to analyze various FET Amplifiers Calculate Performance Metrics for various FET Amplifiers Apply FETs to the Design and Construction of CMOS Logic Gates

4
Transistor What is it? Transistor is a contraction for “Transfer Resistor” These devices have THREE connections: Input Output Control The transistor’s Fluidic-Analog is a Metering (Needle) Valve (a Faucet)
 Valve (a Faucet)")
5
The concept of voltage-controlled resistance
An independent Voltage Applied to the Control connection (the “Gate) regulates the flow of Current Thru the device Drain (or Source) Gate Source (or Drain)
 regulates the flow of Current Thru the device. Drain (or Source) Gate. Source (or Drain)")
6
Flavors of FETS Junction Field Effect Transistor → JFET
A Normally ON transistor Reverse Biasing two PN Junctions will “Pinch Off” a Conducting Channel

7
Flavors of FETS Depletion Mode MOSFET
Another Normally ON transistor Applying a Gate Voltage Drives Carriers OUT of the conducting Channel to turn off the transistor No direct Gate↔Channel Connection An Isulated Gate Field Effect Transistor (IGFET)
")
8
Flavors of FETS Enhancement Mode MOSFET
Normally OFF transistor Another IGFET Applying a Gate Voltage Attracts & Creates carriers to FORM a conducting Channel to turn ON the transistor These Make Great Switches

9
MOSFET What does that mean?
M → Metal O → Oxide S → Silicon F → Field E → Effect T → Transistor Short for “Transfer Resistor” Often times for Pfets the Substrate is tied to the drain. This was the case in Mr. Phillips Lab

10
Enhancement Mode - IGFET
Insulated Gate Field Effect Transistors are Normally-Off devices Applying a Positive Voltage to the Gate will attract e− to the Channel This will eventually “invert” a thin region below the gate to N-type, creating a conducting channel between S & D IGFETs are Great Switches Used in almost all digital IC’s Back-to-Back PN Jcns Between “source” & “drain”

11
MOSFET Nomenclature & Dims
We will consider only Enhancement FETs n+ ≡ Heavily Doped n-Type An n-Channel (nFET) enhancement mode FET
 enhancement mode FET.")
12
MOSFET: Current & Speed
In General the performance of an Enhancement Mode MOSFET Current Carrying Capacity Increases with Increasing Width, W On/Off Switching Speed Increases with Decreasing Gate Length, L As of 2011 the minimum (best) value for L was about 22 nm
 value for L was about 22 nm.")
13
MOSFET On/Off Operation
Step 1: Apply Gate Voltage SiO2 Insulator (Glass) Gate Source Drain 5 volts holes N N electrons P electrons to be transmitted Step 3: Channel becomes saturated with electrons. Electrons in source are able to flow across channel to Drain. Step 2: Excess electrons surface in channel, holes are repelled.
 Gate. Source. Drain. 5 volts. holes. N. N. electrons. P. electrons to be transmitted. Step 3: Channel becomes saturated with electrons. Electrons in source are able to flow across channel to Drain. Step 2: Excess electrons surface in channel, holes are repelled.")
14
nMOSFET Circuit Symbol
n-Channel MOSFET electrons move from Source→Drain to produce the Drain Current PN Junction forms between Substrate and Channel when FET is “ON”

15
MOSFET Operation: CutOff
As seen in previous diagrams, unpowered MOSFETS have two OPOSING PN junctions Channel→Source Channel→Drain With NO Potential applied to the gate No current can flow From the Previous slide the Minimum Gate Voltage required for current-flow is called the “Threshold” Voltage, Vto or Vth A MOSFET with VGS < Vth is “CutOff” i.e.; The MOSFET is Off, and the Drain Current, iD = 0

16
MOSFET Circuit in CutOff
The Diagram at Right shows an nMOSFET in CutOff For vGS<Vto the PN Jcn between the Drain & Body is Reversed Biased by vDS and NO Current flows Vto is typically Volts Mathematically this is simple; in CutOff, the Drain Current

17
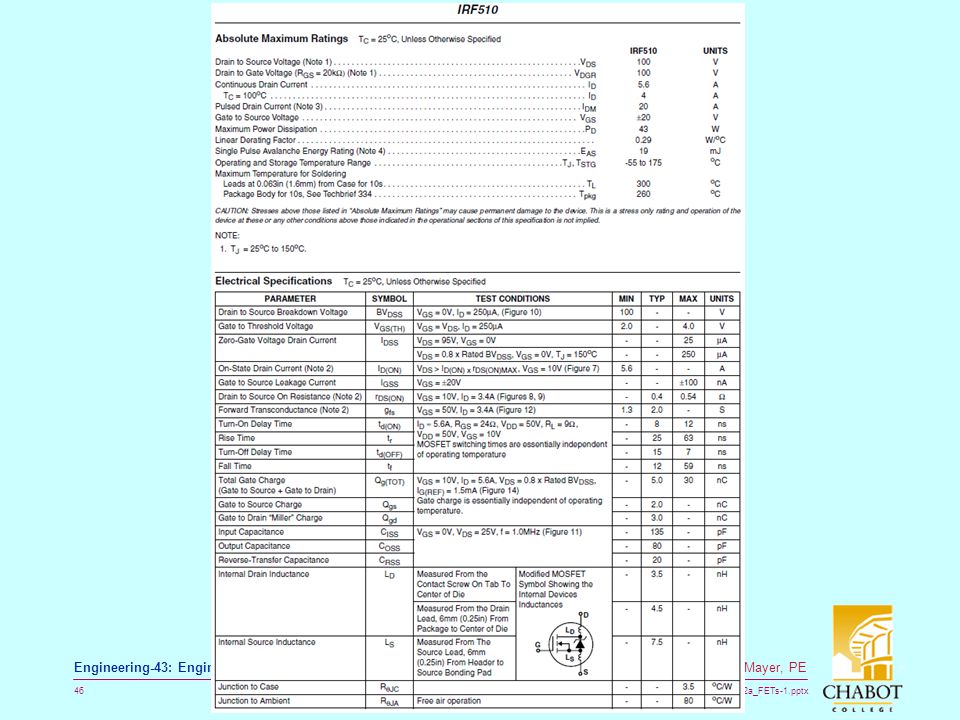
Power MOSFET Data Sheet

18
CutOff Summarized VGS < Vto → No Drain Current Flows

19
MOSFET IN Triode (Ohmic) Region
In this case the nMOSFET Voltage conditions: Electrons are ATTRACTED to the Positive-Gate and a thin Conducting Channel Forms In this Region the Drain Current depends on BOTH vDS and vGS Fluid Analogy → needle valve The region is “TRIode” as the condition of all three connections determines iD

20
nMOSFET in Triode Operation
When vGS > Vto a conducting channel forms below the gate

21
Triode Operation When vGS > Vto a conducting channel forms below the gate. That is the “type” of the silicon is INVERTED from p-Type to n-Type Thus this conducting Channel is often called an “Inversion Layer” The greater vGS The more the conducting the channel becomes The Channel resistance is a fcn of vGS

22
Triode Operation In the Triode Region, iD increases for
Increasing vGS Increasing vDS Thus current thru the device depends on the voltage at ALL three connections as long as vDS < (vGS − Vto) The Three-Connection dependency is why this region is called TRIODE
 The Three-Connection dependency is why this region is called TRIODE.")
23
Triode Operation In Triode Operation, the iD curve is a concave-down Parabola given by Where The Device Transconductance Parameter, KP, Depends on the Construction of the FET KP for nFETs is typically µA/V2

24
PinchOff In order to form a complete channel, every point, x, along the channel must have a voltage difference greater than Vto That is, need The greater this qty, the thicker the conducting Layer Now as vDS is increased eventually at x = L where vchan = vDS The Channel Thickness goes to ZERO. This is called PINCH-OFF

25
PinchOff Illustrated The layer is THICKEST at the Source and ZERO at the Drain when Thus Have PinchOff when At this Point the channel is Very Thick at the Source-End, and Zero-Thick at the Drain End → Pinched Off at Drain

26
TriOde Region Summarized
vDS ≤ (vGS − Vto) → iD = f(vDS , VGS) Start of TriOde → Channel Formation Finish of TriOde → Drain PinchOff
 → iD = f(vDS , VGS) Start of TriOde → Channel Formation. Finish of TriOde → Drain PinchOff.")
27
PinchOff iD Saturation
As vDS increases the “PinchOff Point”, xpop, Moves BACKWARDS towards the Source Once the channel Pinches Off, the drain current, iD, NO Longer increases with increasing vDS In other words, for a given vGS, the Current “Saturates” (stays constant) After PinchOff as shown below
 After PinchOff as shown below.")
28
nMOSFET complete vi Curve

29
MOSFET Operation Summary
Cut-Off Region – In this region the gate voltage is less than the Threshold voltage Vto and therefore very little current flows. Triode Region – In this mode the device is operating below pinch-off and is effectively a variable resistor. Saturation Region – This is the main operating region for the device. The drain voltage has to be greater than the gate voltage minus the Threshold voltage.

30
Operation in Saturation
Notice that in SAT iD varies with vGS Note that vDS does NOT appear in this Equation vDS (on vi curve) does NOT affect iD after Channel-PinchOff In SAT a MOSFET is true 3-terminal device; current depends ONLY on the CONTROL Signal, vGS
 does NOT affect iD after Channel-PinchOff. In SAT a MOSFET is true 3-terminal device; current depends ONLY on the CONTROL Signal, vGS.")
31
Saturation Summarized
vDS ≥ (vGS − Vto) → iD ≠ f(vDS) PinchOff Moved BACK from Drain
 → iD ≠ f(vDS) PinchOff Moved BACK from Drain.")
32
Triode↔Saturation Boundary
At the boundary Line the nMOSFET just Barely Pinches Off at the Drain end thus: By KVL Substituting Find Or at the Boundary Boundary Line Sub for vGS into iD,sat Eqn

33
nFET KVL 𝒗 𝑮𝑫 = 𝒗 𝑮𝑺 − 𝒗 𝑫𝑺

34
Triode↔Saturation Boundary
Then then iD along the Boundary The Boundary is described by a Concave-UP Parabola that passes thru the origin Boundary Line

35
Example 12.1 make vi Plot Use Parameters from Example 12.1 to plot in MATLAB the vi Curve for an nMOSET The Parameters W = 160 µm L = 2 µm (pretty large) KP = 50 µA/V2 Vto = 2V Plot has multiple operating regions → must concatenate
 KP = 50 µA/V2. Vto = 2V. Plot has multiple operating regions → must concatenate.")
36
The completed Plot

37
MATLAB Code-1 % Bruce Mayer, PE % ENGR43 * 14Jan12
% file = nMOSFET_Plot_ex12_1_1201.m W = 160; % µm L = 2; % µm KP = 50; % µA/sq-V Vto = 2' % V % % calc Parameter K K = (W/L)*KP/2; % µA/sqV) % set vGS values that exceed CutOff at 2V vGS = [3, 4, 5, 6]; % calc boundary Triode/Sat boundary by finding iD at the START of sat % region iDsat_uA = K*(vGS-Vto).^2; % in µA iDsat_mA = iDsat_uA/1000 % show cutoff line vDSco = linspace(0,10, 200); iDco = zeros(200); % DeBug Command => plot(vDSco, iDco, 'LineWidth', 3) % Calc iD in Triode Region for vGS>Vto (Pinched off at Drain) %* use eqn (12.6) in text vDSsat = sqrt(iDsat_uA/K) % must take care with units plot(vDSsat,iDsat_mA, '--*', 'LineWidth', 3), grid, xlabel('vDSsat'), ylabel('iDsat') disp('showing Triode-Sat Boundary - Hit any key to continue') pause MATLAB Code-1
*KP/2; % µA/sqV) % set vGS values that exceed CutOff at 2V. vGS = [3, 4, 5, 6]; % calc boundary Triode/Sat boundary by finding iD at the START of sat. % region. iDsat_uA = K*(vGS-Vto).^2; % in µA. iDsat_mA = iDsat_uA/1000. % show cutoff line. vDSco = linspace(0,10, 200); iDco = zeros(200); % DeBug Command => plot(vDSco, iDco, LineWidth , 3) % Calc iD in Triode Region for vGS>Vto (Pinched off at Drain) %* use eqn (12.6) in text. vDSsat = sqrt(iDsat_uA/K) % must take care with units. plot(vDSsat,iDsat_mA, --* , LineWidth , 3), grid, xlabel( vDSsat ), ylabel( iDsat ) disp( showing Triode-Sat Boundary - Hit any key to continue ) pause. MATLAB Code-1.")
38
MATLAB Code-2 % then iD in triode region
vDSt1 = linspace(0, vDSsat(1)); % V vDSt2 = linspace(0, vDSsat(2)) vDSt3 = linspace(0, vDSsat(3)) vDSt4 = linspace(0, vDSsat(4)) iDt1_mA = K*(2*(vGS(1)-Vto)*vDSt1-vDSt1.^2)/1000; % mA iDt2_mA = K*(2*(vGS(2)-Vto)*vDSt2-vDSt2.^2)/1000; % mA iDt3_mA = K*(2*(vGS(3)-Vto)*vDSt3-vDSt3.^2)/1000; % mA iDt4_mA = K*(2*(vGS(4)-Vto)*vDSt4-vDSt4.^2)/1000; % mA % % DeBug Command =>plot(vDSt1,iDt1_mA, vDSt4,iDt4_mA) % use TwoPoint Plots in Sat iDsat1 =[iDsat_mA(1),iDsat_mA(1)] iDsat2 =[iDsat_mA(2),iDsat_mA(2)] iDsat3 =[iDsat_mA(3),iDsat_mA(3)] iDsat4 =[iDsat_mA(4),iDsat_mA(4)] vDSsat1 = [vDSsat(1), 10] vDSsat2 = [vDSsat(2), 10] vDSsat3 = [vDSsat(3), 10] vDSsat4 = [vDSsat(4), 10]
); % V. vDSt2 = linspace(0, vDSsat(2)) vDSt3 = linspace(0, vDSsat(3)) vDSt4 = linspace(0, vDSsat(4)) iDt1_mA = K*(2*(vGS(1)-Vto)*vDSt1-vDSt1.^2)/1000; % mA. iDt2_mA = K*(2*(vGS(2)-Vto)*vDSt2-vDSt2.^2)/1000; % mA. iDt3_mA = K*(2*(vGS(3)-Vto)*vDSt3-vDSt3.^2)/1000; % mA. iDt4_mA = K*(2*(vGS(4)-Vto)*vDSt4-vDSt4.^2)/1000; % mA. % % DeBug Command =>plot(vDSt1,iDt1_mA, vDSt4,iDt4_mA) % use TwoPoint Plots in Sat. iDsat1 =[iDsat_mA(1),iDsat_mA(1)] iDsat2 =[iDsat_mA(2),iDsat_mA(2)] iDsat3 =[iDsat_mA(3),iDsat_mA(3)] iDsat4 =[iDsat_mA(4),iDsat_mA(4)] vDSsat1 = [vDSsat(1), 10] vDSsat2 = [vDSsat(2), 10] vDSsat3 = [vDSsat(3), 10] vDSsat4 = [vDSsat(4), 10]")
39
MATLAB Code-3 % % Now Concatenate to ocver Triode & Saturation Regions
iD1 = [iDt1_mA,iDsat1] vDS1 = [vDSt1, vDSsat1] iD2 = [iDt2_mA,iDsat2] vDS2 = [vDSt2, vDSsat2] iD3 = [iDt3_mA,iDsat3] vDS3 = [vDSt3, vDSsat3] iD4 = [iDt4_mA,iDsat4] vDS4 = [vDSt4, vDSsat4] % Finally Make Plot plot(vDSco, iDco,'b', vDS1, iD1,'c', vDS2, iD2,'g', vDS3, iD3,'m', vDS4, iD4,'r', 'LineWidth', 3),... grid, xlabel('vDS (Volts)'), ylabel('iD (mA)'), title('nMOSFET vi Curve - Ex 12.1'),... gtext('VGS<Vto'), gtext('vGS=3V'), gtext('vGS=4V'), gtext('vGS=5V'), gtext('vGS=6V')
,... grid, xlabel( vDS (Volts) ), ylabel( iD (mA) ), title( nMOSFET vi Curve - Ex 12.1 ),... gtext( VGS<Vto ), gtext( vGS=3V ), gtext( vGS=4V ), gtext( vGS=5V ), gtext( vGS=6V )")
40
pMOSFET A “pMOS” FET is the “Complement” to the nMOS version.
The channel is normally n-Type and a hole-populated conducting Channel is formed by applying a NEGATIVE vGS Basically the pMOS version looks like the nMOS FET with voltage-polarities inverted pMOSFET Circuit Symbol In this case HOLES flow from Source-to-Drain so Current flow S→D Channel

41
p & n MOSFET Comparison nFET are generally FASTER than pFETS

42
3 & 4 Connection nFET All Done for Today
The BODY is often hard-connected to the SOURCE for nFETS

43
Appendix Diode vi Curves
Engineering 43 Appendix Diode vi Curves Bruce Mayer, PE Registered Electrical & Mechanical Engineer

Similar presentations


 Field-Effect Transistors (FET) MOSFET Introduction 1.>")


>")

