Download presentation
Presentation is loading. Please wait.

1
Environmental Science
Richard T. Wright Environmental Science Tenth Edition Chapter 5 The Human Population Copyright © 2008 Pearson Prentice Hall, Inc.

2
10/27—10/28 10/27 Report to the library: finish poster,
Start photo essay Start Barrier Island lesson 10/ ½ Day alternative const. video Please retrive any data needed from class laptops.

3
Current world Population
Current US population

4
Human Population Growth and the Consequences
Human population expansion and its cause Different worlds Consequences of population growth and affluence Dynamics of population growth

5
Human Population Expansion and Its Cause
Reasons for the patterns of growth Biotic potential exceeds environmental resistance: birth rates exceed death rates There are 6.3 billion people on Earth If each one stood up, pronounced their name and sat down It would take 600 years to complete roll call By 2025 it will take 1,000 years to complete this exercise

6
World Population Over the Centuries
9,000 human beings added to the planet every hour

7
Modeling Population Growth
Human Population Growth and Regulation

8
Modeling Population Growth
Human Population Growth and Regulation

9
Modeling Population Growth
Human Population Growth and Regulation

10
Modeling Population Growth
Human Population Growth and Regulation

11
Reasons for the Human Population Explosion
Causes of disease recognized Improvements in nutrition Discovery of antibiotics Improvements in medicine Increase in number of women who actually reach child-bearing age Short doubling times in some countries

12
Modeling Population Growth
Human Population Growth and Regulation

13
Changing Human Survivorship Curves: Went from B to A
% Survival B Birth Age Death

14
World Population Growth and Absolute Growth

16
Population Projections Based on Different Fertility Assumptions
Maintain fertility rate of 2.6 children/woman Gradual decline in fertility in developing countries. 2.02 children/woman ½ child lower than medium projection ½ child higher than medium projection

17
Average Number of Children, Grandchildren, and Great Grandchildren
America West Germany Africa 14 5 258

18
Different Worlds Rich nations, poor nations
Population growth in rich and poor nations Different populations, different problems

19
Major Economic Divisions of the World
Gross national income/capita

20
High-income, highly developed, industrialized countries
Economic Categories Based on Per Capita Gross National Income (see Fig. 5-4) High-income, highly developed, industrialized countries United States, Japan, Canada Average GNI per capita = $26,710 Middle-income, moderately developed countries Latin America, South Africa, China Average GNI per capita = $1,850
 High-income, highly developed, industrialized countries. United States, Japan, Canada. Average GNI per capita = $26,710. Middle-income, moderately developed countries. Latin America, South Africa, China. Average GNI per capita = $1,850.")
21
Low-income, developing countries
Economic Categories Based on Per Capita Gross National Income (see Fig. 5-4) Low-income, developing countries Western and central Africa, India, central Asia Average GNI per capita = $430
 Low-income, developing countries. Western and central Africa, India, central Asia. Average GNI per capita = $430.")
22
Disparities Developed countries Low-income developing countries
15% of the world’s population Control 80% of the world’s wealth Low-income developing countries 37% of the world’s population Control 3.0% of the world’s gross national income Difference in per capita income: 63 to 1!

23
Dimensions of the Human Poverty Index

24
Different Populations, Different Problems
IPAT Formula: calculates human pressure on the environment (I = P x A x T) I = environmental impact P = population A = affluence and consumptive patterns T = level of technology in the society
 I = environmental impact. P = population. A = affluence and consumptive patterns. T = level of technology in the society.")
25
Different Populations, Different Problems
Environmental impact of developing countries due to “P.” Environmental impact of developed countries due to “A” and “T.” Both have some measure of “I” for different reasons. Average American places at least 20 times the demand on Earth’s resources compared to a person in Bangladesh.

26
Different Populations, Different Problems
How does stewardship (S) affect the IPAT formula? S = wildlife conservation, pollution control, energy conservation, and recycling I = P x A x T S
 affect the IPAT formula S = wildlife conservation, pollution control, energy conservation, and recycling. I = P x A x T. S.")
27
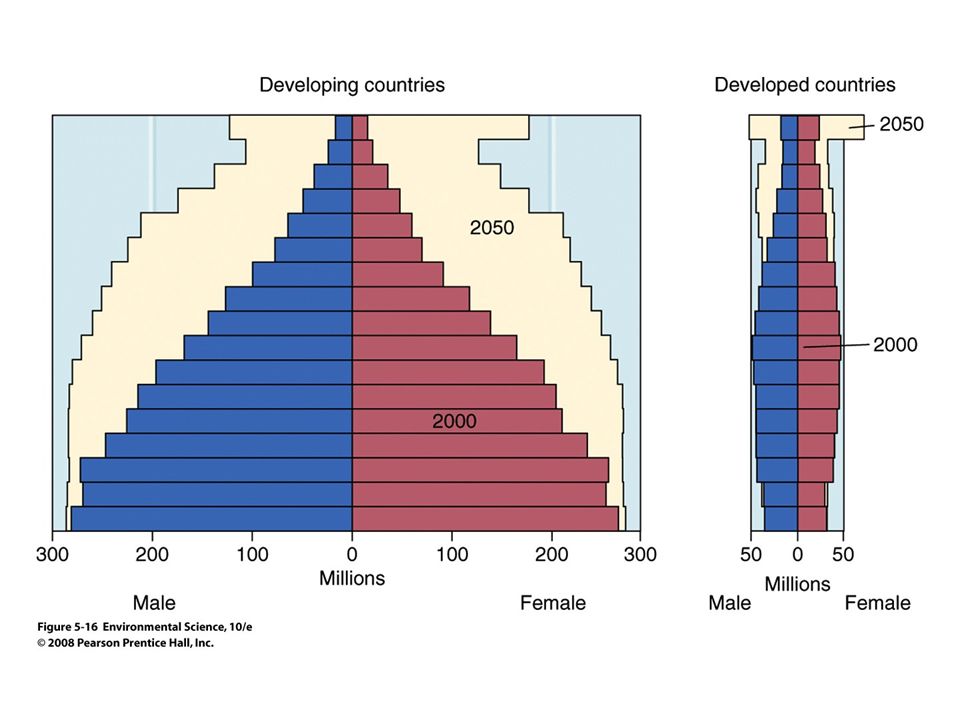
Population Increase in Developed and Developing Countries

28
Population Data for Selected Countries (Table 5-2)
Country Total Fertility Rate Doubling Times (Years) World 2.7 58 Developing Countries 2.9 47 Developed Countries 1.6 700
 World Developing Countries Developed Countries")
29
Different Populations, Different Problems
Human pressure on the environment caused by three factors Expanding Population size Increasing Affluence Technology

30
Global Conditions for a Sustainable Population
Lower fertility rates (stabilize population) Consumption must decrease Protect the environment (stewardly action must increase
 Consumption must decrease. Protect the environment (stewardly action must increase.")
31
The Developing Countries
Pre Industrial Revolution: Lived on the land, raised livestock, produced food for personal use and a little for barter Small sustainable populations sustained for 1000+years After WWII Modern medicine (vaccines) Death rates plummeted/ Large population growth
 Death rates plummeted/ Large population growth.")
32
Consequences of Population Growth
Today 70% of the world’s poor live in rural areas and engage in small-scale agriculture Farming a few acres of land

33
Options in the Developing Countries
Reform the system of land ownership Intensify cultivation of existing land to increase production per unit area Open new land to farm Move to cities and seek employment Engage in illicit activities for income Move to other countries How do these “solutions” aggravate the problems?

34
Options for 70% of the Worlds Poor
6 scenarios being played out today Increasing pressure for Land ownership reform Removal of collectivization Privatization of state-owned land Especially in formally communist and socialist countries 1978, China abandoned collectivism and assigned small plots to individual farmers farm output grew by more than 6% a year for each of the next 15 years! More than doubling their production rates began their economic boom!

35
Options for 70% of the Worlds Poor
Intensify cultivation to improve production Introduce more productive varieties of grain Work the land harder Continuous production / no fallow time Deteriorates the soil, causes erosion , reduces production Graze more animals in less space Over grazing causes desertification Land deterioration Food production per capita, in Africa, is in decline

36
Options for 70% of the Worlds Poor
3. Open up new land to farm Converting natural ecosystems to farms- loss of ecosystem contribution Often not land well suited to farming and requires irrigation Expensive and damages waterways Tropical deforestation Poor quality soil

37
Options for 70% of the Worlds Poor
4. Engage in illicit activities for $ Desperate people without food will do whatever they must to get it. Need vs Greed Poaching Wildlife Drug-related crops

38
Options for 70% of the Worlds Poor
5. Emigrate to other countries, illegally or legally Gap between high- and low-income countries People believe that they can better their life Aging wealthy countries attract young families Called Replacement Migration 175 million people live outside of their native countries! Problems Prejudice: western Europe takes only 50% of the immigrants compared to USA Refugee immigration: to escape war, Diseases, hunger and enslavement

39
Options for 70% of the Worlds Poor
6. Move to the cities for jobs Hundreds of millions of people 2000, 292 “million-plus” cities in Dev. Countries! Mega cities- 10 million plus By 2020 the urban population in these countries is expected to double to close to 4 billion people Problems Pop. Growth faster than economic growth(no Jobs) Challenge providing basic services Terrible streets, poor sanitation and drinking water, erratic power and phone and rapidly rising crime! Shanty towns on the rise Increasing disease (malnutrition, malaria, HIV/AIDS)
 Challenge providing basic services. Terrible streets, poor sanitation and drinking water, erratic power and phone and rapidly rising crime! Shanty towns on the rise. Increasing disease (malnutrition, malaria, HIV/AIDS)")
40
Consequences of Population Growth
Dilute the value of labor Workers can not earn enough to provide food < $1 or $2 a Day! Extreme poverty and jobless Environmental decline

41
Developing or Developed Nations?
High fertility rates High consumptive lifestyles: use 80% of world’s wealth Intense poverty Eat high on the food chain

42
Developing or Developed Nations?
Long doubling times High environmental degradation Twenty percent of the world’s population

43
Basic Human Needs Drinkable water Edible food Safe housing Health care
An education A job

44
Growing Cities

45
Consequences of Exploding Populations in the Developing World

46
Consequences of Exploding Populations
deforestation resource depletion loss of agricultural land biodiversity disease pest resistance population migration irrigation wetlands MORE More Population Causes LESS

47
Consequences of Affluence
High resource consumption Largest consumer of these major commodities: Aluminum, coffee, corn, copper, lead, oil, oilseed, natural gas, rubber, tin and zinc Lead consumption in meat 3-4X global consumption Most paper consumed: 725lb/person/year Unusually high environmental impact per person!

48
Consequences of Affluence
Positive effect on environment Safe drinking water Sanitary sewage treatment Good waste collection and disposal Pollution is held in check Not destroying forests Can afford conservation and management, Have better agricultural practices Environment improves with increasing affluence

49
The Dark Side of Affluence in the United States and Other Wealthy Countries
Lead in production of many pollutants CO2, 24% of worlds production (5% pop.) Huge consumption places stress on environment 86% of consumption and 80% of trade Exploitation of fisheries and cut of old growth forest Oil spills, exotic wood harvests, mining, oil extraction
 Huge consumption places stress on environment. 86% of consumption and 80% of trade. Exploitation of fisheries and cut of old growth forest. Oil spills, exotic wood harvests, mining, oil extraction.")
50
The Dark Side of Affluence in the United States and Other Wealthy Countries
Enables wealthy to clean up immediate environment by transferring waste to more distant locations Use resources of other countries Affluent isolate themselves and unaware of the environmental stresses caused by their consumptive lifestyles

51
Affluence Provides people with opportunity, choices, and the ability to preserve and protect!

52
Dynamics of Population Growth
Population profiles: shows number or proportion of people at each age in a given population Collected via census Future populations Population momentum The demographic transition

53
Population Profile United States

54
Population Profile United States

55
Population Profile United States

57
This rate now hovers about the replacement rate!
US Fertility Rate This rate now hovers about the replacement rate!

58
Population Profile of Italy

59
Population Profile Italy

60
Very low birth rates!

61
Population Projections United States
Increased fertility rate of 2.0 and current migration Fertility rate of 1.8

62
Population Profile Developing Country

63
Population Profile Developing Country Based on assumption of fertility rate reduction from 4.8 to 2.7 by 2025

64
Population Momentum Effect of current age structures on future population growth Determined by percent of population in younger versus older age cohorts

65
Population Momentum It will take countries with a large base of younger population a long time to achieve stability. Countries like Iraq will continue to grow for years even after the total fertility rate is reduced to replacement level.

68
Calculating Fertility Rates and Doubling Times Crude Birth Rates (CBR) Crude Death Rate (CDR)
(CBR - CDR)/10 = Rate of Increase or decrease in population per 1000 per year 70/ Rate of Increase = Doubling Time
/10 = Rate of Increase or decrease. in population per 1000 per year. 70/ Rate of Increase = Doubling Time.")
71
Phases of Demographic Transition
Phase I: primitive stability (CBR = CDR) Phase II: declining CDR, CBR remains high accelerating population growth Phase III: declining (CBR) fertility rate, but significant population growth continues Phase IV: modern stability with low CBR and CDR
 Phase II: declining CDR, CBR remains high accelerating population growth. Phase III: declining (CBR) fertility rate, but significant population growth continues. Phase IV: modern stability with low CBR and CDR.")
72
Demographic Transition Comparisons (Figure 5-17) Pg 138
Phase IV: developed countries Phases II and III: developing countries

73
In the Year 2000 65 out of 117 countries will not be able to feed their own people One billion people will be living in cities that cannot support their inhabitants 400 million more women will be in need of child spacing services

74
In the Year 2000 (continued)
600 million new jobs will need to be created for new entrants into the workforce We will need twice as much fresh water 300 million additional children will need teachers, books, and classrooms nature's way.wmv

Similar presentations