Download presentation
Presentation is loading. Please wait.

1
Population & Environment II ES 118 Spring 2008

2
Life expectancy 20 th Century saw global transformation of human health 20 th Century saw global transformation of human health –Worldwide, average life expectancy rose from 40 to 65.5 years (projected to reach 74 by 2050) –In India in 1900, average life expectancy around 23 years; by 2000 this had tripled –In US increased from 47 to 77 years
 –In India in 1900, average life expectancy around 23 years; by 2000 this had tripled –In US increased from 47 to 77 years")
3
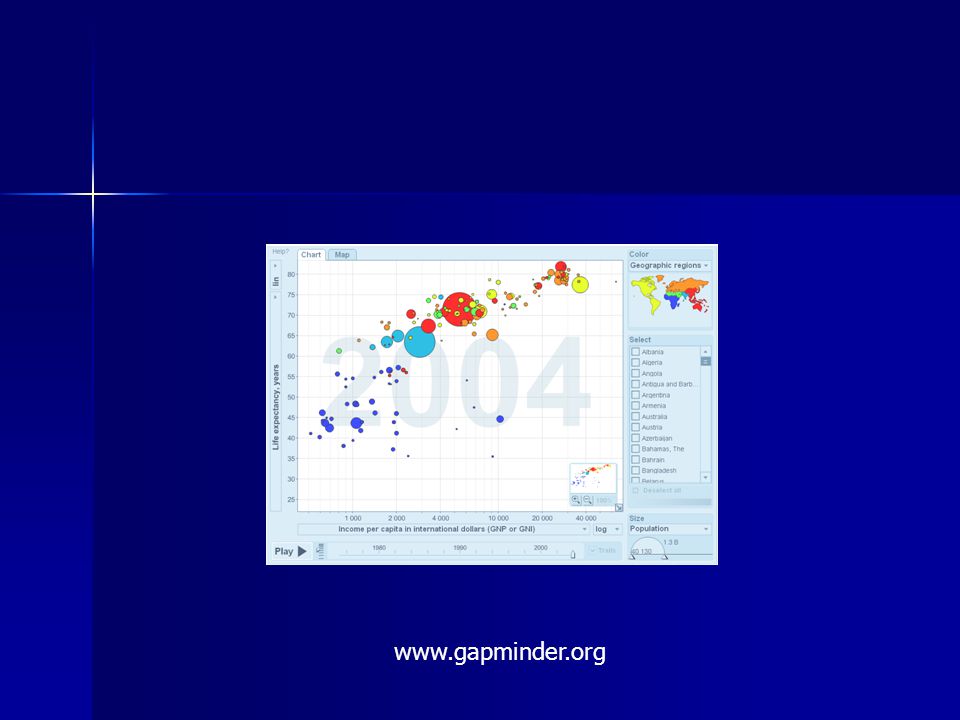
Life expectancy Factors influencing include: Factors influencing include: –Better nutrition –Improved sanitation –Clean water –Education –Access to health and medical services Strongly correlated with income to about $4,000/person, then level out at about 75 years for men and 85 for women Strongly correlated with income to about $4,000/person, then level out at about 75 years for men and 85 for women

4
www.gapminder.org
5
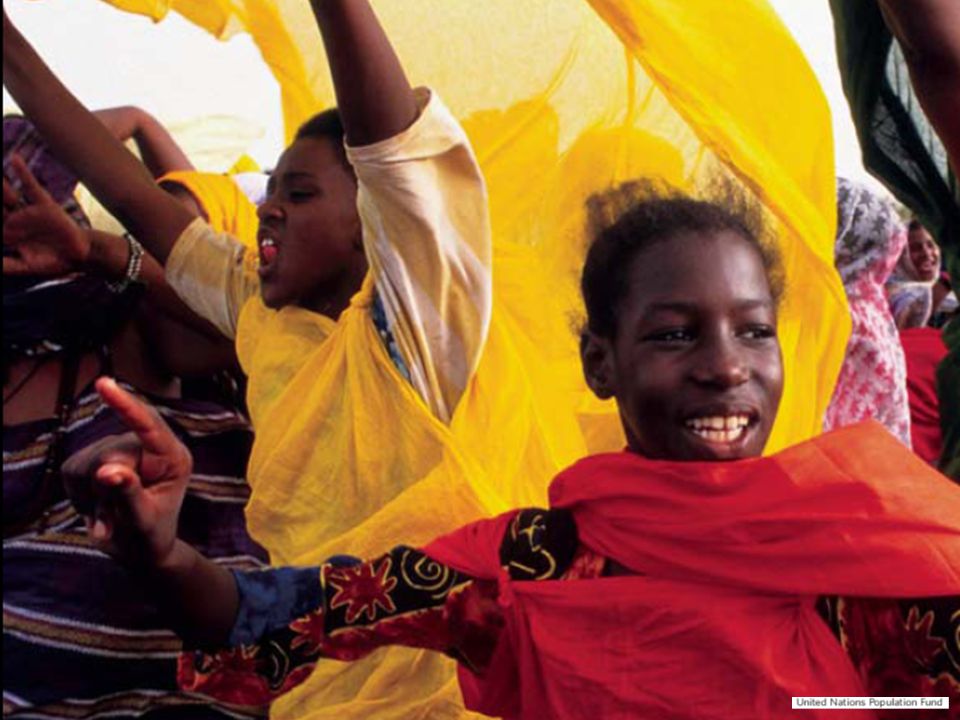
Contraceptive revolution For many, the concept of planning the number and timing of their children revolutionary For many, the concept of planning the number and timing of their children revolutionary By 2000, more than half of the world’s women of reproductive age using a modern family planning method By 2000, more than half of the world’s women of reproductive age using a modern family planning method Early attempts to influence fertility focused on smaller family size and family planning Early attempts to influence fertility focused on smaller family size and family planning

6
…but access still limited ½ billion people live in countries where <10% of women use an effective contraception ½ billion people live in countries where <10% of women use an effective contraception –Largely rural and agriculture-based –Low per capita income –Economic crises –Waning international support Examples: Nigeria (8%), Afghanistan, Ethiopia, Mali, Democratic Republic of Congo Examples: Nigeria (8%), Afghanistan, Ethiopia, Mali, Democratic Republic of Congo
, Afghanistan, Ethiopia, Mali, Democratic Republic of Congo Examples: Nigeria (8%), Afghanistan, Ethiopia, Mali, Democratic Republic of Congo")
7
Social and political factors influencing fertility Some countries used restrictive policies, penalizing families with “too many” children Some countries used restrictive policies, penalizing families with “too many” children Policy response shifting to broader issues (“social determinants of health”): Policy response shifting to broader issues (“social determinants of health”): –Maternal and child health –Recognition of importance of gender and links between poverty, gender roles, inequality, and health –Education, sanitation, transportation, clean water UN Millennium Goals target many of these issues UN Millennium Goals target many of these issues
: Policy response shifting to broader issues ( social determinants of health ): –Maternal and child health –Recognition of importance of gender and links between poverty, gender roles, inequality, and health –Education, sanitation, transportation, clean water UN Millennium Goals target many of these issues UN Millennium Goals target many of these issues")
8
Education Kerala, India Kerala, India –One of poorer states in India, but India's highest life expectancy and lowest infant mortality rates –High literacy rates, especially among women

9
www.gapminder.org

10
Mortality Rapid growth in world’s population in last century caused largely be decline in crude death rates Rapid growth in world’s population in last century caused largely be decline in crude death rates Time

11
Maternal health

12
HIV/AIDS Between 2000-2050, AIDS projected to cause premature deaths of 278 million people in 53 countries—38 in Africa

13
Malaria Why is Malaria getting worse? Why is Malaria getting worse? –Drug resistance –Environmental and social change (poverty, dams, irrigation, deforestation, war, lack of basic sanitation…) –Cost of control
 –Cost of control.")
14
Case Studies

15
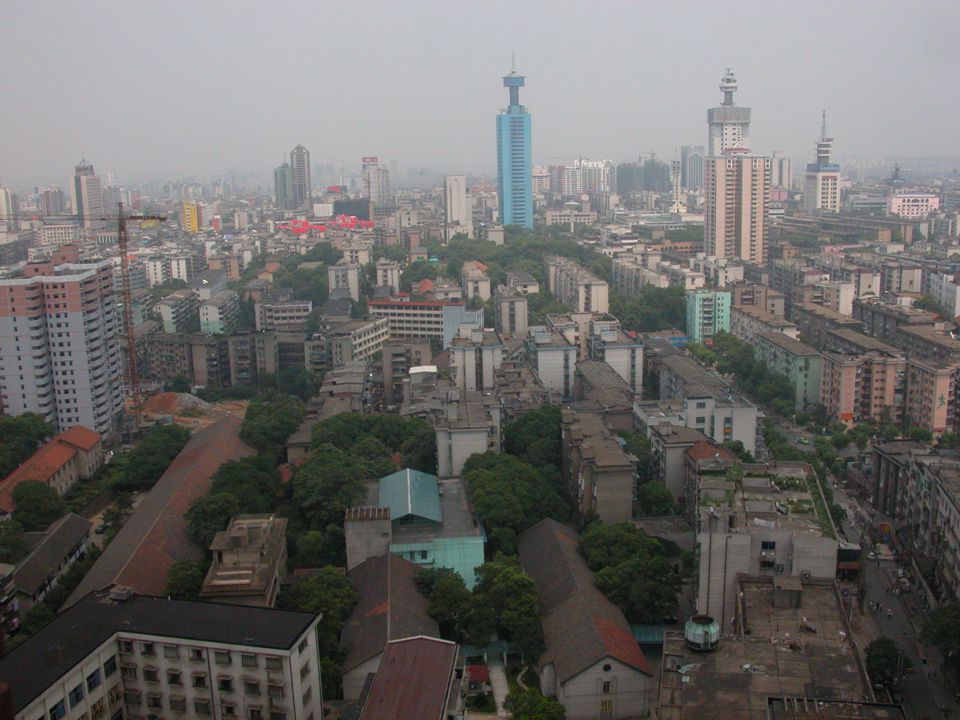
The case of cities We are now an urban planet We are now an urban planet –1900: 10% of global population –2008: >50% of world’s 6.6b people and growing

17
Growing cities By 2030,~ 5 billion people will live in cities By 2030,~ 5 billion people will live in cities More than 95% of net increase in the global population will be in cities in developing world, mostly in Asia More than 95% of net increase in the global population will be in cities in developing world, mostly in Asia Largest “mega-cities” are growing to unprecedented sizes, but most do not live in mega-cities Largest “mega-cities” are growing to unprecedented sizes, but most do not live in mega-cities

18
R. Mace Science 319, 764 -766 (2008)
")
19
Environmental impact of cities Hot spots of production, consumption, and waste generation Hot spots of production, consumption, and waste generation <3% of land surface but <3% of land surface but –78% of global carbon emissions –60% of residential water use –76% of wood for industrial purposes –Huge “ecological footprints” Cities thus present both problems and solutions to sustainability challenges in an increasingly urban world Cities thus present both problems and solutions to sustainability challenges in an increasingly urban world

20
The case of Asia Pace of economic change in India and China is breathtaking Pace of economic change in India and China is breathtaking –Fastest growing middle-classes in the world These two countries will have a profound impact on the world’s environment These two countries will have a profound impact on the world’s environment

22
China China’s economy has averaged a 9.5% growth rate China’s economy has averaged a 9.5% growth rate Approximately 80% of Wal-Mart’s suppliers are now located in China Approximately 80% of Wal-Mart’s suppliers are now located in China China is starting to build one of the world’s largest automobile industries China is starting to build one of the world’s largest automobile industries

23
http://www.earth-policy.org/Updates/Update45_data.htm Steel consumption US and China 1990- 2003

24
http://www.earth-policy.org/Updates/Update45_data.htm Meat consumption US and China 1960- 2004

25
The Challenge of Food People in poor countries typically eat at lower trophic levels than rich countries People in poor countries typically eat at lower trophic levels than rich countries –90% of energy of plants lost when converted to protein from animals People in countries like US eat too much (“overnutrition”) People in countries like US eat too much (“overnutrition”) –50% of North Americans overweight –25% obese –Ecological impact of 1 person eating at carnivore level = 10 people living at herbivore level What happens as countries like China become wealthier and want more meat? What happens as countries like China become wealthier and want more meat?

26
Environmental impact Extreme pollution Extreme pollution –16 of 20 cities in the world with most polluted air in China Access to resources Access to resources –China: Just 8% of world’s fresh water for 22% of world’s population –India: 17% of world’s population and 2.3% of land resources

28
The Future Lessons of last ½ Century have shown that countries can undergo rapid and radical social and demographic change Lessons of last ½ Century have shown that countries can undergo rapid and radical social and demographic change –Fertility rates can drop from 7 to 2 children in less than 2 generations –Birth rate remains single most potent determinant of global population growth –We know much more, but prediction difficult

29
How many people?

30
Key questions for future Can the world provide an adequate standard of living for 2.5 billion more people without causing widespread environmental damage? Can the world provide an adequate standard of living for 2.5 billion more people without causing widespread environmental damage? How do we address increased: How do we address increased: –Waste –Pollution –Competition with other organisms for space –Energy and climate change What is the earth’s carrying capacity? What is the earth’s carrying capacity?

Similar presentations