Download presentation
Presentation is loading. Please wait.

1
ChapterChapter 5 The Human Population Copyright © 2008 Pearson Prentice Hall, Inc. Environmental Science Tenth Edition Richard T. Wright

2
Current world PopulationCurrent Current US populationCurrent

3
Human Population Growth and the Consequences Human population expansion and its cause Different worlds Consequences of population growth and affluence Dynamics of population growth Students will be able to discuss and show mastery on the above topics

4
Human Population Expansion and Its Cause Reasons for the patterns of growth –Biotic potential exceeds environmental resistance: birth rates exceed death rates There are 7 billion people on Earth If each one stood up, pronounced their name and sat down –It would take 600 years to complete roll call –By 2025 it will take 1,000 years to complete this exercise

5
World Population Over the Centuries 9,000 human beings added to the planet every hour

6
Modeling Population Growth Human Population Growth and Regulation

7
Modeling Population Growth Human Population Growth and Regulation

8
Modeling Population Growth Human Population Growth and Regulation

9
Modeling Population Growth Human Population Growth and Regulation

10
Reasons for the Human Population Explosion Causes of disease recognized Improvements in nutrition Discovery of antibiotics Improvements in medicine Increase in number of women who actually reach child-bearing age Short doubling times in some countries

11
Modeling Population Growth Human Population Growth and Regulation

12
Changing Human Survivorship Curves: Went from B to A % Survival Age BirthDeath A B

13
World Population Growth and Absolute Growth

15
Population Projections Based on Different Fertility Assumptions Maintain fertility rate of 2.6 children/woman Gradual decline in fertility in developing countries. 2.02 children/woman ½ child lower than medium projection ½ child higher than medium projection

16
Average Number of Children, Grandchildren, and Great Grandchildren America West Germany Africa –14 –5–5 –258

17
Different Worlds Rich nations, poor nations Population growth in rich and poor nations Different populations, different problems

18
Major Economic Divisions of the World Gross national income/capita

19
Economic Categories Based on Per Capita Gross National Income (see Fig. 5-4) High-income, highly developed, industrialized countries –United States, Japan, Canada –Average GNI per capita = $50,666 Middle-income, moderately developed countries –Latin America, South Africa, China –Average GNI per capita = $6,000
 High-income, highly developed, industrialized countries –United States, Japan, Canada –Average GNI per capita = $50,666 Middle-income, moderately developed countries –Latin America, South Africa, China –Average GNI per capita = $6,000.")
20
Economic Categories Based on Per Capita Gross National Income (see Fig. 5-4) Low-income, developing countries –Western and central Africa, India, central Asia –Average GNI per capita = $454
 Low-income, developing countries –Western and central Africa, India, central Asia –Average GNI per capita = $454.")
21
Disparities Developed countries –15% of the world’s population –Control 80% of the world’s wealth Low-income developing countries –37% of the world’s population –Control 3.0% of the world’s gross national income Difference in per capita income: 63 to 1!

22
Tragedy of the commons http://www.youtube.com/watch?v=ptLQSz dNNd8http://www.youtube.com/watch?v=ptLQSz dNNd8 http://www.youtube.com/watch?v=B6RyB HG51VQhttp://www.youtube.com/watch?v=B6RyB HG51VQ

23
Dimensions of the Human Poverty Index

24
Different Populations, Different Problems IPAT Formula: calculates human pressure on the environment (I = P x A x T)IPAT Formula –I = environmental impact –P = population –A = affluence and consumptive patterns –T = level of technology in the society
IPAT Formula –I = environmental impact –P = population –A = affluence and consumptive patterns –T = level of technology in the society")
25
Different Populations, Different Problems Environmental impact of developing countries due to “P.” Environmental impact of developed countries due to “A” and “T.” –Both have some measure of “I” for different reasons. –Average American places at least 20 times the demand on Earth’s resources compared to a person in Bangladesh.

26
Different Populations, Different Problems How does stewardship (S) affect the IPAT formula? –S = wildlife conservation, pollution control, energy conservation, and recycling I = P x A x T S

27
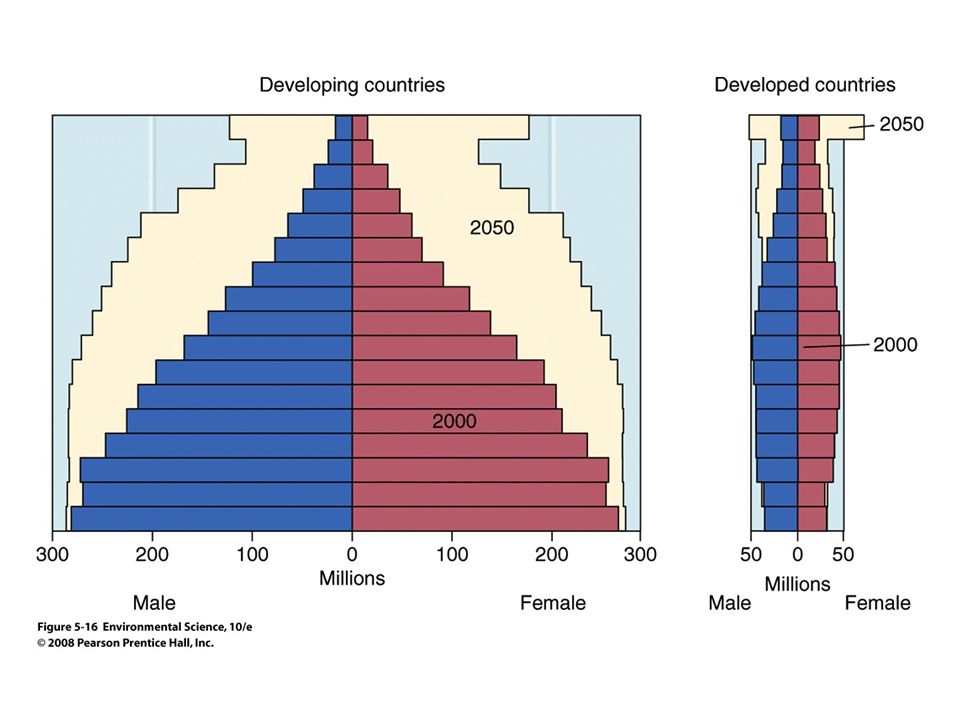
Population Increase in Developed and Developing Countries

28
Population Data for Selected Countries (Table 5-2) CountryTotal Fertility Rate Doubling Times (Years) World2.758 Developing Countries 2.947 Developed Countries 1.6700
 CountryTotal Fertility Rate Doubling Times (Years) World2.758 Developing Countries Developed Countries")
29
Different Populations, Different Problems Human pressure on the environment caused by three factors –Population size –Affluence –Technology

30
Global Conditions for a Sustainable Population Lower fertility rates (stabilize population) Consumption must decrease Protect the environment (stewardly action must increase
 Consumption must decrease Protect the environment (stewardly action must increase")
31
Consequences of Population Growth and Affluence The developing countries Affluence

32
Developing or Developed Nations? High fertility rates High consumptive lifestyles: use 80% of world’s wealth Intense poverty Eat high on the food chain

33
Developing or Developed Nations? Long doubling times High environmental degradation Twenty percent of the world’s population

34
Basic Human Needs Drinkable water Edible food Safe housing Health care An education A job

35
The Developing Countries Reform the system of land ownership Intensify cultivation of existing land to increase production per unit area Open new land to farm Move to cities and seek employment Engage in illicit activities for income Move to other countries How do these “solutions” aggravate the problems?

36
Growing Cities

37
Consequences of Exploding Populations in the Developing World

38
Consequences of Exploding Populations More Population Causes MORE LESS deforestation resource depletion loss of agricultural land biodiversity disease pest resistance population migration irrigation wetlands

39
Affluence in the United States Consume the largest share of 11 or 20 major commodities Eat more than three times the global average in meat Lead the world in paper consumption Environment improves with increasing affluence

40
Affluence in the United States Enables wealthy to clean up immediate environment by transferring waste to more distant locations Affluent isolate themselves and unaware of the environmental stresses caused by their consumptive lifestyles

41
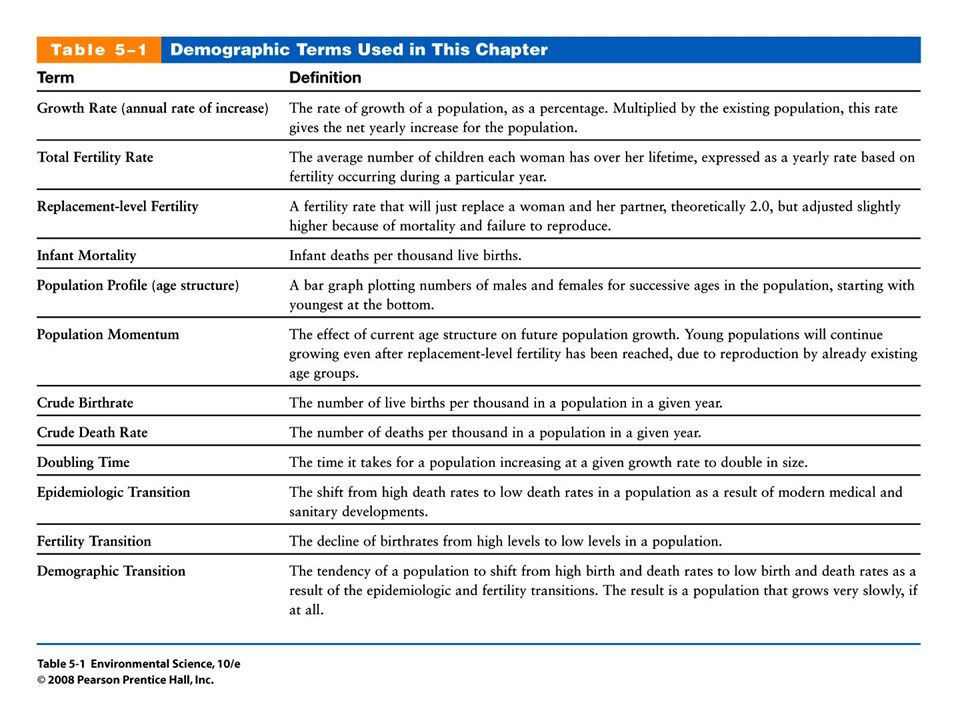
Dynamics of Population Growth Population profiles Future populations Population momentum The demographic transition http://www.youtube.com/watch?v=c6pcRR 5Uy6whttp://www.youtube.com/watch?v=c6pcRR 5Uy6w rule of 70

42
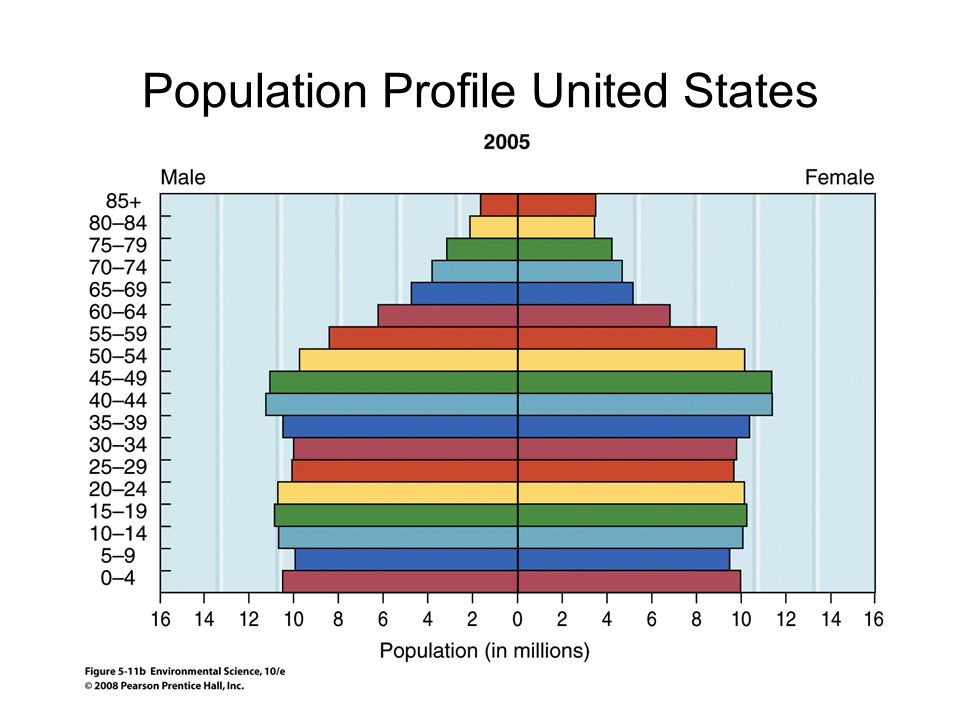
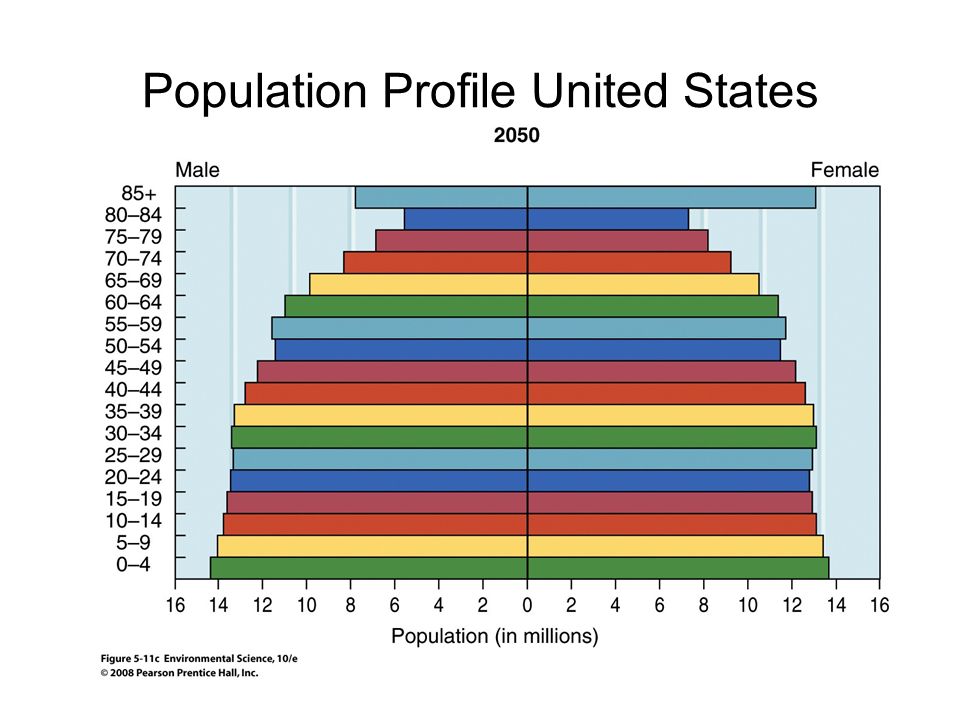
Population Profile United States

46
Population Profile of Italy

47
Population Profile Italy

48
Population Projections United States Increased fertility rate of 2.0 and current migration Fertility rate of 1.8

49
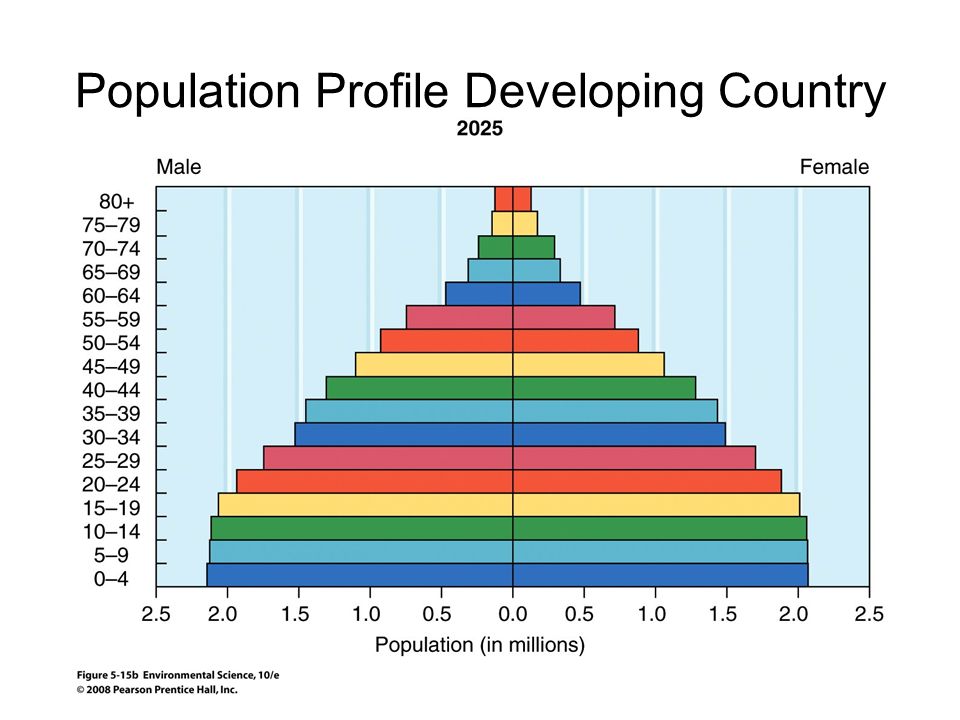
Population Profile Developing Country

51
Population Momentum Effect of current age structures on future population growth Determined by percent of population in younger versus older age cohorts

52
Population Momentum It will take countries with a large base of younger population a long time to achieve stability. Countries like Iraq will continue to grow for 50-60 years even after the total fertility rate is reduced to replacement level.

55
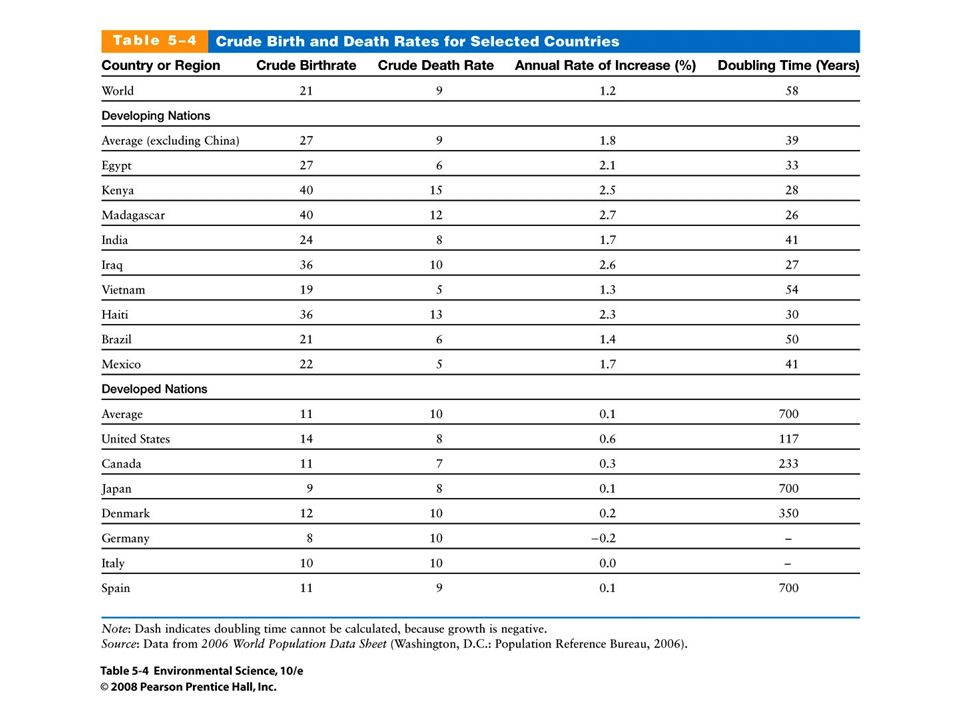
Calculating Fertility Rates and Doubling Times (CBR - CDR)/10 = Rate of Increase or decrease in population per 1000 per year 70/ Rate of Increase = Doubling TimeRate
/10 = Rate of Increase or decrease in population per 1000 per year 70/ Rate of Increase = Doubling TimeRate")
58
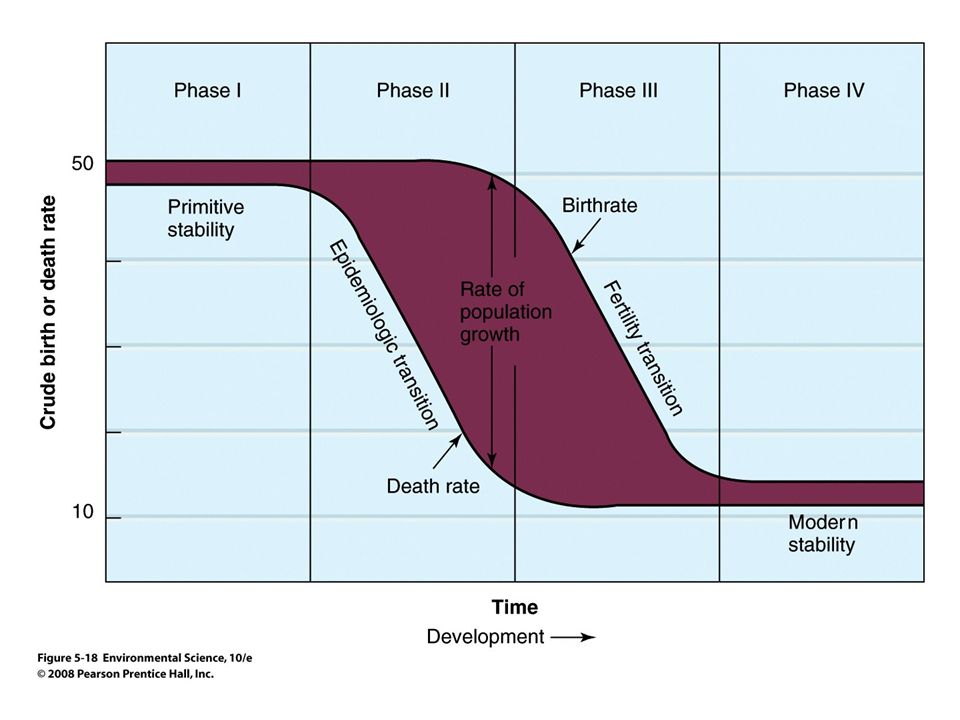
Phases of Demographic Transition Phase I: primitive stability (CBR = CDR) Phase II: declining CDR, CBR remains high accelerating population growth Phase III: declining fertility rate, but significant population growth continues Phase IV: modern stability with low CBR and CDR
 Phase II: declining CDR, CBR remains high accelerating population growth Phase III: declining fertility rate, but significant population growth continues Phase IV: modern stability with low CBR and CDR")
59
Demographic Transition Comparisons (Figure 5-17) Phase IV: developed countries Phases II and III: developing countries
 Phase IV: developed countries Phases II and III: developing countries")
60
In the Year 2000 65 out of 117 countries will not be able to feed their own people One billion people will be living in cities that cannot support their inhabitants 400 million more women will be in need of child spacing services

61
In the Year 2000 (continued) 600 million new jobs will need to be created for new entrants into the workforce We will need twice as much fresh water 300 million additional children will need teachers, books, and classrooms nature's way.wmv
 600 million new jobs will need to be created for new entrants into the workforce We will need twice as much fresh water 300 million additional children will need teachers, books, and classrooms nature s way.wmv")
62
The World in Balance http://www.youtube.com/watch?v=6ANMP YYkkF0http://www.youtube.com/watch?v=6ANMP YYkkF0

63
End of Chapter 5 PPT by Clark E. Adams

Similar presentations