Download presentation
Presentation is loading. Please wait.

1
Unit 2

2
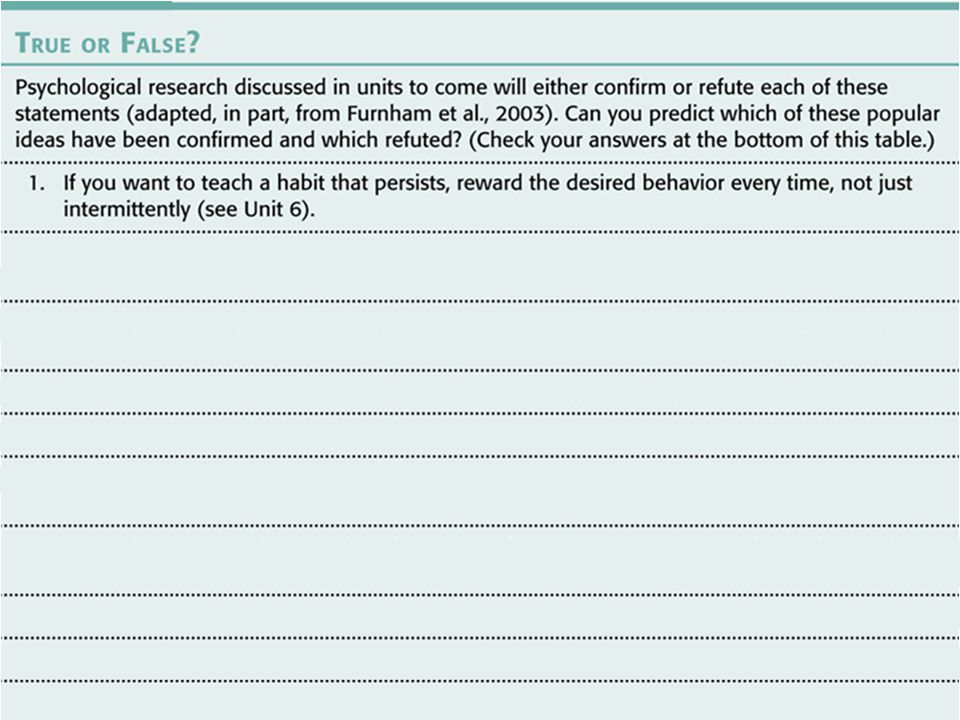
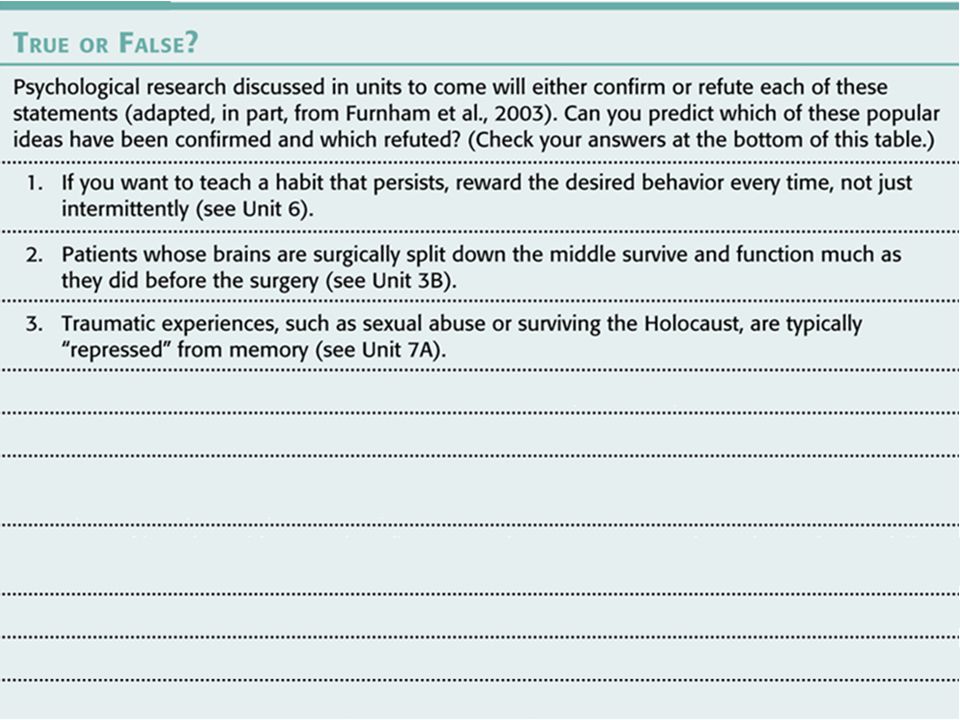
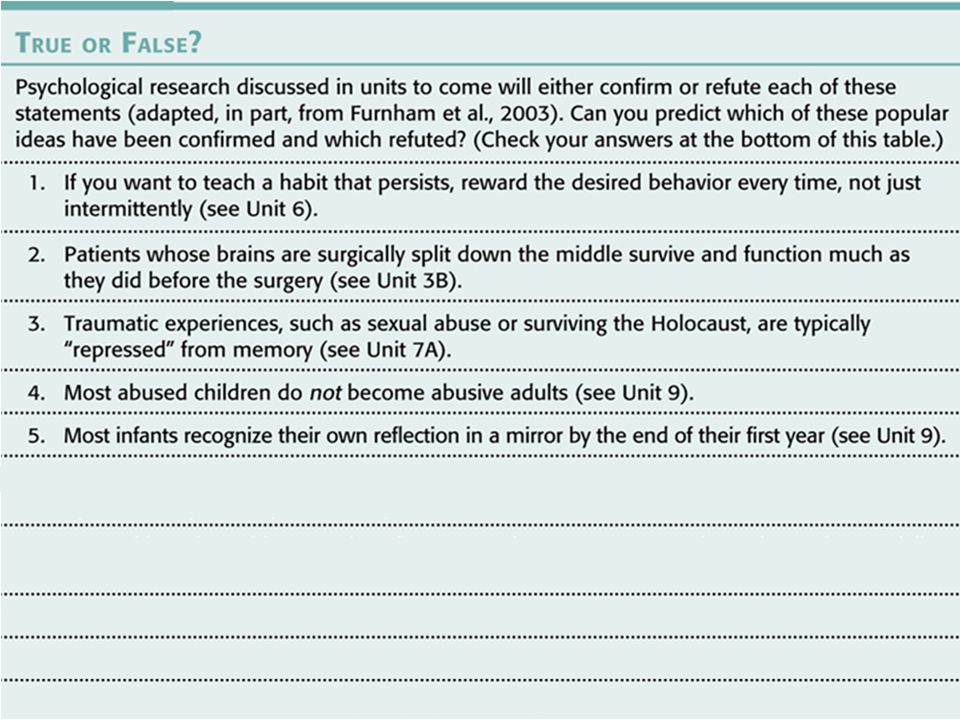
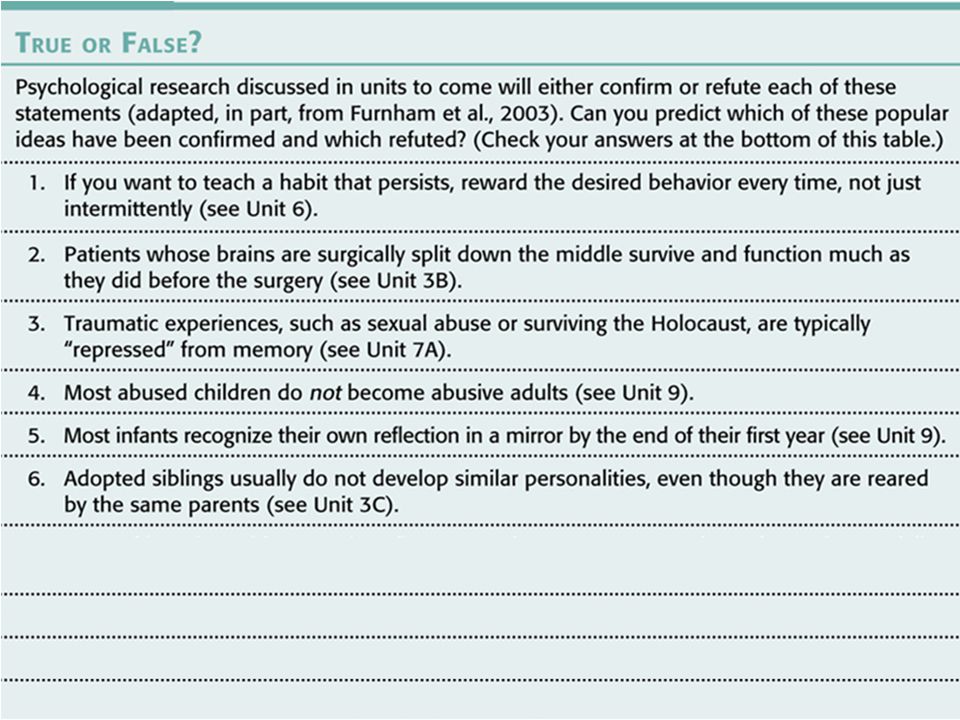
The need for Psychological Science How do psychologists ask and answer questions? Statistical reasoning in everyday life Frequently asked questions about psychology

4
Hindsight Bias “I knew it all along” “Out of sight, out of mind” “absence makes the heart grow fonder”

17
Overconfidence Together with hindsight bias, can lead to overestimate our intuition

18
Three main components Curious eagerness Skeptically scrutinize competing ideas Open-minded humility before nature

19
Critical thinking “smart thinking” Four elements Examines assumptions Discerns hidden values Evaluates evidence Assesses conclusions http://www.youtube.c om/watch?v=DTKGL5 9OkzI http://www.youtube.c om/watch?v=DTKGL5 9OkzI The Amazing Randi

21
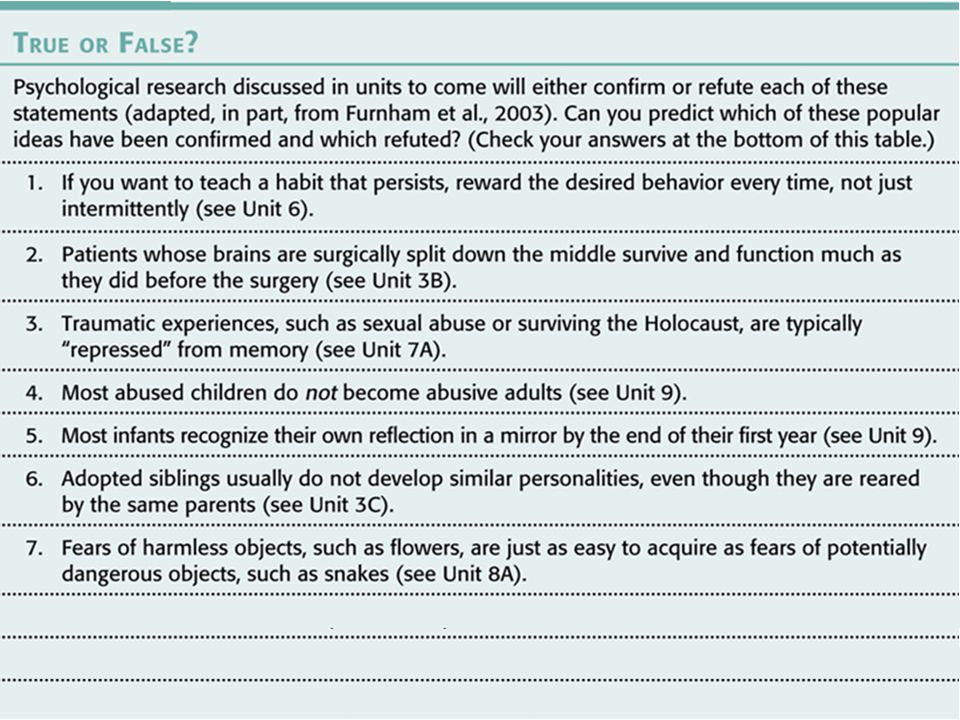
Theory “mere hunch” Hypothesis Can be confirmed or refuted Operational Definition Replication (repeat)
")
22
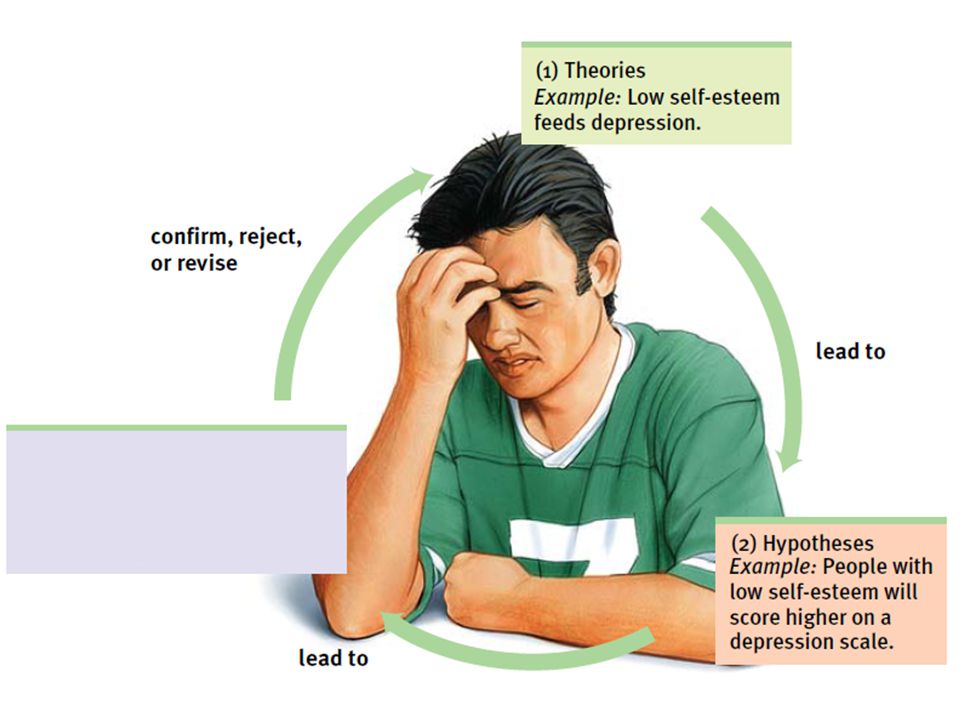
The Scientific Method

27
A good theory is useful if it: Effectively organizes a range of self-reports and observations Implies clear predictions that anyone can use to check the theory

28
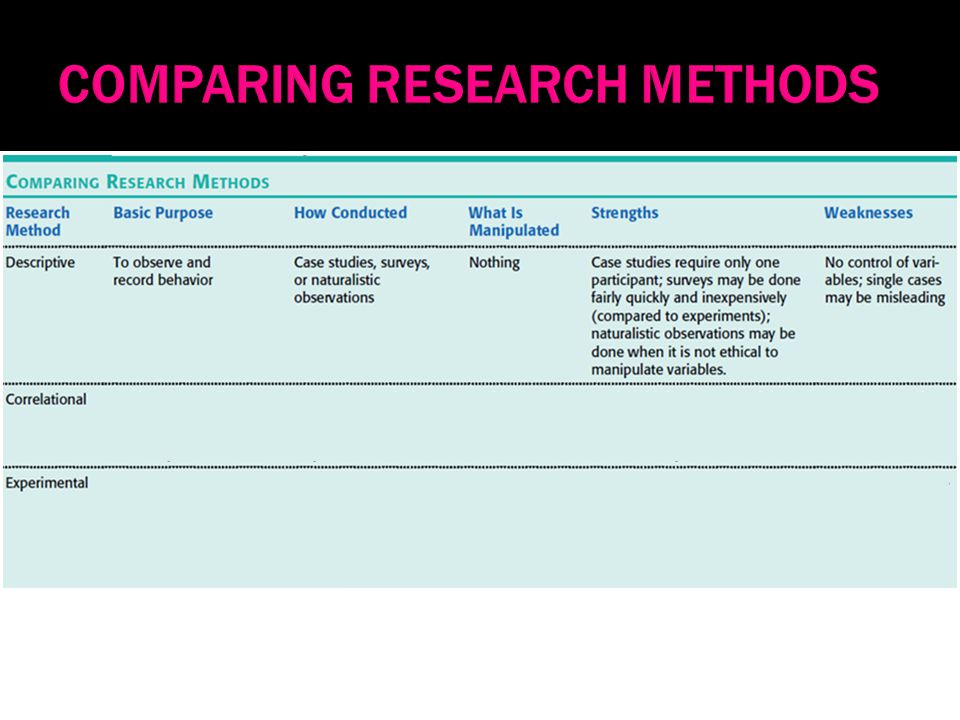
Case study Suggest further study Cannot discern general truths

29
Survey Looks at many cases at once Word effects Random sampling Representative sample

30
Sampling Population Random sampling Stratified sampling Allows researcher to ensure sample represents the population on some criteria

31
Naturalistic observation Describes behavior Does not explain behavior

32
Naturalistic observation Careful, usually prolonged observation of behavior without direct intervention Pace of Life in 31 countries: (Levine and Norenzayan) http://jcc.sagepub.com/content/30/2/178.abstract Three indicators of pace of life were observed: average walking speed in downtown locations, the speed with which postal clerks completed a simple request (work speed), and the accuracy of public clocks -In the main downtown area of each city, they had to find two flat, unobstructed, uncrowded 60-foot walkways where they could unobstrusively time pedestrians during normal business hours. Only adult pedestrians walking alone and not window shopping were timed. It was done until 35 men and women had been timed.

33
RankCountryRankCountryRankCountry 1Switzerland10Hong Kong19Hungary 2Ireland11France20Czech Repub. 3Germany12Poland21Greece 4Japan13Costa Rica22Kenya 5Italy14Taiwan23China 6England15Singapore24 25 Bulgaria Romania 7Sweden16United States26 27 Jordan Syria 8Austria17Canada28 29 El Salvador Brazil 9Netherlands18South Korea30 31 Indonesia Mexico

34
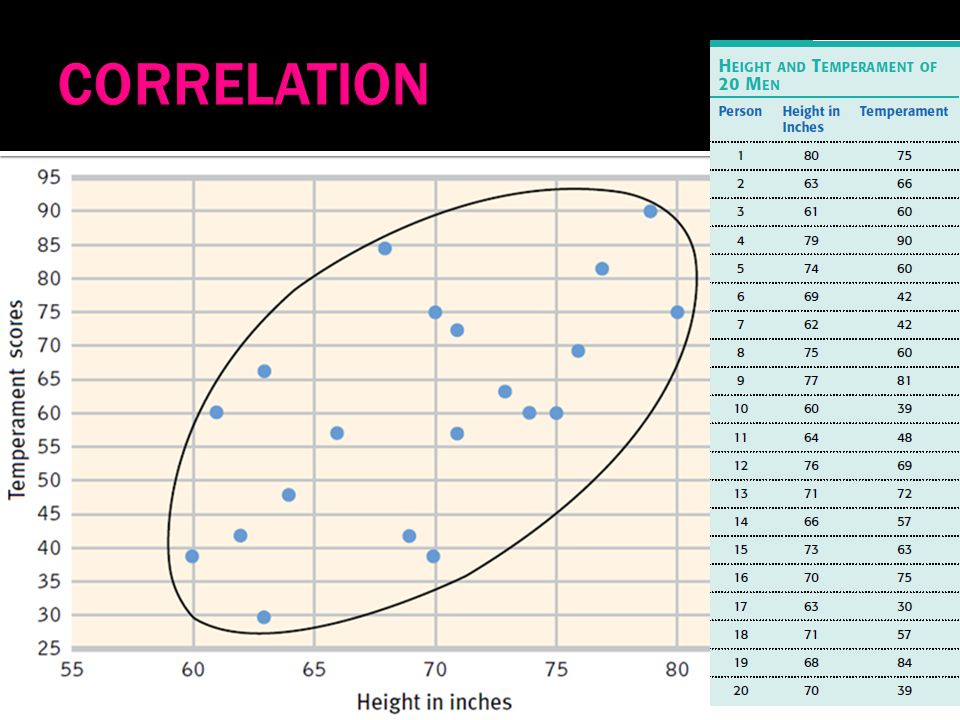
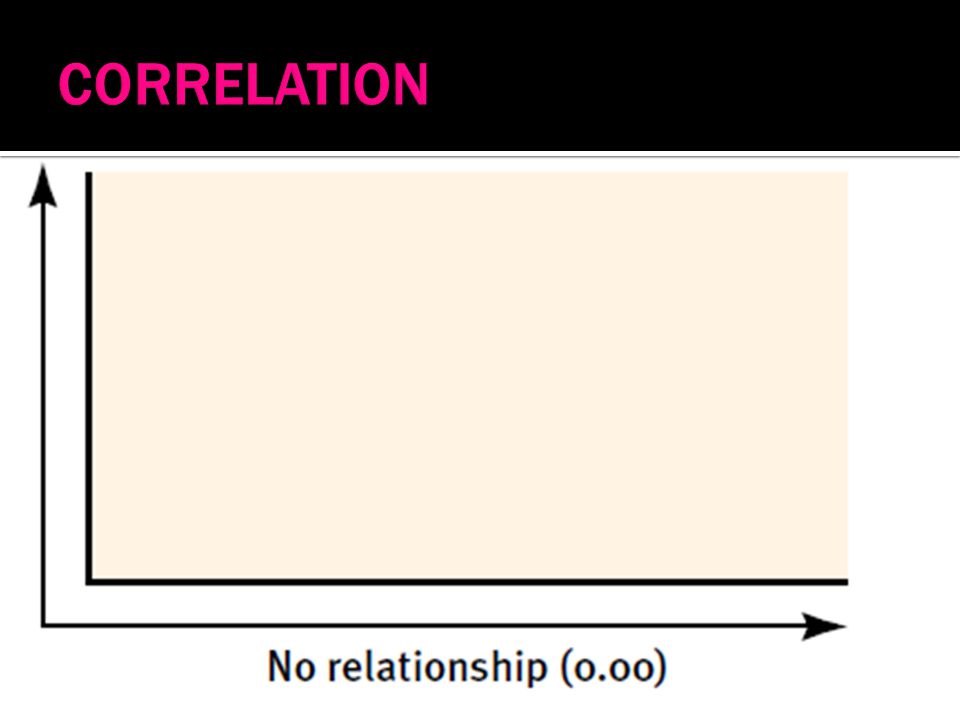
Correlation Correlation coefficient How well does A predict B? Positive versus negative correlation Height and weight (+) Exercise and weight (-) Strength of the correlation -1.0 to +1.0 Weak correlation =0 Scatterplot
 Exercise and weight (-) Strength of the correlation -1.0 to +1.0 Weak correlation =0 Scatterplot.")
35
The more young children watch TV, the less they read The more sexual content teens see on TV, the more likely they are to have sex The longer children are breast-fed, the greater their later academic achievement The more adolescents eat breakfast, the lower their body mass

45
Correlation helps predict Does not imply cause and effect

50
Illusory correlation Perceived non-existent correlation A random coincidence

51
Comes from our need to make sense of our world Coin flip Poker hand

52
Experiment Can isolate cause and effect Control of factors Manipulation of factor(s) of interest Hold constant (“controlling”) factors
 of interest Hold constant ( controlling ) factors")
53
Random assignment Eliminates alternative explanations Different from random sample

54
Blind (uninformed) Single-blind procedure Double-blind procedure Placebo effect Experimenter bias Participant bias (response bias) Tendency for subjects to behave in certain ways based on their perception of the experiment
 Single-blind procedure Double-blind procedure Placebo effect Experimenter bias Participant bias (response bias) Tendency for subjects to behave in certain ways based on their perception of the experiment")
55
Groups Hawthorne Effect Being selected to be in a group of people to participate in an experiment will affect the performance of that group regardless of what is done to those individuals Experimental group Receives the treatment (independent variable) Control group Does not receive the treatment
 Control group Does not receive the treatment")
56
Independent variable Confounding variable effect of random assignment on confounding variables Dependent variable What is being measured?

57
Hypothesis: an educated guess Variables: factors that are measured or controlled in a scientific study Independent variable: factor that researchers manipulate so that they can determine its effect (IF) Dependent variable: depends on the independent variable. It is the result of change in the independent variable (THEN) WARM TEMPERATURE CAUSES AGGRESSION IN HUMANS =
 WARM TEMPERATURE CAUSES AGGRESSION IN HUMANS =.")
58
Placebo: an inert substance used in controlled experiments to test the effectiveness of another substance Double-blind study: a research strategy in which neither subjects nor experimenters know which subjects are in the experimental or control group Placebo effect: any effect that seems to be a consequence of administering a placebo; the change is usually beneficial and is assumed result from the person’s faith in the treatment or preconceptions about what the experimental drug was supposed to do

59
Manipulation of an independent variable under carefully controlled conditions to see whether any changes occur in the dependent variable Harlow’s monkey http://www.youtube.com/watch?v=_O60TYAIgC 4 http://www.youtube.com/watch?v=_O60TYAIgC 4

69
Mode (occurs the most) Mean (arithmetic average) Median (middle score)
 Mean (arithmetic average) Median (middle score)")
70
Range Standard deviation

71
Normal Curve (bell shaped)
")
72
Representative samples are better than biased samples Less-variable observations are more reliable than those that are more variable More cases are better than fewer Inferential statistics Statistics that can determine whether or not findings can be applied to the larger population from which the sample was selected

73
Statistical significance The averages are reliable The differences between averages is relatively large Does imply the importance of the results

74
Reliability when replicated when consistent If the researcher conducted the same research in the same way, the researcher would get similar results Validity Measures what the researcher set out to measure; it is accurate

76
Can laboratory experiments illuminate everyday life? The resulting principles, not the research findings, help explain behavior

77
Does behavior depend on one’s culture and gender? Culture Influence of culture on behavior Gender More similarities than differences

78
Ethics in animal research Clear scientific purpose Care for and house animals in a humane way Acquire animal subjects legally Design experimental procedures that employ the least amount of suffering feasible

79
Ethics in human research Informed consent Protect from harm and discomfort Maintain confidentiality debriefing

81
The tendency to believe, after learning an outcome, that one would have foreseen it Also known as the “I knew it all along” phenomenon

82
Thinking that does not blindly accept arguments and conclusions. Rather, it examines assumptions, discerns hidden values, evaluates evidence and assesses conclusions

83
An explanation using an integrated set of principles that organizes observations and predicts behaviors or events

84
A testable prediction, often implied by a theory

85
A statement of the procedures (operations) used to define research variables i.e. human intelligence may be operationally defined as what an intelligence test measures

86
Repeating the essence of a research study, usually with different participants in different situations, to see whether the basic finding extends to other participants and circumstances

87
An observation technique in which one person is studied in depth in the hope of revealing universal principles

88
A technique for ascertaining the self- reported attitudes or behaviors of a particular group, usually by questioning a representative, random sample of the group

89
All the cases in a group being studied, from which samples may be drawn Note: except for national studies, this does NOT refer to a country’s whole population

90
A sample that fairly represents a population because each member has an equal chance of inclusion

91
Observing and recording behavior in naturally occurring situations without trying to manipulate and control the situation

92
A measure of the extent to which two factors vary together, and thus of how well either factor predicts the other

93
A statistical index of the relationship between two things (from -1 to +1)
")
94
A graphed cluster of dots, each of which represents the values of two variables. The slope of the points suggests the direction of the relationship between the two variables. The amount of scatter suggests the strength of the correlation (little scatter indicates high correlation)
.")
95
The perception of a relationship where none exists

96
A research method in which an investigator manipulates one or more factors (independent variables) to observe the effect on some behavior or mental process (the dependent variable). By random assignment of participants, the experimenter aims to control other relevant factors

97
Assigning participants to experimental and control groups by chance, thus minimizing preexisting differences between those assigned to the different groups

98
An experimental procedure in which both the research participants and the research staff are ignorant (blind)
")
99
Experimental results caused by expectation alone; any effect on behavior caused by the administration of an inert substance or condition, which the recipient assumes is an active agent

100
In an experiment, the group that is exposed to the treatment, that is, to one version of the independent variable

101
In an experiment, the group that is NOT exposed to the treatment; contrasts with the experimental group and serves as a comparison for evaluating the effect of the treatment

102
The experimental factor that is manipulated; the variable whose effect is being studied

103
A factor other than the independent variable that might produce an effect in an experiment

104
The outcome factor; the variable that may change in response to manipulations of the independent variable

105
The most frequently occurring score(s) in a distribution
 in a distribution")
106
The arithmetic average of a distribution, obtained by adding the scores then dividing by the number of scores

107
The middle score in a distribution, half the scores are above it and half are below it

108
The difference between the highest and lowest score in a distribution

109
A computed measure of how much scores vary around the mean score

110
A symmetrical, bell-shaped curve that describes the distribution of many types of data; most scores fall near the mean (68 percent fall within one standard deviation of it) and fewer and fewer near the extremes
 and fewer and fewer near the extremes")
111
A statistical statement of how likely it is that an obtained result occurred by chance

112
The enduring behavior, ideas, attitudes, and traditions shared by a group of people and transmitted from one generation to the next

113
An ethical principle that research participants be told enough to enable them to choose whether they wish to participate

114
The postexperimental explanation of a study, including its purpose and any deception to its participants

Similar presentations


>")
>")
 Chapter 1 Thinking Critically with Psychological Science James A. McCubbin, PhD Clemson University Worth Publishers.>")

 Chapter 1 Thinking Critically with Psychological Science James A. McCubbin, PhD Clemson.>")


>")


