Download presentation
Presentation is loading. Please wait.

1
Human Geography: Population Why Is Population Increasing at Different Rates in Different Countries?

2
World Population Problems and Solutions

4
Population growth, resource consumption, and the environment the threat to the ecosystem is linked to human population size and resource use per person. Resource use, waste production environmental degradation are accelerated by population growth.

5
Indicators of severe environmental stress include: the growing loss of biodiversity, increasing greenhouse gas emissions, increasing deforestation worldwide, stratospheric ozone depletion, acid rain, loss of topsoil, and shortages of water, Shortages of food, Shortages of fuel-wood in many parts of the world.

6
Developed (rich industrialized), make up 23% of the worlds’ population, but use 85% of worlds’ resources
, make up 23% of the worlds’ population, but use 85% of worlds’ resources")
7
The Great Dilemma If all people of the world consumed fossil fuels and other natural resources at the current rate of the developed countries, this would intensify our already unsustainable demands on the environment. Yet development is a legitimate expectation of less developed countries

9
Population Key Terms Demography: the study of human populations; helps us understand the causes and consequences of population change

10
THE CENSUS -counting and collecting information about a population -in Canada a formal census is taken every 5 years

11
Reasons for Census inaccuracies: people who do not have permanent addresses, who live on the streets, or who choose to avoid the census. in some countries, many births and deaths go unrecorded. This may stem from poor communication networks as well as illiteracy.

12
Population Rates—Go figure! Crude Birth Rate (#of births in one year divided by population then multiplied by 1000) Crude Death Rate (#of deaths in one year divided by population then multiplied by 1000) Birth Rate – Death Rate + Net Migration = Population Growth Rate
 Crude Death Rate (#of deaths in one year divided by population then multiplied by 1000) Birth Rate – Death Rate + Net Migration = Population Growth Rate.")
14
Thomas Malthus Thomas Malthus believed that his nation (England) would not be able to produce enough food to keep up with its population growth rate. Limits to Population Growth

15
Malthus' Essay on Population Preventative checks to reduce the birth rate Moral restraint, and birth control (only for upper classes) Positive checks increased the death rate famine, misery, plague and war (for lower classes)
 Positive checks increased the death rate famine, misery, plague and war (for lower classes)")
16
Malthus’ belief is the background of the newer concept of “carrying capacity”. Carrying capacity refers to the level at which a land can no longer support its people (Nutritional density) Carrying Capacity
 Carrying Capacity.")
17
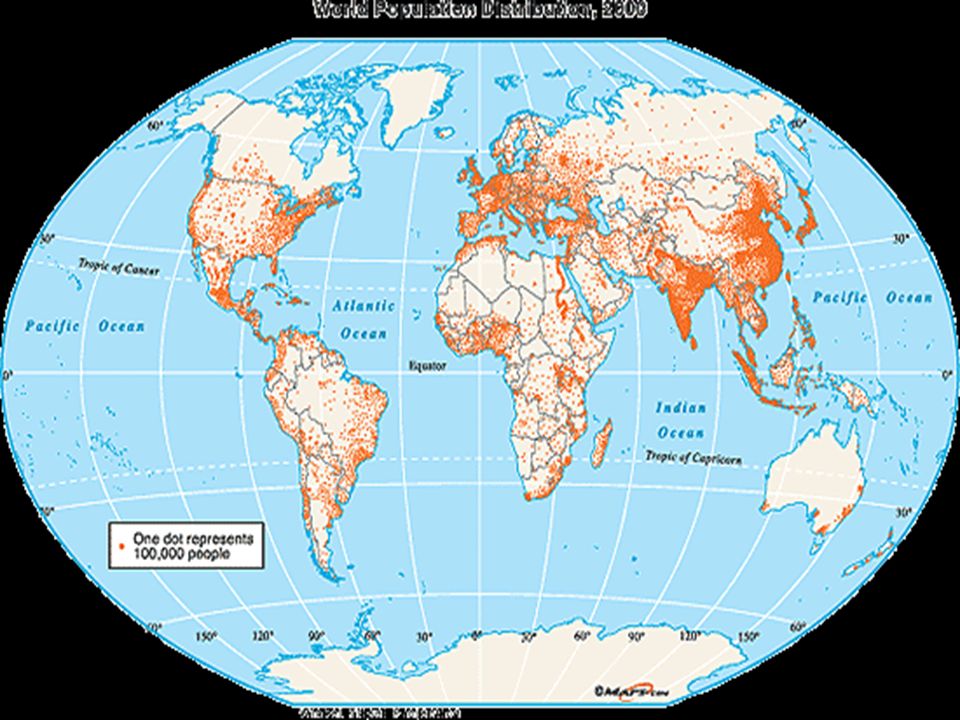
Where Do 6.5 Billion People Live? Population distribution 35 % of earth’s land is not good for settlement ½ of earth’s population live on 5% of land 90% live on 20% of land

20
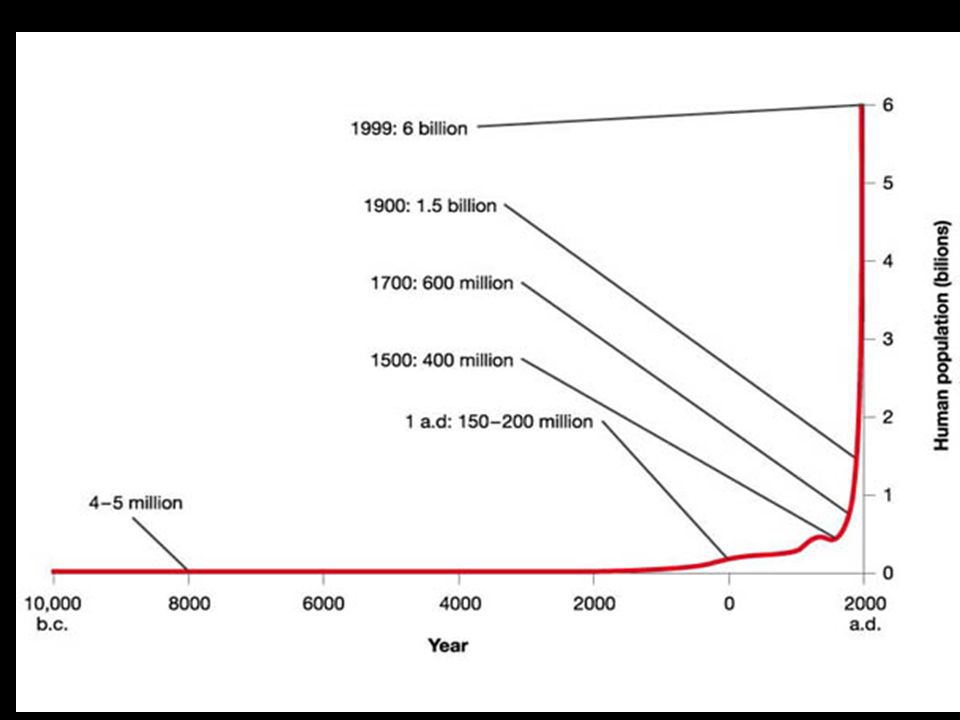
Graphing World Population

21
2 Types of Graphs 2 Types of graphs to track populations in a country: 1)The Demographic Transition 2) Population pyramids
The Demographic Transition 2) Population pyramids")
22
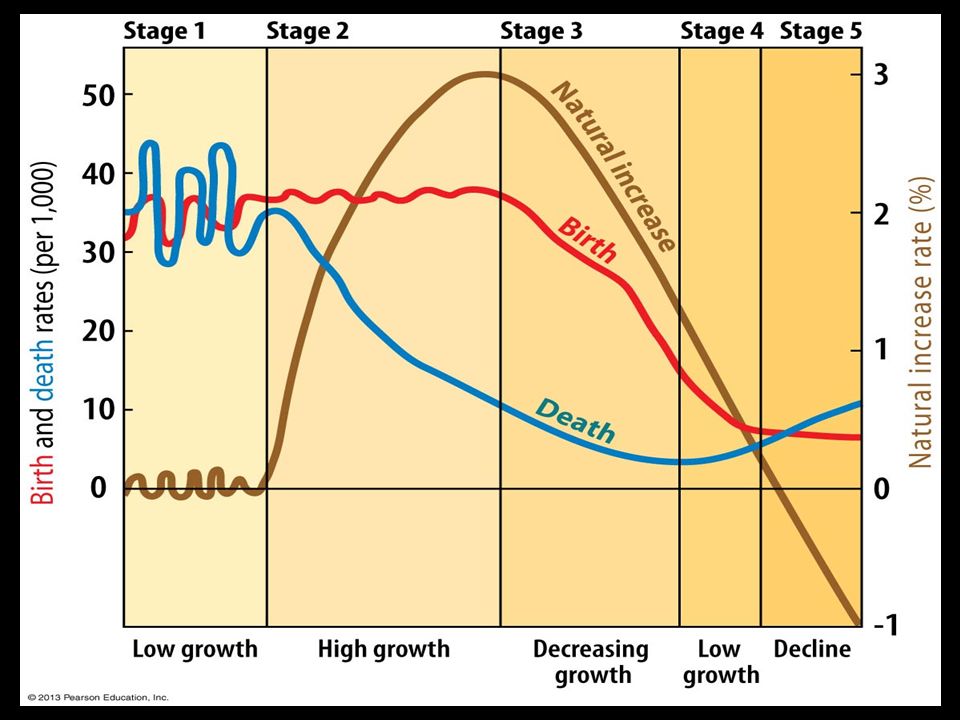
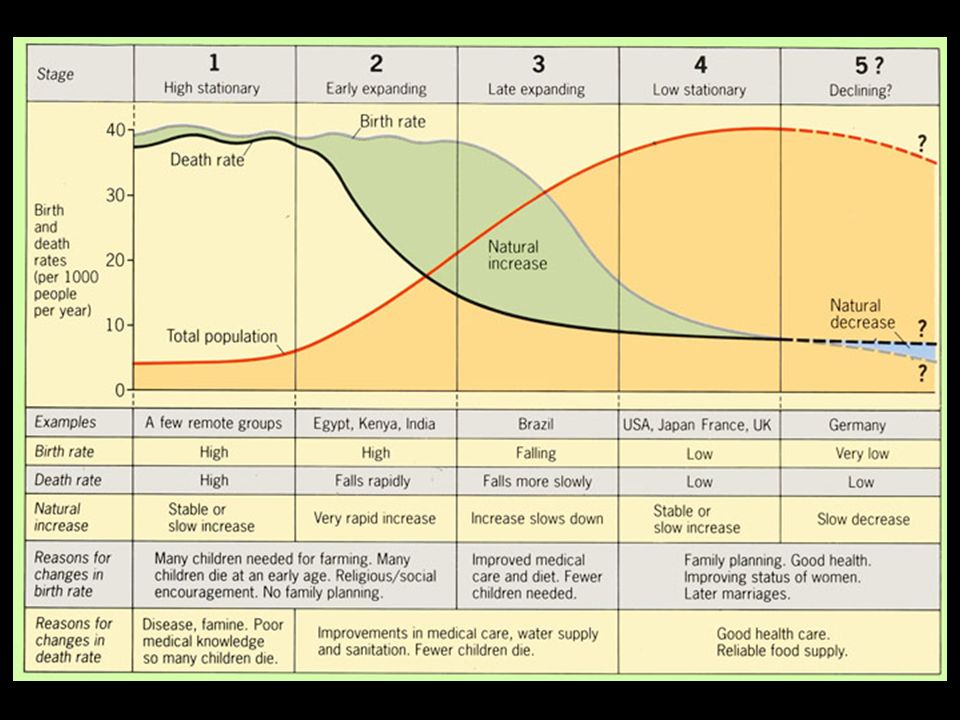
2 Types of Graphs 2 Types of graphs to track populations in a country: 1) The Demographic Transition –1. High Stationary– 3. Late Expanding –2. Early Expanding– 4. Low Stationary –5. Declining growth 2) Population pyramids –Age distribution –Sex ratio Shows countries in different stages of demographic transition Shows demographic transition and world population growth
 Population pyramids –Age distribution –Sex ratio Shows countries in different stages of demographic transition Shows demographic transition and world population growth.")
23
Demographic Transition Model

24
Stage 1 - High Stationary Birth Rate and Death rate are both high. Population growth is slow and fluctuating. Reasons Birth Rate is high as a result of: Lack of family planning High Infant Mortality Rate: putting babies in the 'bank' Need for workers in agriculture Religious beliefs Children as economic assets Death Rate is high because of: High levels of disease Famine Lack of clean water and sanitation Lack of health care War Competition for food from predators such as rats Lack of education Typical of Least Developed Countries (LEDC's) today.
 today..")
25
Demographic Transition Model

26
Stage 2 - Early Expanding Birth Rate remains high. Death Rate is falling. Population begins to rise steadily. Reasons Death Rate is falling as a result of: Improved health care (e.g. Smallpox Vaccine) Improved Hygiene (Water for drinking boiled) Improved sanitation Improved food production and storage Improved transport for food Decreased Infant Mortality Rates Typical of Britain in 19th century; Bangladesh; Nigeria
 Improved Hygiene (Water for drinking boiled) Improved sanitation Improved food production and storage Improved transport for food Decreased Infant Mortality Rates Typical of Britain in 19th century; Bangladesh; Nigeria.")
27
Demographic Transition Model

28
Stage 3 - Late Expanding Birth Rate starts to fall. Death Rate continues to fall. Population rising. Reasons: Family planning available Lower Infant Mortality Rate Increased mechanization reduces need for workers Increased standard of living Changing status of women Typical of Britain in late 19th and early 20th century; China; Brazil.

29
Demographic Transition Model

30
Stage 4 - Low Stationary Birth Rate and Death Rate both low. Population steady. – Economy is settled – Fully developed Middle Class – Political stability Typical of USA; Sweden; Japan; Britain

31
Demographic Transition Model

32
Stage 5? – Declining Population Theoretical Death Rate exceeds Birth Rate. Negative NIR Mostly Eastern European Countries – Russia – Belarus – Germany – Italy – Japan Many developed countries are predicted to experience population decline. –Factor of more elderly than young population in these countries –Fewer young women who will be entering their childbearing years

34
Population Pyramids

35
Population Pyramids = Graph that represents a population ’ s age and sex composition.

36
The most important demographic characteristic of a population is its age-sex structure. Population Pyramids graphically display this information to improve understanding of demographics. They display the percentage or actual amount of a population broken down by gender and age. The five-year age increments on the y-axis allow the pyramid to reflect long term trends in the birth and death rates but also reflect shorter term baby- booms, wars, and epidemics. Population Pyramid Overview

37
Population Pyramids The shape of a pyramid is primarily determined by the crude death rate in the community. Dependency ratio-the number of people who are too young or too old to work, compared to the number of people in their productive years. People who are 0-14 and 65-plus normally are classified as dependents. The “graying” of a population refers to the aging of a community. Population pyramids also foretell future problems from present population policies or practices. Ex. China ’ s population policies skewed in favor of males.

39
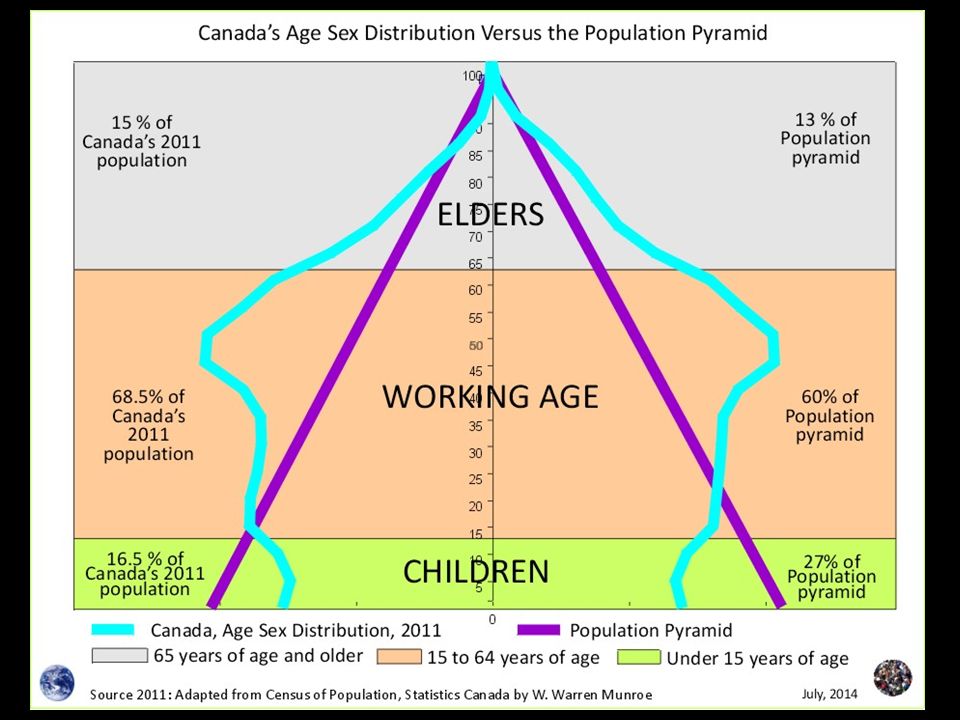
Number of people who are too young or too old to work, compared to the number of people in their productive years Indicates financial burden on a society’s productive population Dependency Ratio = measure of # of dependents – old and young that each 100 people in productive years (15 – 64) © 2013 Pearson Education, Inc. Dependency ratio

40
High Dependency Ratio

41
Sex Ratio The number of males per hundred females in the population is the sex ratio. In Europe and North America the ratio of men to women is about 95:100

42
There are three key types of population pyramids: Rapid Growth: This pyramid of the Philippines shows a triangle- shaped pyramid and reflects a high growth rate of about 2.1 percent annually.

43
There are three key types of population pyramids: Slow Growth: In the United States, the population is growing at a rate of about 1.7 percent annually. This growth rate is reflected in the more square-like structure of the pyramid. Note the lump in the pyramid between the ages of about 35 to 50.

44
In wealthy countries with very slow rate of population growth – population is nearly equally divided - so pyramids have Almost vertical sides. The % of a country ’ s population in each age group strongly influences demand for goods and services within that national economy. Country with high % of young has high demand for educational facilities and health delivery services.

45
There are three key types of population pyramids: Negative Growth: Germany is experiencing a period of negative growth (- 0.1%). As negative growth in a country continues, the population is reduced. A population can shrink due to a low birth rate and a stable death rate. Increased emigration may also be a contributor to a declining population.

46
Countries In Different Stages of Demographic Transition

47
Rapid Growth in Cape Verde Fig. 2-17: Cape Verde, which entered stage 2 of the demographic transition in about 1950, is experiencing rapid population growth. Its population history reflects the impacts of famines and out-migration.

48
Moderate Growth in Chile Fig. 2-18: Chile entered stage 2 of the demographic transition in the 1930s, and it entered stage 3 in the 1960s.

49
Low Growth in Denmark Fig. 2-19: Denmark has been in stage 4 of the demographic transition since the 1970s, with little population growth since then. Its population pyramid shows increasing numbers of elderly and few children.

50
2.5 The Demographic Transition © 2013 Pearson Education, Inc. POPULATION PYRAMID AND DEMOGRAPHIC TRANSITION FOR CAPE VERDE (LEFT), CHILE (CENTER), DENMARK (RIGHT)
, CHILE (CENTER), DENMARK (RIGHT).")
51
Demographic Transition and World Population Growth How many countries are in each of the following stages of the demographic transition? – Stage 1- None – Stage 2 and 3- majority of countries (i.e. Egypt, Kenya, India) – Stage 4- USA, Japan, France, UK – Stage 5 – Germany?
 – Stage 4- USA, Japan, France, UK – Stage 5 – Germany .")
Similar presentations


>")


 Thomas Malthus, Population Bomb?>")