Download presentation
Presentation is loading. Please wait.

1
The Demographic Transition
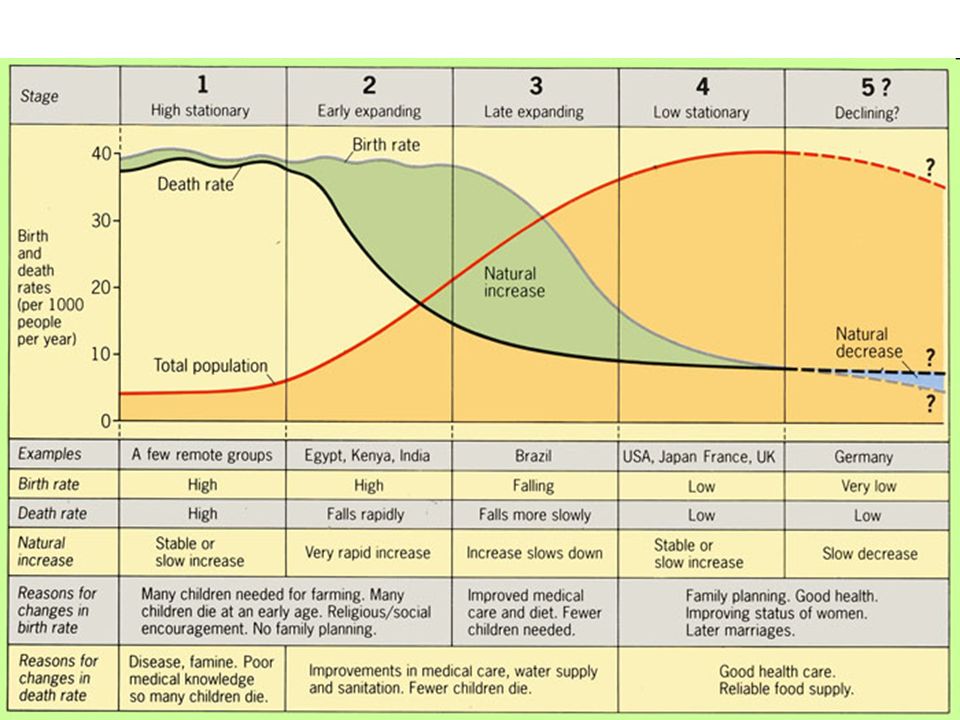
Fig. 2-13: The demographic transition consists of four stages, which move from high birth and death rates, to declines first in death rates then in birth rates, and finally to a stage of low birth and death rates. Population growth is most rapid in the second stage.

3
Stage One Crude birth rates (CBR) and crude death rates (CDR) varied from year to year, but over long term were at very high levels Natural Increase Rate (NIR) was virtually zero Hunting and gathering Agricultural Revolution – domestication of plants and animals Food supplies still unpredictable No nation remains in stage one
 was virtually zero. Hunting and gathering. Agricultural Revolution – domestication of plants and animals. Food supplies still unpredictable. No nation remains in stage one.")
4
Stage Two Crude Death Rate (CDR) drops dramatically while the Crude Birth Rate (CBR) stays roughly the same – high Natural Increase Rate (NIR) increases quickly and population grows rapidly Two possible parts First period has accelerated population growth Second period has growth rate slowing, although gap between births and deaths remain high
 increases quickly and population grows rapidly. Two possible parts. First period has accelerated population growth. Second period has growth rate slowing, although gap between births and deaths remain high.")
5
Stage Two Countries entered stage two as result of the Industrial Revolution (began in England) Spread through Europe and North America Major improvements in technology led to improvements in mass production, transportation, and technology Changes led to higher levels of wealth, which led to healthier places to live New agricultural machines meant ability to feed rapidly growing population

6
Stage Two Improvements in agriculture freed people to work in factories – more goods for people Wealth produced allowed improvements in sanitation and personal hygiene Sewer systems and water supplies People healthier and lived longer Entering Stage Two Europe (many) and North America about 1800 Africa, Asia, and Latin America around 1950
 and North America about Africa, Asia, and Latin America around")
7
Stage Two Medical Revolution – medical technology invented in Europe and North America diffused to less developed countries in Africa, Asia, and Latin America Many traditional causes of death reduced Immunizations to smallpox

8
The Demographic Transition

9
Stage Three Country moves from stage 2 to stage 3 when CBR begins to drop sharply CDR continues to fall, but much slower rate Population continues to grow because CBR is still greater than CDR NIR is less (and decreases) during stage 3 European and North American countries generally moved from stage 2 to stage 3 during the first half of twentieth century Most of Asia and Latin America moved recently Africa remains in stage 2
 during stage 3. European and North American countries generally moved from stage 2 to stage 3 during the first half of twentieth century. Most of Asia and Latin America moved recently. Africa remains in stage 2.")
10
Stage Three Drop in CBR during stage 3 happens for different reasons
Mainly due to social customs People choose to have fewer children Partly a delayed reaction to decline in mortality, especially the IMR Economic changes also play a role People more likely to live in urban areas (cities) and work in factories, offices, or shops (not farms) Unlike farmers, children in urban areas not seen as assets
 and work in factories, offices, or shops (not farms) Unlike farmers, children in urban areas not seen as assets.")
11
Stage Four Country reaches stage four when zero population growth (ZPG) is obtained Occurs when CBR declines to the point it slightly higher than the CDR and the NIR approaches zero Some females die before reaching childbearing years Demographers define ZPG as the TFR that results in a lack of change in the total population over a long term TFR of 2.1 produces ZPG Country with many immigrants may need to lower TFR to achieve ZPG

12
Stage Four Most European countries have reached stage 4
Social customs explain movement from stage 3 to stage 4 Women entering the labor force – no longer being homemakers Changes in lifestyle also explain movement Birth-control (wider variety and more likelihood) Increased leisure time for people to participate in recreation activities not suitable for children
 Increased leisure time for people to participate in recreation activities not suitable for children.")
13
Stage Four Several Eastern European countries have negative NIRs (more deaths than births) Reasons include Communist rule, inadequate pollution controls, strong family-planning programs, and deep-seated pessimism about having children in an uncertain world Changing now that communism is gone

14
The Demographic Transition

15
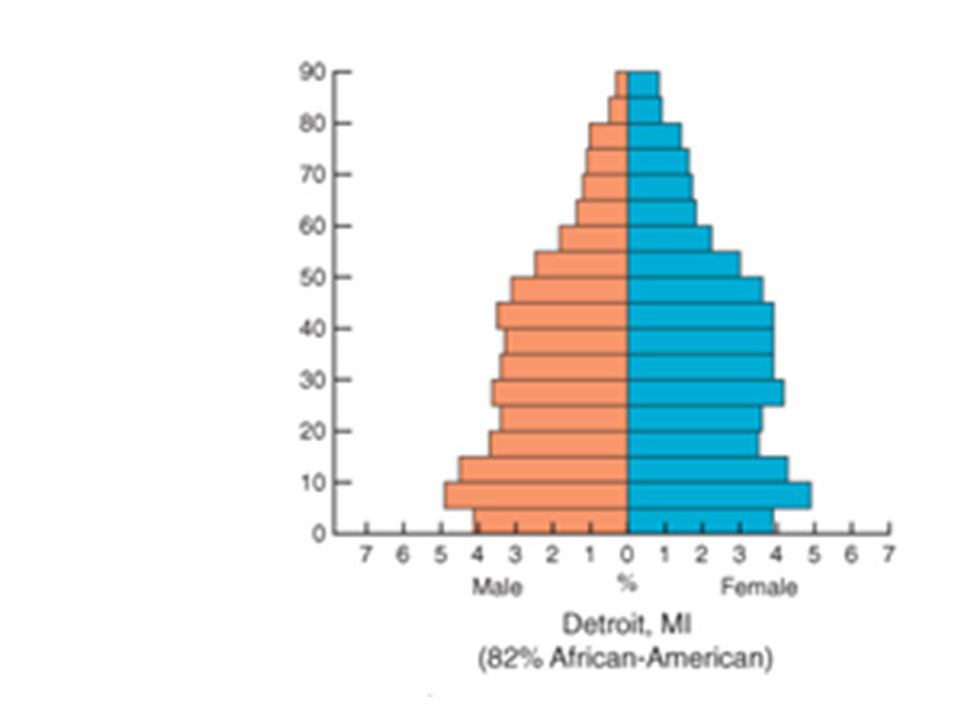
Population Pyramids Displays a country’s population by age and gender on a bar graph Important to study as population in a country is influenced by the percentage of the population in each age group and the distribution of males and females Length of bar represents percentage of total population in that group Shape of pyramid determined by the CBR Examine shape of pyramid by stage in demographic transition

16
Population Pyramids Age Distribution
Dependency Ratio – number of people who are too young or too old to work, compared to the number of people in their productive years Larger percentage of dependents leads to increased financial burden on those trying to support Three age groups used for comparison 0 to 14, 15 to 64, 65 and older 0 to 14 and 65 and older are considered dependents

17
Population Pyramids Age Distribution
Dependency Ratio 1/2 of people in stage 2 are dependents, while only 1/3 of people in stage 4 are dependents Dependency ratio is 1:1 in stage 2 and 1:2 in stage 4 Large percentage (15%) of children in sub-Saharan Africa and other stage 2 countries strains ability of poor countries to provide needed services Schools, hospitals, and day-care centers
 of children in sub-Saharan Africa and other stage 2 countries strains ability of poor countries to provide needed services. Schools, hospitals, and day-care centers.")
18
Population Pyramids Age Distribution
Higher population of elderly in later stages of demographic transition Older people benefit from improved medical care and higher incomes Larger percentage of elderly puts strain on the governments to meet needs of “greying” population 1/4 of government expenditures in U.S., Canada, and Japan go to programs for older population

19
Percent of Population under 15
Fig. 2-15: About one-third of world population is under 15, but the percentage by country varies from over 40% in most of Africa and some Asian countries, to under 20% in much of Europe.

20
Population Pyramids Sex Ratio – number of males per hundred females in the population Generally, more males than females are born, but males have higher death rates Europe and North America 95:100 Rest of world ration is 102:100 Poor countries – higher mortality rate during childbirth explains lower percentage of women

21
Different Stages of Demographic Transition: Rapid Growth in Cape Verde
Fig. 2-17: Cape Verde, which entered stage 2 of the demographic transition in about 1950, is experiencing rapid population growth. Its population history reflects the impacts of famines and out-migration.

22
Different Stages of Demographic Transition: Moderate Growth in Chile
Fig. 2-18: Chile entered stage 2 of the demographic transition in the 1930s, and it entered stage 3 in the 1960s.

23
Different Stages of Demographic Transition: Low Growth in Denmark
Fig. 2-19: Denmark has been in stage 4 of the demographic transition since the 1970s, with little population growth since then. Its population pyramid shows increasing numbers of elderly and few children.

26
USA

34
Figure: 02-16 Title: Population pyramids for the United States and selected communities. Caption: Detroit and Laredo have broader pyramids than Cedar Rapids and Honolulu, indicating higher percentages of young people and higher fertility rates. Unalaska has a high percentage of males because it contains an isolated military base. Lawrence has a high percentage of people in their twenties because it is the home of the University of Kansas. Naples has a high percentage of elderly people, especially women, so its pyramid is upside down.

Similar presentations


>")


