Download presentation
Presentation is loading. Please wait.

1
POPULATION PYRAMIDS

2
WHAT IS A POPULATION PYRAMID?
A population/age sex pyramid is a graphical illustration of the distribution of a human population in a particular country or region at a specific time period (usually one year) . It is assessed in terms of age, which is generally measured on a five year interval (0-4, 5-9, etc) and sex (male or female). It consists of two back-to-back bar graphs, on the left shows male while on the right shows female according to age group as a percentage of the total population, on the X-axis is population while is age on the Y-axis.
 . It is assessed in terms of age, which is generally measured on a five year interval (0-4, 5-9, etc) and sex (male or female). It consists of two back-to-back bar graphs, on the left shows male while on the right shows female according to age group as a percentage of the total population, on the X-axis is population while is age on the Y-axis.")
3
It also tells how many people of each age group live in the area. For e.g. it can show economic dependents (under 15 ,full time education, and over 65, those who have the option of retirement.) and the working population (15-59). Moreover, it can be used to observe the natural increase, birth, and death rate .

4
HOW TO READ A POPULATION PYRAMID?
At the top there is title showing country or region. On the left shows males and the right shows females according to year group as a percentage of the total population. On the X-axis population is showed in millions. While on the Y-axis age is grouped in 5 year intervals (0-4,5-9, 10-14)
")
5
Types of population pyramids
There are generally three types: Expansive Constrictive Stationary

6
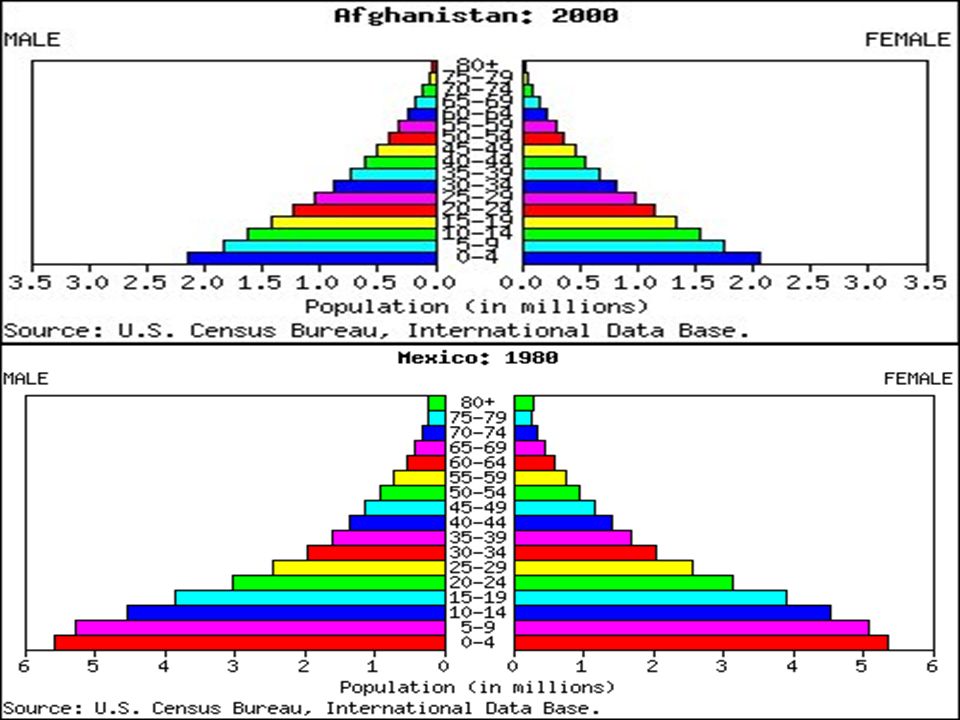
EXPANSIVE These show larger percentages of the population in the younger age groups, usually with each group smaller in proportion than its predecessor. These have a Broad base. This type is usually found in populations with: very large fertility rates lowlife expectancies For e.g. this may be seen in Latin American and many Third World countries.

8
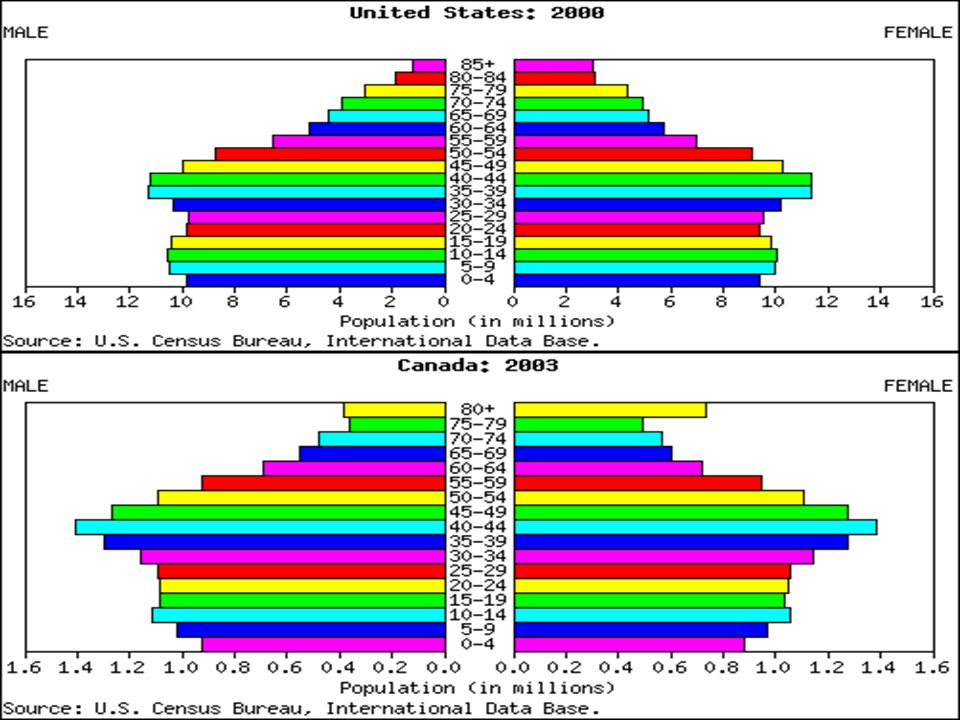
Constrictive These display a lower percentage of young people whilst a higher percentage of the elderly is recorded. These are Top-heavy. This may be so due to : A declining birth and death rate. A high life expectancy For e.g. United States and Canada

10
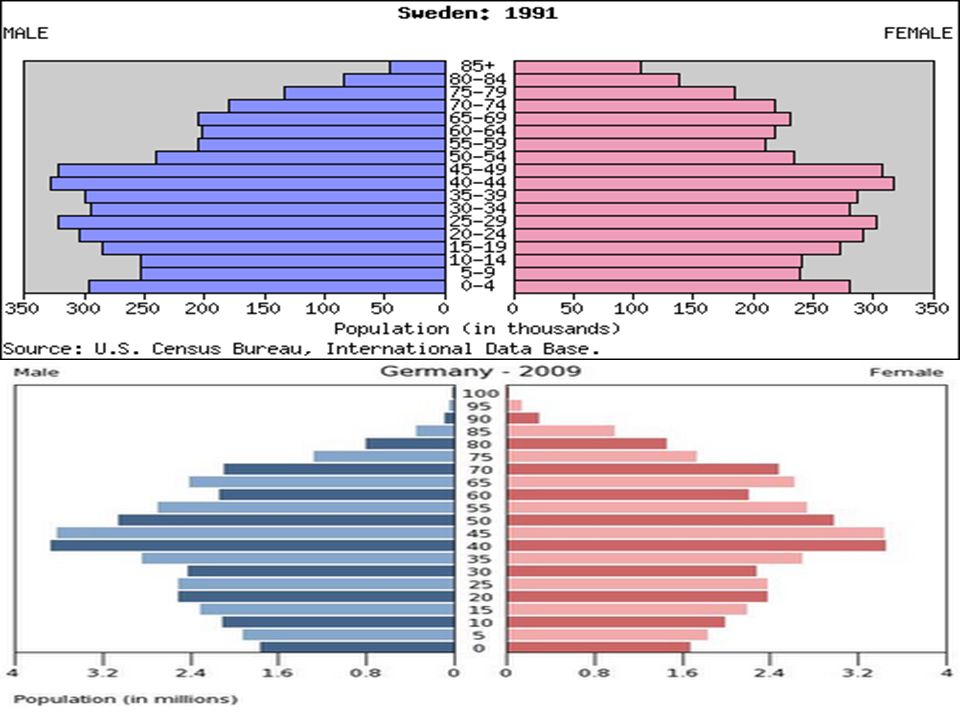
STATIONARY These display somewhat equal percentages for almost all age groups. Of course, smaller figures are still to be expected at the oldest age groups due to old age deaths. For e.g. European countries such as Sweden and Germany.

12
The Demographic Transition Model
It describes a sequence of changes in birth, death rate and population change as a country changes from pre-industrialized to an industrialized economic system. It was developed by an American demographer Warren Thompson ( ). He observed that over 200 years many countries in Western Europe went through similar stages and predicted that in time all countries will pass through the following four stages.
. He observed that over 200 years many countries in Western Europe went through similar stages and predicted that in time all countries will pass through the following four stages.")
14
STAGE 1 : High Fluctuating/ Pre Transition
This is the most primitive stage. There is a high birth and death rate and a slow population growth. Reasons for a high: Birth rate are: Death rate are: Lack of Family Planning High Infant Mortality Rate Children are needed as labour Some religious beliefs encourage a large family High levels of diseases Famine Lack of Sanitation and Clean water Lack of Healthcare

15
STAGE 2 : Early Expanding/ Early Transition
Birth rate remains high but the death rate is falling while the population begins to rise steadily. Reasons for a fall in the Death Rate are: Improved Healthcare Improved Hygiene Improved Sanitation Improved Food Production

16
STAGE 3: Late Expanding/ Middle Transition
Birth rate begins to fall while death rate continues to fall and population rises even more. This is because there is an: Increased mechanisation (reduces need for workers) Increased desire for material things less desire for a large family Emancipation of women to follow careers rather than be child bearers.
 Increased desire for material things less desire for a large family. Emancipation of women to follow careers rather than be child bearers.")
17
STAGE 4: Low Fluctuating/ Late Transition
There is a low birth rate. There is a low death rate. The population is steady. Birth Rate are: Death Rate are: Better Healthcare Better standards of living Children are expensive Lower infant mortality rate

18
THANK YOU By Leanna Rampaul

Similar presentations


 Mr Elliott SSOT.>")


>")


