Download presentation
Presentation is loading. Please wait.

1
Nutrient Cycles & Thermodynamics

2
DO NOW Draw the hydrologic cycle Label all parts of your diagram

3
Biogeochemical Nutrient Cycles

4
Biogeochemical Nutrient Cycles
Hydrologic Carbon-Oxygen Nitrogen Phosphorus Sulfur Rock

5
Biogeochemical Cycles
describe the flow of essential elements from the environment, through living organisms, and back into the environment

6
Hydrologic Cycle

7
The hydrologic cycle

8
Hydrologic Cycle (water cycle)
1. Reservoir – oceans, air (as water vapor), groundwater, lakes and glaciers; evaporation, wind and precipitation (rain) move water from oceans to land 2. Assimilation – plants absorb water from the ground, animals drink water or eat other organisms which are composed mostly of water 3. Release – plants transpire, animals breathe and expel liquid wastes
, groundwater, lakes and glaciers; evaporation, wind and precipitation (rain) move water from oceans to land. 2. Assimilation – plants absorb water from the ground, animals drink water or eat other organisms which are composed mostly of water. 3. Release – plants transpire, animals breathe and expel liquid wastes.")
9
Reserviors

10
Residence Times

11
The carbon-oxygen cycle

12
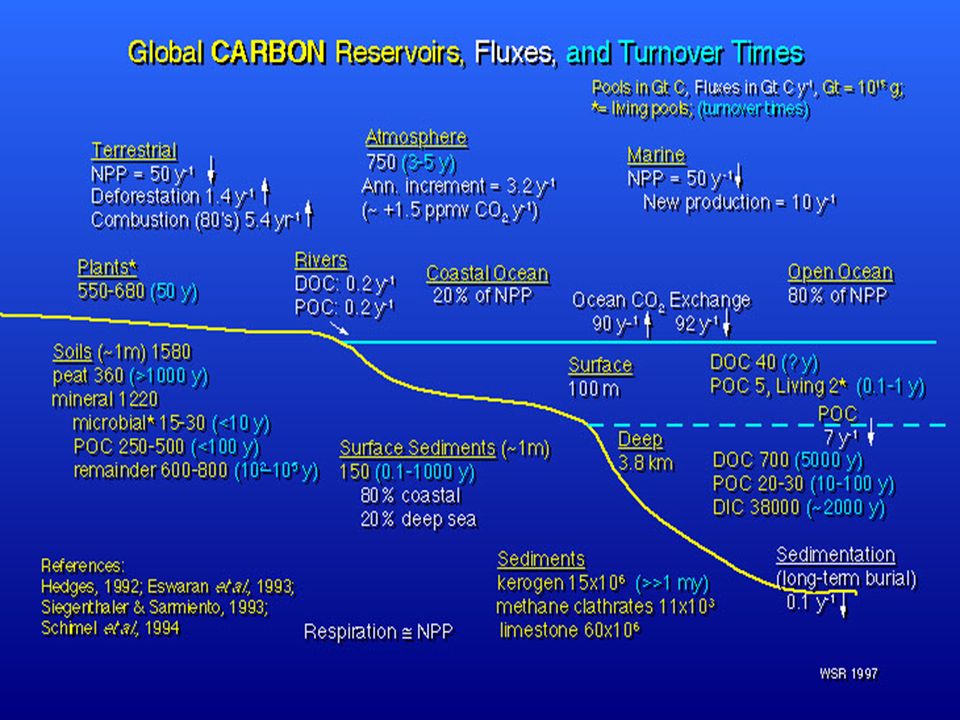
Carbon-Oxygen Cycle (carbon is required for building organic compounds)
1. Reservoir – atmosphere (as CO2), fossil fuels (gas, oil, coal), durable organic materials (for example: cellulose). 2. Assimilation – plants use CO2 in photosynthesis; animals consume plants 3. Release – plants and animals release CO2 through respiration and decomposition; CO2 is released as wood and fossil fuels are burned
, fossil fuels (gas, oil, coal), durable organic materials (for example: cellulose). 2. Assimilation – plants use CO2 in photosynthesis; animals consume plants. 3. Release – plants and animals release CO2 through respiration and decomposition; CO2 is released as wood and fossil fuels are burned.")
14
The nitrogen cycle

15
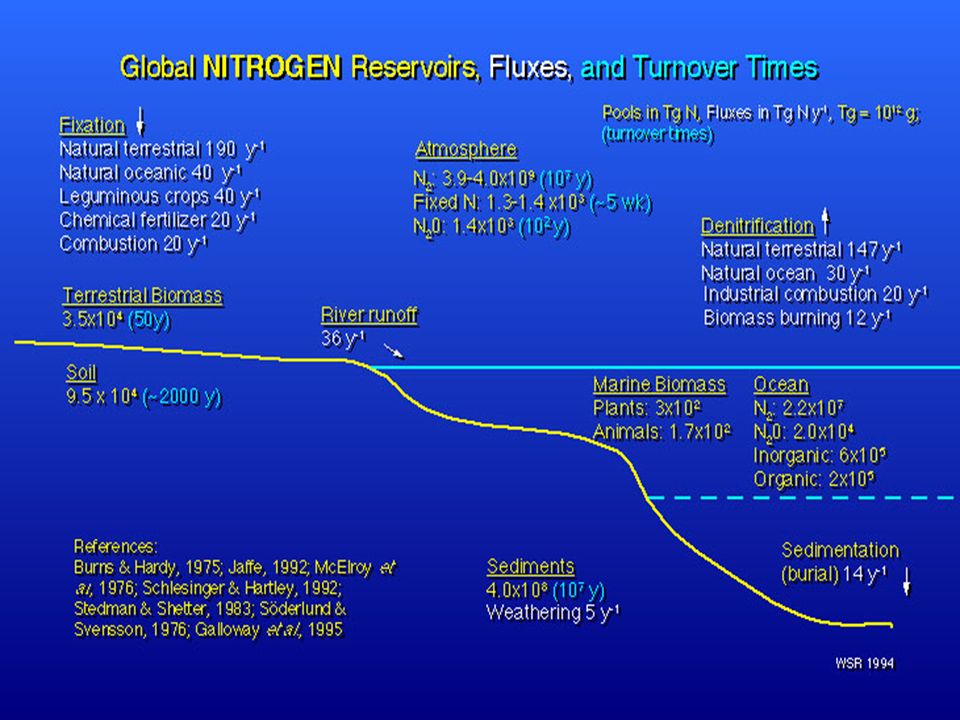
Nitrogen Cycle (Nitrogen is required for the manufacture of amino acids and nucleic acids)
1. Reservoir – atmosphere (as N2); soil (as NH4+ or ammonium, NH3 or ammonia, N02- or nitrite, N03- or nitrate
; soil (as NH4+ or ammonium, NH3 or ammonia, N02- or nitrite, N03- or nitrate.")
16
Nitrogen Cycle 2. Assimilation – plants absorb nitrogen as either NH4+ or as N03-, animals obtain nitrogen by eating plants and other animals. The stages in the assimilation of nitrogen are as follows: Nitrogen Fixation: N2 to NH4+ by nitrogen-fixing bacteria (prokaryotes in the soil and root nodules), N2 to N03- by lightning and UV radiation. Nitrification: NH4+ to N02- and N02- to N03- by various nitrifying bacteria.
, N2 to N03- by lightning and UV radiation. Nitrification: NH4+ to N02- and N02- to N03- by various nitrifying bacteria.")
17
Nitrogen Cycle 3. Release – Denitrifying bacteria convert N03- back to N2 (denitrification); detrivorous bacteria convert organic compounds back to NH4+ (ammonification); animals excrete NH4+ (or NH3) urea, or uric acid.
; detrivorous bacteria convert organic compounds back to NH4+ (ammonification); animals excrete NH4+ (or NH3) urea, or uric acid.")
19
The phosphorus cycle

21
Phosphorus Cycle (Phosphorus is required for the manufacture of ATP and all nucleic acids)
1. Reservoir – erosion transfers phosphorus to water and soil; sediments and rocks that accumulate on ocean floors return to the surface as a result of uplifting by geological processes 2. Assimilation – plants absorb inorganic PO43- (phosphate) from soils; animals obtain organic phosphorus when they plants and other animals 3. Release – plants and animals release phosphorus when they decompose; animals excrete phosphorus in their waste products
 from soils; animals obtain organic phosphorus when they plants and other animals. 3. Release – plants and animals release phosphorus when they decompose; animals excrete phosphorus in their waste products.")
22
The sulfur cycle

23
Sulfur Cycle (Sulfur is required for the manufacture of proteins)
1. Reservoir – Earth’s crust as gypsum (CaSO4) and pyrite (FeS2), oceans as sulfate anions, atmosphere as sulfur dioxide (SO2) 2. Assimilation – sulfate (SO4 2–) is reduced by plants, fungi and prokaryotes 3. Release – plants and animals release sulfur when they decompose
 and pyrite (FeS2), oceans as sulfate anions, atmosphere as sulfur dioxide (SO2) 2. Assimilation – sulfate (SO4 2–) is reduced by plants, fungi and prokaryotes. 3. Release – plants and animals release sulfur when they decompose.")
25
The rock cycle Rock cycle = The heating, melting, cooling, breaking and reassembling of rocks and minerals Rocks help determine soil chemistry, which influences ecosystems Helps us appreciate the formation and conservation of soils, mineral resources, fossil fuels, and other natural resources 25

26
Hypoxia and the Gulf of Mexico’s Dead Zone
Observations: low oxygen levels - hypoxia Hypothesis: caused by nutrients (fertilizers) that ran into the Gulf from rivers Experiments: monitoring oxygen (long term), water sampling (N, NaCl. Bacteria, phytoplankton); observed life; analyzed historical data Results: phytoplankton receiving too much phosphorus from farming & sewage treatment plants As the phytoplankton die the decomposers use up available oxygen Solution: reduce amount of phosphorus entering the Gulf – but How?
 that ran into the Gulf from rivers. Experiments: monitoring oxygen (long term), water sampling (N, NaCl. Bacteria, phytoplankton); observed life; analyzed historical data. Results: phytoplankton receiving too much phosphorus from farming & sewage treatment plants. As the phytoplankton die the decomposers use up available oxygen. Solution: reduce amount of phosphorus entering the Gulf – but How")
27
Newton’s Laws Conservation of Mass – mass cannot be created or destroyed, but can be changed to energy

28
Newton’s Laws - First Thermodynamics – inertia – an object in motion stays in motion unless acted upon by an outside force

29
Thermodynamics – entropy– disorder increases
Newton’s Laws - Second Thermodynamics – entropy– disorder increases Think of entropy as heat loss We must add more energy to compensate for the heat loss

30
Energy passes through trophic levels
One of the most important species interactions is who eats whom Matter and energy move through the community Trophic levels = rank in the feeding hierarchy Producers Consumers Detritivores and Decomposers 30

31
Producers: the first trophic level
Autotrophs (“self-feeders”) = organisms that capture solar energy for photosynthesis to produce sugars Green Plants Cyanobacteria Algae Chemosynthetic bacteria use the geothermal energy in hot springs or deep-sea vents to produce their food 31
 = organisms that capture solar energy for photosynthesis to produce sugars. Green Plants. Cyanobacteria. Algae. Chemosynthetic bacteria use the geothermal energy in hot springs or deep-sea vents to produce their food. 31.")
32
Consumers: organisms that consume producers
Primary consumers = second trophic level Organisms that consume producers Herbivores consume plants Deer, grasshoppers Secondary consumers = third trophic level Organisms that prey on primary consumers Carnivores consume meat Wolves, rodents, birds 32

33
Consumers occur at even higher trophic levels
Tertiary Consumers = fourth trophic level Predators at the highest trophic level Consume secondary consumers Are also carnivores Hawks, owls Omnivores = consumers that eat both plants and animals

34
Detritivores and decomposers
Organisms that consume nonliving organic matter Enrich soils and/or recycle nutrients found in dead organisms Detritivores = scavenge waste products or dead bodies Millipedes Decomposers = break down leaf litter and other non-living material Fungi, bacteria Enhance topsoil and recycle nutrients 34

35
Energy, biomass, and numbers decrease
Most energy organisms use is lost as waste heat through respiration Less and less energy is available in each successive trophic level Each level contains only 10% of the energy of the trophic level below it There are far fewer organisms at the highest trophic levels, with less energy available A human vegetarian’s ecological footprint is smaller than a meat-eater’s footprint 35

36
Pyramids of energy, biomass, and numbers

37
Food webs show relationships and energy flow
Food chain = the relationship of how energy is transferred up the trophic levels Food web = a visual map of feeding relationships and energy flow Includes many different organisms at all the various levels Greatly simplified; leaves out the majority of species 37

38
Some organisms play big roles
Keystone Species = has a strong or wide-reaching impact far out of proportion to its abundance Removal of a keystone species has substantial ripple effects Alters the food chain

39
Species can change communities
Trophic Cascade = predators at high trophic levels can indirectly affect populations of organisms at low trophic levels by keeping species at intermediate trophic levels in check Extermination of wolves led to increased deer populations, which led to overgrazed vegetation and changed forest structure Ecosystem engineers = physically modify the environment Beaver dams, prairie dogs, fungi, insects, phytoplankton

Similar presentations