Download presentation
Presentation is loading. Please wait.

1
Green Industry Situation and Outlook 2008 Southern Region Agricultural Outlook Conference Ronald L. Rainey Associate Professor/Extension Economist

2
What is the Green Industry?

3
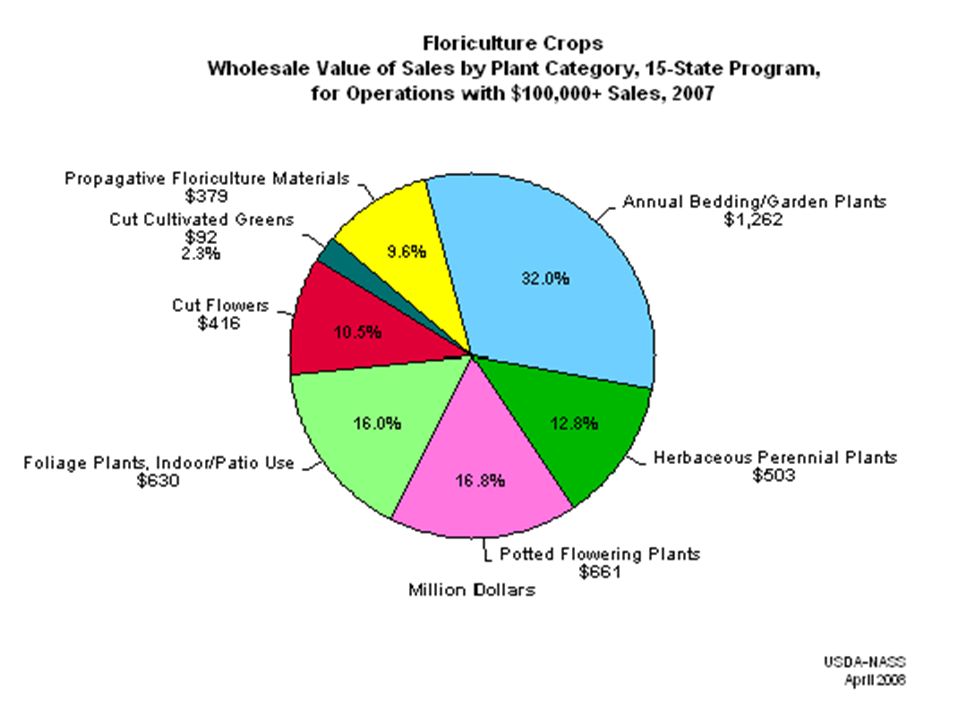
Greenhouse and Nursery Crops Greenhouse cropsNursery Crops Bedding/garden plants Potted flowering plants Foliage plants Bedding & garden plants Cut cultivated greens Propagative materials Broadleaf evergreens Coniferous evergreens Deciduous shade trees Deciduous flowering shrubs Fruit/nut plants Palms Ornamental grasses Other woody ornamentals Christmas trees Vegetable transplants Propagation materials

6
U.S. Greenhouse and Nursery Grower Cash Receipts, 1993-date ($1,000).
.")
7
U.S. Greenhouse and Nursery Grower Cash Receipts, 2000-date ($1,000).
.")
8
U.S. Greenhouse and Nursery Grower Cash Receipts, Regions ($1,000).
.")
9
Top 10 Greenhouse and Nursery States in Terms of Grower Cash Receipts, 2006p ($1,000). 1. California$3,804,453 2. Florida1,753,399 * 3. Texas1,496,345 * 4. Oregon1,040,452 5. North Carolina1,026,509 * 6. Michigan642,393 7. Ohio604,438 8. Pennsylvania411,441 9. New York408,976 10. Georgia400,000 * Total Top 1011,588,406 Total U.S.$16,891,934

10
Greenhouse and nursery cash receipts, by Southern state, 2006p ($1,000). Southern region represents about 37% of total U.S. production.

11
Grower Cash Receipts Annual growth is projected to be 0.3% for 2006. The market has slowed along with the economy. Even though the housing market is in a crisis, greenhouse and nursery product sales have remained fairly constant. The Southern region contributes the largest share of sales (approximately 38%) but experienced a decrease of 2.9% in grower sales receipts for 2006.
 but experienced a decrease of 2.9% in grower sales receipts for")
14
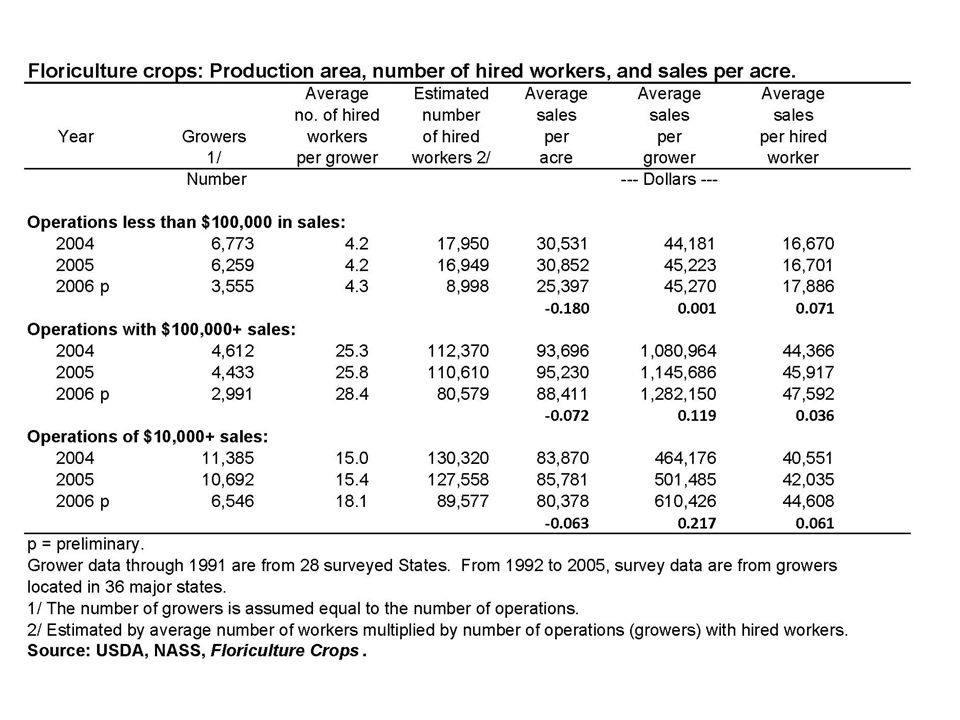
Floriculture Growers Industry is continuing to transition with growers exiting the industry, increased concentration and consolidation. Larger producers are getting bigger. Automation, economies of scale and specialization continue, with this trend being pushed by mass marketers. Finding quality, available labor continues to be a primary concern.

15
Greenhouse and Nursery Consumption by household (Dollars).
.")
16
Value of Greenhouse and Nursery Imports and Exports, 1994-date ($1,000).
.")
17
Imports Cut flower and nursery stock continue to dominate the greenhouse and nursery imports, which were up 8.3% and 2.2% for 2006, respectively. Cut flowers represent 53% of green industry imports.

18
Summary The green industry continues to be a major sector within U.S. agriculture (12%) and is of major importance to farmers, rural communities, and consumers. Imports continue to trend upward driven by the demands for cut flowers and nursery stock. Although the industry has maintained overall grower sales levels, the number of growers continues to decline.
 and is of major importance to farmers, rural communities, and consumers. Imports continue to trend upward driven by the demands for cut flowers and nursery stock. Although the industry has maintained overall grower sales levels, the number of growers continues to decline..")
19
Summary Higher Energy costs continue to dampen consumer spending including discretionary goods such as ornamentals, Inflationary pressures subdued demand, so prices of greenhouse and nursery crops will be unable to rise enough to combat higher production costs.

20
Summary Niche branding along with value-added services and products are emerging strategies for small growers to gain market share. Sustainability, certification products, and production systems are emerging as a method of market segmentation.

21
Questions?

Similar presentations


![1 Horticulture / Landscape Mr. Brudelie. 2 Horticulture Horticulture –Comes from the Latin word meaning garden cultivation (hortus [garden] and culture.](/2/759949/big_thumb.jpg "1 Horticulture / Landscape Mr. Brudelie. 2 Horticulture Horticulture –Comes from the Latin word meaning garden cultivation (hortus [garden] and culture.>")


