Download presentation
Presentation is loading. Please wait.

2
Results of the research

3
Data classification of the sample: AgeFrequencyRateCumulative rate 1. 18-25 years old3929,3 2. 26-35 years old3224,153,4 3. 36-45 years old2921,875,2 4. 46-55 years old2619,594,7 5. 56-65 years old53,898,5 6. More than 65 years old 21,5100

4
Data classification of the sample: OccupationFrequencyRate 1. Only student1410,5 2. Unemployed6750,3 3. Salaried employee3929,4 4. Business owner75,3 5. Pensioner64,5 Total133100

5
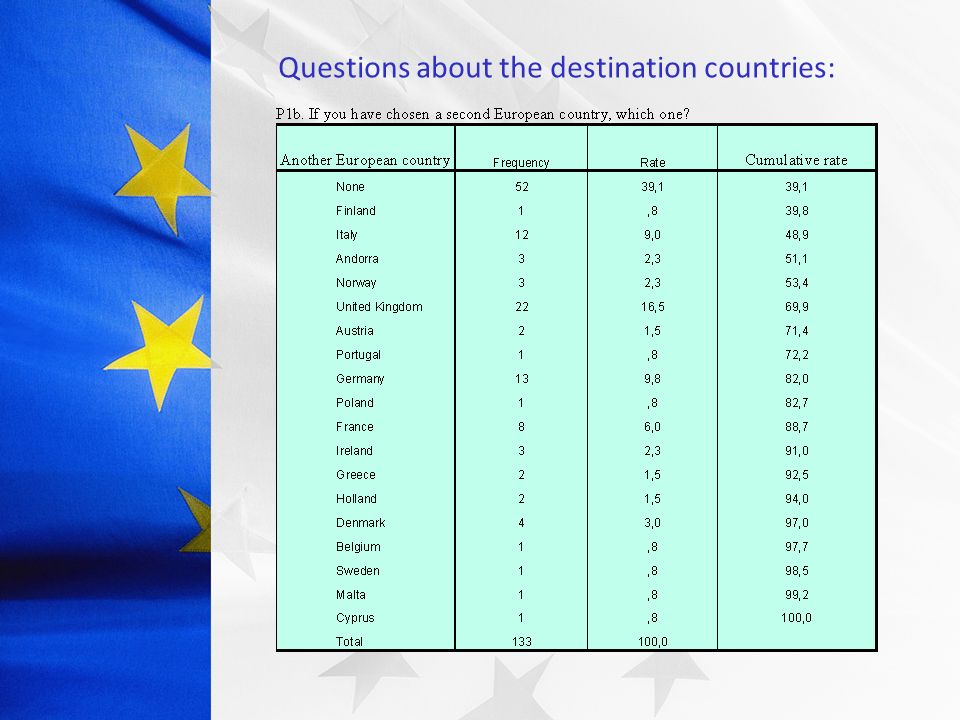
Questions about the destination countries:

7
CountryFrequencyRate USA1664 New Zealand416 Canada28 Australia14 Argentina14 Japan14 Total25100

8
Questions about reasons to emigrate:

9
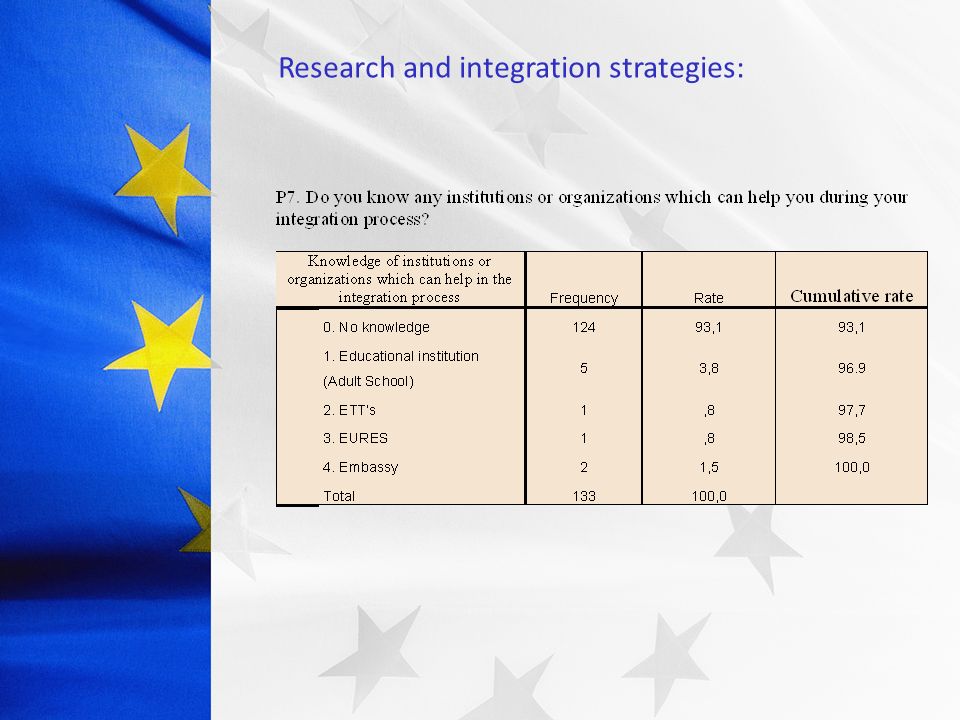
Research and integration strategies:

11
Professional preferences:

12
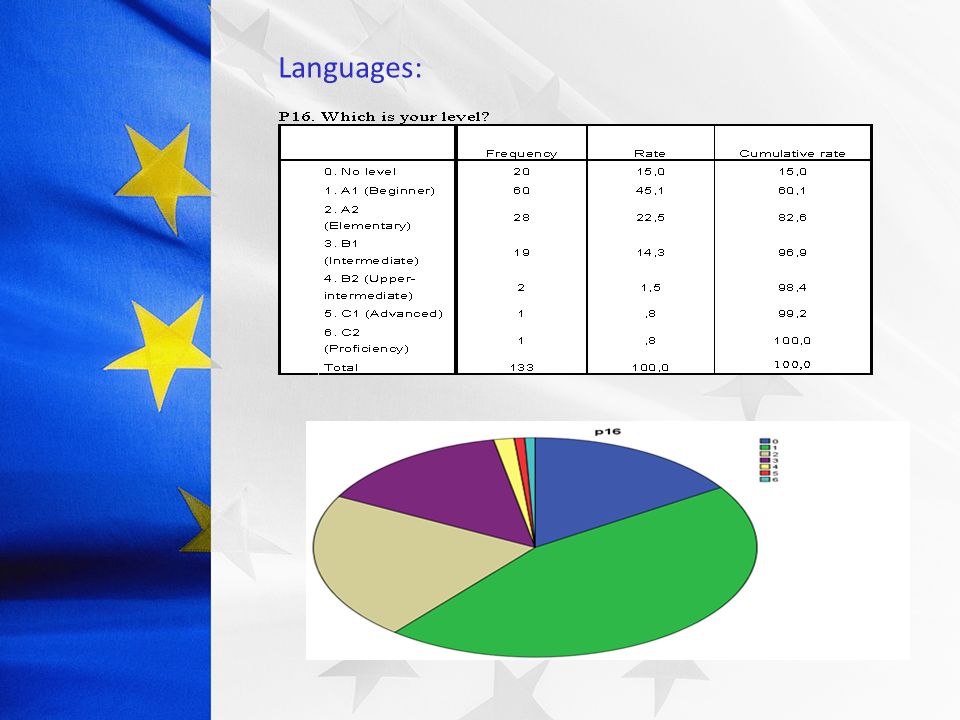
Languages:

14
Information technologies:

15
Kind of job you would accept:

16
Priority in your decision:

17
Knowledge and skills: Statistics NMinimumMaximumAverage Standard Dev. Variance p26 133141,41,676,456 P26. To what extent do you know the labour law in the reception country (kinds of contracts, rights and duties of workers, minimum wage, etc.)? P27. To what extent do you usually adapt your curriculum and your covering letter, etc. to the needs of the chosen reception country? Statistics NMinimumMaximumAverage Standard Dev. Variance p28 133141,84,833,695 P28. To what extent would you be able to maintain a job interview in the language of the reception country and/or in English? Statistics NMinimumMaximumAverage Standard Dev. Variance p27 133151,991,0551,114
. P27. To what extent do you usually adapt your curriculum and your covering letter, etc. to the needs of the chosen reception country. Statistics NMinimumMaximumAverage Standard Dev. Variance p ,84,833,695 P28. To what extent would you be able to maintain a job interview in the language of the reception country and/or in English. Statistics NMinimumMaximumAverage Standard Dev. Variance p ,991,0551,114.")
18
Main conclusions: -The sample is made up of CP d’FPA Tirant lo Blanc students. -Most students (53,4%) are under 35 years old, and almost half of them (48,1%) do not hold the Secondary Education Certificate. They are unemployed in more than half of the cases (50,3%), which is a number over the global Spanish average (25,6%) and slightly under the Spanish average of under 25 (53,6%). -Their favourite country to emigrate within Europe is the United Kingdom (38,3% as first option; 16,5% as second option), followed by France (21,8% as first option; 6% as second option), and Germany (10,5% and 9,8%, respectively). -The non-European country they chose most is the USA (64%). -Despite the important amount of information available on the Internet and through National and European organizations, a great majority of the respondents don’t know any strategies to look for an accomodation abroad (64,7%) or which people (63,9%) or institutions (93,1%) could help them during their integration process.
 are under 35 years old, and almost half of them (48,1%) do not hold the Secondary Education Certificate. They are unemployed in more than half of the cases (50,3%), which is a number over the global Spanish average (25,6%) and slightly under the Spanish average of under 25 (53,6%). -Their favourite country to emigrate within Europe is the United Kingdom (38,3% as first option; 16,5% as second option), followed by France (21,8% as first option; 6% as second option), and Germany (10,5% and 9,8%, respectively). -The non-European country they chose most is the USA (64%). -Despite the important amount of information available on the Internet and through National and European organizations, a great majority of the respondents don’t know any strategies to look for an accomodation abroad (64,7%) or which people (63,9%) or institutions (93,1%) could help them during their integration process..")
19
Main conclusions: -Although most respondents have studied at least a foregin language (mainly English, 75,2%), the level they have achieved is under B1 (intermediate) in 82,6% of the cases. -The respondents give a score of 1,84 over 5 marks (much lower than a pass, 3 marks) to their ability of maintaining a job interview in a foreign language. -In relation to ICT, spreadsheets are their most notorious lack, just 43,6% of them have a good grasp of them. -Their level of knowledge about the economic and labour conditions in the reception country is very poor, 1,41 over 5 marks. -The majority of them give a low value (1,99 over 5 marks) to their own ability to adapt a curriculum vitae or a covering letter to the needs of these documents in an international context or in the chosen reception country. -In conclusion, within this sample of research, a low level in languages, and an almost nonexisting knowledge of tools and strategies to look for a job abroad will make very difficult the possibility of reaching this goal with a minimun guarantee.
 to their ability of maintaining a job interview in a foreign language. -In relation to ICT, spreadsheets are their most notorious lack, just 43,6% of them have a good grasp of them. -Their level of knowledge about the economic and labour conditions in the reception country is very poor, 1,41 over 5 marks. -The majority of them give a low value (1,99 over 5 marks) to their own ability to adapt a curriculum vitae or a covering letter to the needs of these documents in an international context or in the chosen reception country. -In conclusion, within this sample of research, a low level in languages, and an almost nonexisting knowledge of tools and strategies to look for a job abroad will make very difficult the possibility of reaching this goal with a minimun guarantee..")
Similar presentations


 ACADEMIA 2011. Ljubljana 9 th – 13 th May 2011. “To fight against the scholastic failure. To achieve that at least.>")


