Download presentation
Presentation is loading. Please wait.

1
Myers’ PSYCHOLOGY Chapter 1 Thinking Critically with Psychological Science James A. McCubbin, PhD Clemson University Worth Publishers

2
Critical Thinking Critical thinking does not accept arguments and conclusions blindly. It examines assumptions, discerns hidden values, evaluates evidence and assesses conclusions. The Amazing Randi Courtesy of the James Randi Education Foundation

3
Limits of Intuition and Common Sense zHindsight Bias ytendency to believe, after learning an outcome, that one would have foreseen it ythe “I-knew-it-all-along” phenomenon zOverconfidence ywe tend to think we know more than we do

4
Limits of Intuition Personal interviewers may rely too much on their “gut feelings” when meeting with job applicants. Taxi/ Getty Images

5
How Do Psychologists Ask & Answer Questions? Psychologists, like all scientists, use the scientific method to construct theories that organize, summarize and simplify observations.

6
The Scientific Method

7
A theory is an explanation that integrates principles and organizes and predicts behavior or events. For example, low self-esteem contributes to depression. Theory

8
A hypothesis is a testable prediction, often prompted by a theory, to enable us to accept, reject or revise the theory. People with low self-esteem are apt to feel more depressed. Hypothesis

9
Research would require us to administer tests of self-esteem and depression. Individuals who score low on a self-esteem test and high on a depression test would confirm our hypothesis. Research Observations

10
Research Process

11
Scientific Methods zDescriptive Method – describes something that is occurring (case studies, surveys, naturalistic observation) zCorrelational Method ygives information on whether there is a relationship between two (or more) things yCan NOT establish causation zExperimental Method – manipulates one variable to see if the change effects another variable yCan establish causation
 zCorrelational Method ygives information on whether there is a relationship between two (or more) things yCan NOT establish causation zExperimental Method – manipulates one variable to see if the change effects another variable yCan establish causation")
12
Description Methods Case Study A technique in which one person is studied in depth to reveal underlying behavioral principles. Is language uniquely human? Susan Kuklin/ Photo Researchers

13
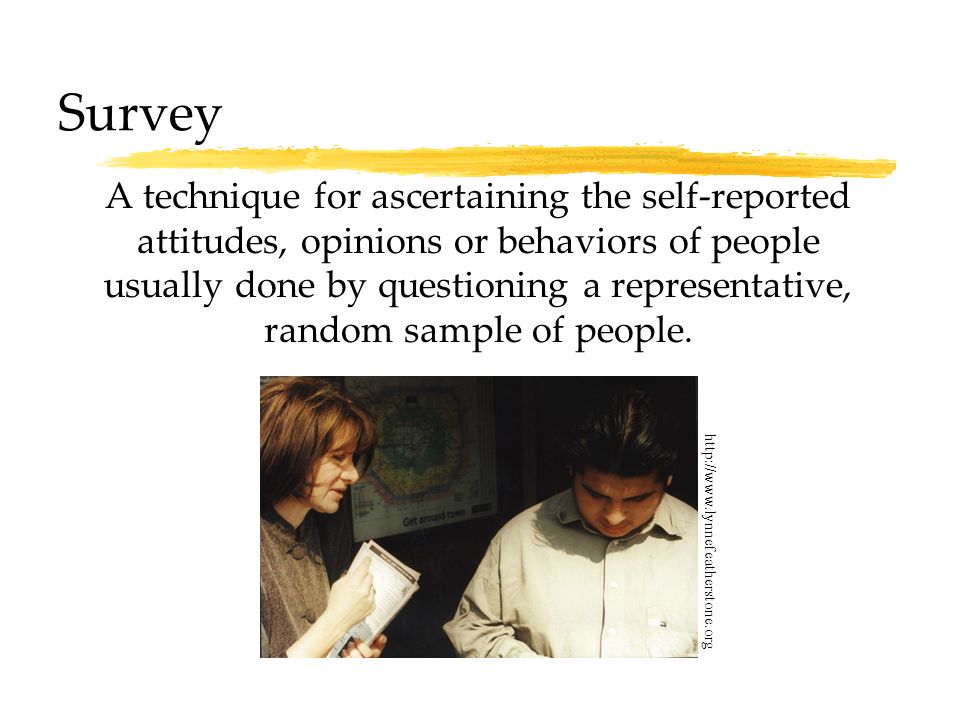
Survey A technique for ascertaining the self-reported attitudes, opinions or behaviors of people usually done by questioning a representative, random sample of people. http://www.lynnefeatherstone.org
14
Survey zWording Effects yCan change the results of a survey yShould cigarette ads and pornography be allowed on television? (not allowed vs. forbid) zFalse Consensus Effect ytendency to overestimate the extent to which others share our beliefs and behaviors
 zFalse Consensus Effect ytendency to overestimate the extent to which others share our beliefs and behaviors.")
15
Survey Random Sampling If each member of a population has an equal chance of inclusion into a sample, it is called a random sample (unbiased). If the survey sample is biased, its results are not valid. The fastest way to know about the marble color ratio is to blindly transfer a few into a smaller jar and count them.

16
Naturalistic Observation Observing and recording the behavior of animals in the wild and recording self-seating patterns in a multiracial school lunch room constitute naturalistic observation. Courtesy of Gilda Morelli

17
Research Strategies Correlation Coefficient a statistical measure of the extent to which two factors vary together and thus how well either factor predicts the other Correlation coefficient Indicates direction of relationship (positive or negative) Indicates strength of relationship (0.00 to 1.00) r = +.37
 Indicates strength of relationship (0.00 to 1.00) r = +.37")
18
Scatterplots Perfect positive correlation (+1.00) No relationship (0.00)Perfect negative correlation (-1.00)
 No relationship (0.00)Perfect negative correlation (-1.00)")
19
Data Data showing height and temperament in people.

20
Scatterplot The Scatterplot below shows the relationship between height and temperament in people. There is a moderate positive correlation of +0.63.

21
Illusory Correlation The perception of a relationship where no relationship actually exists. Parents conceive children after adoption. Confirming evidence Disconfirming evidence Do not adopt Disconfirming evidence Confirming evidence Adopt Do not conceive Conceive Michael Newman Jr./ Photo Edit

22
Random Sequences zYour chances of being dealt either of these hands is precisely the same: 1 in 2,598,960.

23
Research Strategies zThree Possible Cause-Effect Relationships (1) Low self-esteem Depression (2) Depression Low self-esteem Depression (3) Distressing events or biological predisposition could cause or and
 Low self-esteem Depression (2) Depression Low self-esteem Depression (3) Distressing events or biological predisposition could cause or and")
24
Experimental Method Like other sciences, experimentation is the backbone of psychological research. Experiments isolate causes and their effects. Exploring Cause and Effect

25
Many factors influence our behavior. Experiments (1) manipulate factors that interest us, while other factors are kept under (2) control. Effects generated by manipulated factors isolate cause and effect relationships. Exploring Cause & Effect
 manipulate factors that interest us, while other factors are kept under (2) control. Effects generated by manipulated factors isolate cause and effect relationships. Exploring Cause & Effect.")
26
Research Strategies zOperational Definition ya statement of procedures (operations) used to define research variables yExample- xintelligence may be operationally defined as what an intelligence test measures
 used to define research variables yExample- xintelligence may be operationally defined as what an intelligence test measures")
27
Research Strategies zReplication yrepeating the essence of a research study to see whether the basic finding generalizes to other subjects and circumstances yusually with different subjects in different situations

28
Research Strategies zPopulation yall the cases in a group, from which samples may be drawn for a study zRandom Sample ya sample that fairly represents a population because each member has an equal chance of inclusion

29
Research Strategies zExperiment ythe investigator manipulates one or more factors (independent variables) to observe their effect on some behavior or mental process (the dependent variable) while controlling other relevant factors by random assignment of subjects yby random assignment of participants the experiment controls other relevant factors
 to observe their effect on some behavior or mental process (the dependent variable) while controlling other relevant factors by random assignment of subjects yby random assignment of participants the experiment controls other relevant factors")
30
Research Strategies zDouble-blind Procedure yboth the subject and the research staff are ignorant (blind) about whether the subject has received the treatment or a placebo ycommonly used in drug-evaluation studies zPlacebo yan inert substance or condition that may be administered instead of a presumed active agent, such as a drug, to see if it triggers the effects believed to characterize the active agent
 about whether the subject has received the treatment or a placebo ycommonly used in drug-evaluation studies zPlacebo yan inert substance or condition that may be administered instead of a presumed active agent, such as a drug, to see if it triggers the effects believed to characterize the active agent")
31
Research Strategies zExperimental Condition ythe condition of an experiment that exposes subjects to the treatment, that is, to one version of the independent variable zControl Condition ythe condition of an experiment that contrasts with the experimental treatment yserves as a comparison for evaluating the effect of the treatment

32
Research Strategies zRandom Assignment yassigning subjects to experimental and control conditions by chance yminimizes pre-existing differences between those assigned to the different groups

33
An independent variable is a factor manipulated by the experimenter. The effect of the independent variable is the focus of the study. For example, when examining the effects of breast feeding upon intelligence, breast feeding is the independent variable. Independent Variable

34
A dependent variable is a factor that may change in response to an independent variable. In psychology, it is usually a behavior or a mental process. For example, in our study on the effect of breast feeding upon intelligence, intelligence is the dependent variable. Dependent Variable

35
Comparison Below is a comparison of different research methods.

36
Statistical Reasoning Statistical procedures analyze and interpret data allowing us to see what the unaided eye misses. Composition of ethnicity in urban locales

37
Describing Data A meaningful description of data is important in research. Misrepresentation may lead to incorrect conclusions.

38
Statistical Reasoning zMode ythe most frequently occurring score in a distribution zMean ythe arithmetic average of a distribution yobtained by adding the scores and then dividing by the number of scores zMedian ythe middle score in a distribution yhalf the scores are above it and half are below it

39
Statistical Reasoning zA Skewed Distribution 15 20 25 30 35 40 45 50 90 475710 70 Mode Median Mean One Family Income per family in thousands of dollars

40
Normal Curve A symmetrical, bell-shaped curve that describes the distribution of many types of data (normal distribution). Most scores fall near the mean.

41
Measures of Variation Range: The difference between the highest and lowest scores in a distribution. Standard Deviation: A computed measure of how much scores vary around the mean.

42
Statistical Reasoning zStatistical Significance ya statistical statement of how likely it is that an obtained result occurred by chance

43
Making Inferences When sample averages are reliable and the difference between them is relatively large, we say the difference has statistical significance. It is probably not due to chance variation. For psychologists this difference is measured through alpha level set at 5 percent. When is a Difference Significant?

44
FAQ Q5. Is psychology free of value judgments? Ans: No. Psychology emerges from people who subscribe to a set of values and judgments. © Roger Shepard

45
FAQ Q4. Is it ethical to experiment on people? Ans: Yes. Experiments that do not involve any kind of physical or psychological harm beyond normal levels encountered in daily life may be carried out. Milgram Experiment Replication

Similar presentations
>")
 David Myers PowerPoint Slides Aneeq Ahmad Henderson State University Worth Publishers, © 2008.>")


 David Myers PowerPoint Slides Aneeq Ahmad Henderson State University Worth Publishers, © 2010.>")

>")
 Chapter 1 Thinking Critically with Psychological Science James A. McCubbin, PhD Clemson University Worth Publishers.>")

 Chapter 1 Thinking Critically with Psychological Science James A. McCubbin, PhD Clemson University Worth Publishers.>")
 Chapter 1 Thinking Critically with Psychological Science James A. McCubbin, PhD Clemson.>")


 David Myers PowerPoint Slides Aneeq Ahmad Henderson State University Worth Publishers, © 2008.>")


>")
