Download presentation
Presentation is loading. Please wait.

1
Switch off your Mobiles Phones or Change Profile to Silent Mode

2
Topics Introduction Project Life Cycle Conceptualisation Stage Planning Stage Planning Tools and Techniques Implementation Stage Team Dynamics and Management

3
Planning Tools and Techniques Network Diagrams Critical Path Method PERT Analysis Gantt Charts Resource Histogram Containment of Risk

4
Network Diagrams A graphical representation of the tasks necessary to complete a project Visualizes the flow of tasks & relationships Network Diagram is a schematic display of the logical relationships among, or sequencing of, project activities. Network Diagram is also known as Project Schedule Network Diagrams or PERT Chart

5
Network Diagrams § Powerful tools to represent and optimise complex schedules § Planning rather management reporting tool Two classic formats AoA: Activity on Arrow AoN: Activity on Node

6
Activity – on – Arrow (AoA) Network consists of Nodes and Arrows Each Node represents an Event Each Arrow Starts and Ends at an Event Each Arrow represents an Activity Arrows and Nodes are uniquely labelled Arrows point from left to right (indicating time)
 Network consists of Nodes and Arrows Each Node represents an Event Each Arrow Starts and Ends at an Event Each Arrow represents an Activity Arrows and Nodes are uniquely labelled Arrows point from left to right (indicating time)")
7
1020 A2A2 Activity A runs from event 10 to event 20 and has a duration of 2 time units. Activity – on – Arrow (AoA)
.")
8
1020507080 3040 60 A2A2 B4B4 D3D3 C5C5 E2E2 F3F3 G3G3 H7H7 I3I3 Activity – on – Arrow (AoA)
")
9
Activity – on – Node (AoN) Network consists of Nodes and Arrows Each Node represents an Activity Each arrow represents a logical dependency between Activities Can represent different dependencies Different conventions are used Arrows can include a time lag
 Network consists of Nodes and Arrows Each Node represents an Activity Each arrow represents a logical dependency between Activities Can represent different dependencies Different conventions are used Arrows can include a time lag")
10
10 Task 1 10 days Task 2 5 days 3 Finish-to-start dependency 3 days lag Task 1 10 days Task 2 5 days Start-to-start dependency 4 days lag 4 Activity – on – Node (AoN)
")
11
11 MS Project’s convention for A-o-N Activity – on – Node (AoN)
")
12
Network Diagrams Node – is simply the Starting and Ending point of an Activity. First Node signifies the Start of a Project and Last Node signifies Ending Node of a Project. Burst – Occurs when two or more activities follow a Single Node. Merge – Occur when two or more Nodes precede a Single Node.

13
Network Diagrams AoA consists of Circles representing Events Such as ‘start’ or ‘end’ of a given task Lines representing Tasks Thing being done ‘Build UI’ eg. Arrow Diagramming Method (ADM) AoN Tasks on Nodes Nodes can be circles or rectangles Task information written on node Arrows are dependencies between tasks Eg. Precedence Diagramming Method (PDM)
 AoN Tasks on Nodes Nodes can be circles or rectangles Task information written on node Arrows are dependencies between tasks Eg. Precedence Diagramming Method (PDM).")
14
Network Diagrams Basic Rules about Network Diagram All arrowheads should face toward right, and no arrows should cross on an AoA Network Diagram. Every activity on Network Diagram must be completed in order for project to finish. Not Every single item on WBS needs to be on the Network Diagram. Only activities with dependencies need to be shown on the Network Diagram.

15
Network Diagrams Basic Rules about Network Diagram (Cont.) For projects with hundreds of Activities, it might be simpler to include only activities with dependencies on a network Diagram, especially on large projects Sometimes it is enough to put Summary Tasks on a network diagram or to break down the project into several smaller Network Diagrams
 For projects with hundreds of Activities, it might be simpler to include only activities with dependencies on a network Diagram, especially on large projects Sometimes it is enough to put Summary Tasks on a network diagram or to break down the project into several smaller Network Diagrams")
16
Network Diagram Advantages Show precedence well Reveal interdependencies not shown in other techniques Ability to calculate critical path Ability to perform “what if” exercises Disadvantages Default model assumes resources are unlimited You need to incorporate this yourself (Resource Dependencies) when determining the “real” Critical Path Difficult to follow on large projects
 when determining the real Critical Path Difficult to follow on large projects")
17
Critical Path Method (CPM) Process for determining and optimizing Critical Path (CP) Non-CP tasks can Start Earlier or Later without impacting Completion Date Note Critical Path may change to another as you shorten current Should be done in conjunction with you and Functional Manager
 Process for determining and optimizing Critical Path (CP) Non-CP tasks can Start Earlier or Later without impacting Completion Date Note Critical Path may change to another as you shorten current Should be done in conjunction with you and Functional Manager")
18
Critical Path Method (CPM) Either A – o – N or A – o – A networks can be used to calculate the Critical Path We will use A – o – A terminology A – o – N method looks slightly different, but result is the same!
 Either A – o – N or A – o – A networks can be used to calculate the Critical Path We will use A – o – A terminology A – o – N method looks slightly different, but result is the same!")
19
Critical Path Method (CPM) Earliest Event Time (EET) Earliest Time an Event can occur all Equal to Earliest Time all activities leading into event can be completed Determines Earliest Time any activity leading from event can start Latest Event Time (LET): Latest Time an Event can occur (and still complete project in shortest possible time) Greater than or equal to Earliest Event Time
 Earliest Event Time (EET) Earliest Time an Event can occur all Equal to Earliest Time all activities leading into event can be completed Determines Earliest Time any activity leading from event can start Latest Event Time (LET): Latest Time an Event can occur (and still complete project in shortest possible time) Greater than or equal to Earliest Event Time")
20
Critical Path Method (CPM) Notes: two passes through network diagram first pass to calculate EETs, left to right second pass to calculate LETs, right to left cannot have LET earlier than EET cannot have negative times for EETs and LETs Start Time of Project will be zero (EET = LET = 0) Finish Time of project will have EET = LET
 Notes: two passes through network diagram first pass to calculate EETs, left to right second pass to calculate LETs, right to left cannot have LET earlier than EET cannot have negative times for EETs and LETs Start Time of Project will be zero (EET = LET = 0) Finish Time of project will have EET = LET")
21
Critical Path Method (CPM) Float Float is difference between LET and EET Float = LET – EET. Float is always greater than or equal to zero Critical Path Critical Path is the sequence of activities with zero float Critical PathLongest Path Shortest Time Critical Path is the Longest Path through network, but Shortest Time in which project can be completed Critical Path must go all way through Network Diagram

22
Critical Path Method: Table ActivityDurationEETLETFloat / Slack A2 B4 C5 D3 E2 F3 G3 H7 I3

23
Forward Pass To determine Earliest Event Time (EET) for each Activity Work from left to right Adding times in each path Rule: when several tasks converge, EET for the next task is the largest of preceding EET
 for each Activity Work from left to right Adding times in each path Rule: when several tasks converge, EET for the next task is the largest of preceding EET")
24
Critical Path Method (CPM) 100 202 50 7080 30 40 60 A2A2 B4B4 D3D3 C5C5 E2E2 F3F3 G3G3 H7H7 I3I3EET EET 0 plus duration 2 gives EET 2 for the next activities B, C & D
 A2A2 B4B4 D3D3 C5C5 E2E2 F3F3 G3G3 H7H7 I3I3EET EET 0 plus duration 2 gives EET 2 for the next activities B, C & D")
25
Critical Path Method (CPM) 100 202 507 7080 306 40 605 A2A2 B4B4 D3D3 C5C5 E2E2 F3F3 G3G3 H7H7 I3I3 EET EET 2 plus duration 3 gives EET 5 for the next activity H EET 2 plus duration 5 gives EET 7 for the next activity G EET 2 plus duration 4 gives EET 6 for the next activity E
 A2A2 B4B4 D3D3 C5C5 E2E2 F3F3 G3G3 H7H7 I3I3 EET EET 2 plus duration 3 gives EET 5 for the next activity H EET 2 plus duration 5 gives EET 7 for the next activity G EET 2 plus duration 4 gives EET 6 for the next activity E")
26
Critical Path Method (CPM) 100 202 507 7012 80 306 408 605 A2A2 B4B4 D3D3 C5C5 E2E2 F3F3 G3G3 H7H7 I3I3 EET From H, EET 5 plus duration 7 gives EET 12 for the next activity I From G, EET 7 plus duration 3 gives EET 10 for the next activity I From F, EET 8 plus duration 3 gives EET 11 for the next activity I 11 10 12
 A2A2 B4B4 D3D3 C5C5 E2E2 F3F3 G3G3 H7H7 I3I3 EET From H, EET 5 plus duration 7 gives EET 12 for the next activity I From G, EET 7 plus duration 3 gives EET 10 for the next activity I From F, EET 8 plus duration 3 gives EET 11 for the next activity I")
27
Critical Path Method (CPM) 100 202 507 7012 8015 306 408 605 A2A2 B4B4 D3D3 C5C5 E2E2 F3F3 G3G3 H7H7 I3I3 EET latest Choose the latest EET; need to wait until longest activity has finished EET 12 plus duration 3 gives 15 for the end of the project 11 10 12
 A2A2 B4B4 D3D3 C5C5 E2E2 F3F3 G3G3 H7H7 I3I3 EET latest Choose the latest EET; need to wait until longest activity has finished EET 12 plus duration 3 gives 15 for the end of the project")
28
Critical Path Method: Table ActivityDurationEETLETFloat / Slack A20 B42 C52 D32 E26 F38 G37 H75 I312

29
Backward Pass To determine the Latest Event Time (LET) Start at the end node LET = EET for the last node Subtract duration from connecting node’s Latest Event Time (LET) Rule: when several tasks converge, LET for the next task is the smallest of preceding LET
 Start at the end node LET = EET for the last node Subtract duration from connecting node’s Latest Event Time (LET) Rule: when several tasks converge, LET for the next task is the smallest of preceding LET")
30
Critical Path Method (CPM) 100 202 507 70 12,12 80 15,15 306 408 605 A2A2 B4B4 D3D3 C5C5 E2E2 F3F3 G3G3 H7H7 I3I3 EETLET LET 15 minus duration 3 gives LET 12 for activity I LET = EET for the end of the project 11 10 12
 , , A2A2 B4B4 D3D3 C5C5 E2E2 F3F3 G3G3 H7H7 I3I3 EETLET LET 15 minus duration 3 gives LET 12 for activity I LET = EET for the end of the project")
31
Critical Path Method (CPM) 100 202 50 7,9 70 12,12 80 15,15 306 40 8,9 60 5,5 A2A2 B4B4 D3D3 C5C5 E2E2 F3F3 G3G3 H7H7 I3I3 EETLET LET 12 minus duration 3 gives LET 9 for activity F LET 1 minus duration 3 gives LET 9 for activity G LET 12 minus duration 7 gives LET 5 for activity H 11 10 12
 , , , ,9 60 5,5 A2A2 B4B4 D3D3 C5C5 E2E2 F3F3 G3G3 H7H7 I3I3 EETLET LET 12 minus duration 3 gives LET 9 for activity F LET 1 minus duration 3 gives LET 9 for activity G LET 12 minus duration 7 gives LET 5 for activity H")
32
Critical Path Method (CPM) 100 20 2,2 50 7,9 70 12,12 80 15,15 30 6,7 40 8,9 60 5,5 A2A2 B4B4 D3D3 C5C5 E2E2 F3F3 G3G3 H7H7 I3I3 EETLET LET 7 minus duration 4 gives LET 3 for activity B LET 9 minus duration 5 gives LET 4 for activity C LET 5 minus duration 3 gives LET 2 for activity D 11 10 12 3 4 2
 ,2 50 7, , , ,7 40 8,9 60 5,5 A2A2 B4B4 D3D3 C5C5 E2E2 F3F3 G3G3 H7H7 I3I3 EETLET LET 7 minus duration 4 gives LET 3 for activity B LET 9 minus duration 5 gives LET 4 for activity C LET 5 minus duration 3 gives LET 2 for activity D")
33
Critical Path Method (CPM) 100 20 2,2 50 7,9 70 12,12 80 15,15 30 6,7 40 8,9 60 5,5 A2A2 B4B4 D3D3 C5C5 E2E2 F3F3 G3G3 H7H7 I3I3EETLET earliest Choose the earliest LET so that the longest activity will have enough time to finish 11 10 12 3 4 2
 ,2 50 7, , , ,7 40 8,9 60 5,5 A2A2 B4B4 D3D3 C5C5 E2E2 F3F3 G3G3 H7H7 I3I3EETLET earliest Choose the earliest LET so that the longest activity will have enough time to finish")
34
Critical Path Method (CPM) 10 0,0 20 2,2 50 7,9 70 12,12 80 15,15 30 6,7 40 8,9 60 5,5 A2A2 B4B4 D3D3 C5C5 E2E2 F3F3 G3G3 H7H7 I3I3EETLET LET 2 minus duration 2 gives LET 0 for the start of the project 11 10 12 3 4 2
 10 0,0 20 2,2 50 7, , , ,7 40 8,9 60 5,5 A2A2 B4B4 D3D3 C5C5 E2E2 F3F3 G3G3 H7H7 I3I3EETLET LET 2 minus duration 2 gives LET 0 for the start of the project")
35
Critical Path Method: Table ActivityDurationEETLETFloat / Slack A200 B423 C524 D322 E267 F389 G379 H755 I312

36
Critical Path Method (CPM) 10 00 0,0 20 22 2,2 50 79 7,9 70 12,12 80 1515 15,15 30 67 6,7 40 89 8,9 60 55 5,5 A2A2 B4B4 D3D3 C5C5 E2E2 F3F3 G3G3 H7H7 I3I3 EETLET Critical path longest The longest path through the network is shortesttime the shortest time the project can take The critical path is the path with any zero float; any delay will mean whole project the whole project will be late 11 10 12 3 4 2
 , , , , , , , ,5 A2A2 B4B4 D3D3 C5C5 E2E2 F3F3 G3G3 H7H7 I3I3 EETLET Critical path longest The longest path through the network is shortesttime the shortest time the project can take The critical path is the path with any zero float; any delay will mean whole project the whole project will be late")
37
Critical Path Method: Table ActivityDurationEETLETFloat / Slack A2000 B4231 C5242 D3220 E2671 F3891 G3792 H7550 I312 0

38
4 Task Dependency Types Mandatory Dependencies Hard logic dependencies Nature of the work dictates an ordering Eg: Coding has to precede testing Eg: UI design precedes UI implementation Discretionary Dependencies Soft logic dependencies Determined by Project Management Team Process – driven Eg: Discretionary order of creating certain modules

39
4 Task Dependency Types External Dependencies Outside of Project itself Eg: Release of 3 rd party product; contract signoff Eg: stakeholders, suppliers, Y2K, year end Resource Dependencies Two task rely on same resource Eg: You have only one DBA but multiple DB tasks

40
Task Dependency Relationships Finish – to – Start (FS) A relationship where the `From Activity` or Predecessor must finish before the `To Activity` or Successor can start. Finish to start is most common type of relationship, or dependency Activity On Arrow (AOA) use only Finish- to-Start dependency. Task (B) cannot start until Task (A) finishes
 use only Finish- to-Start dependency. Task (B) cannot start until Task (A) finishes.")
41
Task Dependency Relationships Finish – to – Start (FS) task Atask B task A must finish before task B can start May include lag and lead times in Finish- to-Start dependencies Lag is the delay between A finish and B start Lead time is negative lag (i.e. overlap) A: Construct fence; B: Paint Fence
 A: Construct fence; B: Paint Fence.")
42
Task Dependency Relationships Start – to – Start (SS) A relationship where From Activity or predecessor cannot start until TO Activity or Successor is start. ( i.e Project Activities starting Simultaneously) Task (B) cannot start until Task (A) Starts A: Pour foundation; B: Level concrete
 Task (B) cannot start until Task (A) Starts A: Pour foundation; B: Level concrete.")
43
Task Dependency Relationships Finish – to – Finish (FF) From Activity must be finished before To Activity can be finished. One task cannot be finished before other task. Task (B) cannot finish until Task (A) Finishes A: Add wiring; B: Inspect electrical
 cannot finish until Task (A) Finishes A: Add wiring; B: Inspect electrical.")
44
Task Dependency Relationships Start – to – Finish (SF) From Activity must be Started before To Activity can be finished. This type of relationship is rarely used. (e.g Manufacturing company must stock row materials just in time for manufacture process to begin. A delay in manufacture process starting should delay completion of stocking raw materials. Task (B) cannot finish until Task (A) starts (rare)
 cannot finish until Task (A) starts (rare).")
45
Dependencies Other constraints on tasks: before Task cannot start before a Specific Date by Task must finish by a Specific Date on Task must start on a Specific Date soon Task must start as soon as possible late Task must start as late as possible in parallel Task must run in parallel with another Task wait X days Task must wait X days after another task ends consecutive working days caution: these may be consecutive working days

46
Milestones Significant Events Significant Events in Project Plan Normally correspond to Key Deliverables Milestones and Dates are agreed with Key Stakeholders at Baseline Plan Stage fixed milestones often become fixed

47
PROGRAM EVALUATION REVIEW TECHNIQUE (PERT) One of the most difficult and most error prone activities when constructing a Project Schedule is the determination of the TIME DURATION for each task within a Work Breakdown Structure (WBS), specially when there is a high degree of complexity and uncertainty about a task. PERT is a technique used to calculate Expected Time for a tasks.

48
PERT Analysis PERT stands for Program Evaluation & Review Technique A way of modelling uncertainty when scheduling If used properly will lead to more stable schedules optimistic time optimistic time (o) if things go well most likely time most likely time (m) usually the original estimate pessimistic time pessimistic time (p) if it can go wrong, it will...
 if things go well most likely time most likely time (m) usually the original estimate pessimistic time pessimistic time (p) if it can go wrong, it will...")
49
PERT Analysis The expected time t e is calculated as: t e omp t e = [o + 4m + p] / 6 Our activity B has estimate of 4. Let us say: omp o = 3, m = 4, p = 11 t e = [3 + 16 + 11] / 6 t e = 30 / 6 t e = 5 Expected time t e is 5, longer than the most likely time
![PERT Analysis The expected time t e is calculated as: t e omp t e = [o + 4m + p] / 6 Our activity B has estimate of 4.](http://images.slideplayer.com/24/7093126/slides/slide_49.jpg "Let us say: omp o = 3, m = 4, p = 11 t e = [ ] / 6 t e = 30 / 6 t e = 5 Expected time t e is 5, longer than the most likely time.")
50
Constructing PERT 1.Identify each Project Activity to be completed 2.Determine Time estimates and calculate Expected Completion Time for each Activity 3.For each Activity, identify the immediate predecessor Activities 4.Enter the Activities with connecting arrows based on Dependencies and calculate Start and End times based on Duration and Resources.

51
PERT Chart Symbols PERT Chart is consisted of TASKS and EVENTS. An EVENT is called a Milestone, representing a point in time, such as Start or Completion of a Task. A circle or a Rectangle shape NODE is used to represent an EVENT. Every PERT Chart has one Beginning and one End NODE that represents the Start and Finish of a Project.

52
PERT Chart Symbols Earliest and Latest Time is both Zero in Starting Event. A TASK also called Activity, is depicted by an ARROW Connecting Events. A Dashed Arrow represents a DUMMY TASK which is the dependency between two events without requiring any resource.

53
PERT Chart Symbols Slack Time:- Slack Time available for any Task is equal to difference between Earliest Event Time (EET) and Latest Event Time (LET) SLACK TIME = (LET – EET)
 and Latest Event Time (LET) SLACK TIME = (LET – EET)")
54
PERT Chart Symbols Critical Path:- Is a sequence of Dependent Tasks that have the Largest sum of Estimated Time (ET). It is the Path that has no Slack Time built in. Critical Path on PERT chart is shown with thick Dark line. To find Critical Path begin with identifying all alternative paths that exist from Event 1 to Final Event.

55
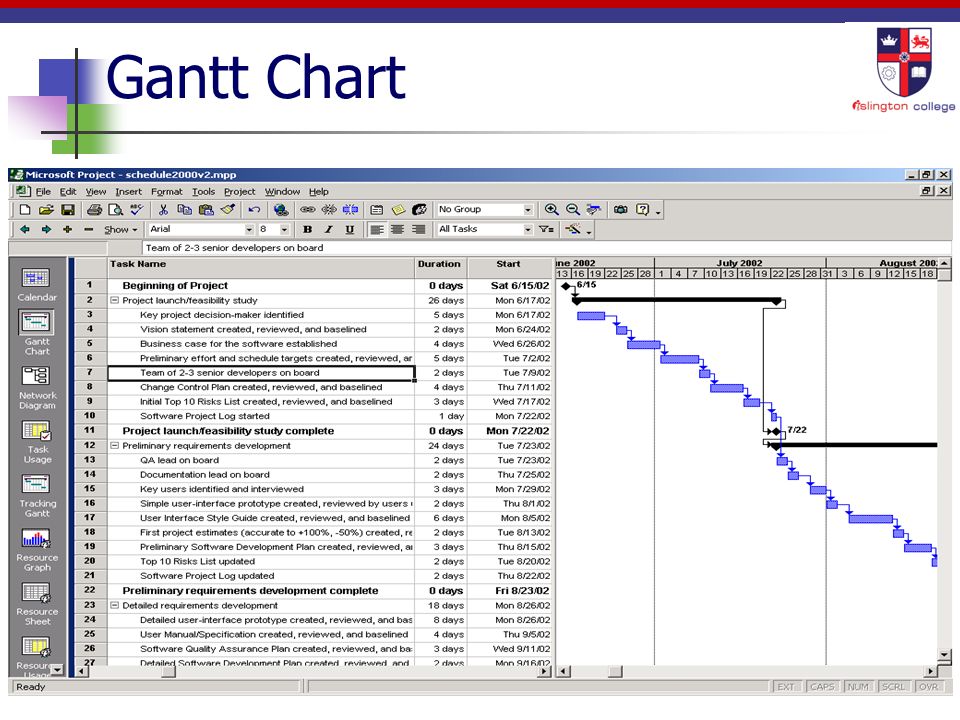
Gantt Chart Devised by Henry Gantt (early 1900’s) Block representation of tasks Length of task bar proportional to duration Each start / end time represented by task bar Graphical representation of project Can translate network diagram into Gantt chart Easy to read
 Block representation of tasks Length of task bar proportional to duration Each start / end time represented by task bar Graphical representation of project Can translate network diagram into Gantt chart Easy to read")
56
Gantt Chart

58
Time line: week 1week 2week 3week 4week 5week 6week 7week 8week 9 week 10 Activities: Request Jones paper Request Smith paper Review Jones paper review Smith paper Interview subjects set q's for questionnaire issue questionnaire Analyse data from q'naire have report proof read Write report Submit report Can set questions while requesting and reviewing papers Might not need two full weeks

59
Gantt Chart Time line: week 1week 2week 3week 4week 5week 6week 7week 8week 9 week 10 Activities: Request Jones paper Request Smith paper Review Jones paper review Smith paper Interview subjects set q's for questionnaire issue questionnaire Analyse data from q'naire have report proof read Write report Submit report Might be able to start this task early ...and finish early

60
Gantt Chart Time line: week 1week 2week 3week 4week 5week 6week 7week 8week 9 week 10 Activities: Request Jones paper Request Smith paper Review Jones paper review Smith paper Interview subjects set q's for questionnaire issue questionnaire Analyse data from q'naire have report proof read Write report Submit report Might not have to start this task straight away Might want to delay while doing other things

61
Gantt Chart Time line: week 1week 2week 3week 4week 5week 6week 7week 8week 9 week 10 Activities: Request Jones paper Request Smith paper Review Jones paper review Smith paper Interview subjects set q's for questionnaire issue questionnaire Analyse data from q'naire have report proof read Write report Submit report Might be able to set questions in the middle of the time slot

62
Gantt Chart Time line: week 1week 2week 3week 4week 5week 6week 7week 8week 9 week 10 Activities: Request Jones paper Request Smith paper Review Jones paper review Smith paper Interview subjects set q's for questionnaire issue questionnaire Analyse data from q'naire have report proof read Write report Submit report Questionnaire must be prepared before it can be issued

63
Time line: week 1week 2week 3week 4week 5week 6week 7week 8week 9 week 10 Activities: Request Jones paper Request Smith paper Review Jones paper review Smith paper Interview subjects set q's for questionnaire issue questionnaire Analyse data from q'naire have report proof read Write report Submit report Questionnaire must be issued & returned before results can be analysed Gantt Chart

64
Time line: week 1week 2week 3week 4week 5week 6week 7week 8week 9 week 10 Activities: Request Jones paper Request Smith paper Review Jones paper review Smith paper Interview subjects set q's for questionnaire issue questionnaire Analyse data from q'naire have report proof read Write report Submit report Analyse data before interviewing subjects Gantt Chart

65
Time line: week 1week 2week 3week 4week 5week 6week 7week 8week 9 week 10 Activities: Request Jones paper Request Smith paper Review Jones paper review Smith paper Interview subjects set q's for questionnaire issue questionnaire Analyse data from q'naire have report proof read Write report Submit report Interview subjects before writing report Gantt Chart

66
Gantt Chart in MS Project

67
Gantt Chart In their basic form Gantt charts: Do not explicitly show logical dependencies Do not optimise resources and costs Do not display current progress But... Are simple to read

68
68 Gantt Chart in MS Project

69
Resource Histogram Identifies resource requirements over time Helps to identify peak resource requirements Helps to identify unnecessary peaks and troughs (resource smoothing: keep within limits) Commonly used to analyse staff resource levels
 Commonly used to analyse staff resource levels")
70
Resource Histogram

71
upper limit of staff resources Resource Histogram

72
upper limit of staff resources Resource Histogram

73
A new MS Access/Visual Basic system for a retail company Duration: requirements capture:2 weeks development:8 weeks acceptance testing:2 weeks Containment Action Plan

74
Sequence of Activities Requirements Capture Development Acceptance 2 Weeks8 Weeks2 Weeks Project will last 12 weeks (i.e. 2 + 8 + 2)
.")
75
What is the Risk? 90% chance There is an 90% chance that this length of time is insufficient because the MS Access specialist may be required to support a project of higher priority. If this were to happen, the 8 weeks scheduled for development would then extend to 10 weeks 2 week delay i.e. a 2 week delay 7 person-weeks with 7 person-weeks further effort

76
Including Element of Risk RCDevelopmentAcceptance Risk: 2 week over-run 2 Weeks8 Weeks (10%)2 Weeks 90% 10% 2 Weeks 7 Person Weeks Project will last 12 weeks (10%) or 14 weeks (90%) 10 Weeks (90%)
2 Weeks 90% 10% 2 Weeks 7 Person Weeks Project will last 12 weeks (10%) or 14 weeks (90%) 10 Weeks (90%)")
77
Expected value of additional duration = 0.9 * 2 = 1.8 weeks This evaluates the 90% chance of a 2 week delay Expected value of additional effort = 0.9 * 7 = 6.3 person-weeks This evaluates the 90% chance of a further 7 person-weeks Containment Calculation

78
in parallel 1 extra week reduce the risk to 25% 2person-weeks A 3-week training course in parallel (i.e. 1 extra week) with the requirements capture would reduce the risk to 25% with an additional 2 person-weeks effort Draw a diagram to show the containment action and recalculate the revised impact on effort and duration Containment Action Plan
 with the requirements capture would reduce the risk to 25% with an additional 2 person-weeks effort Draw a diagram to show the containment action and recalculate the revised impact on effort and duration Containment Action Plan.")
79
RCDevelopmentAcceptance 2 Weeks 25% 75% 2 Weeks 7 Person-weeks Course 3 Week course extra 1 extra Week 2 Person-weeks Risk: 2 week over-run Project will last 13 weeks (75%) or 15 weeks (25%) 8 Weeks (75%) 10 Weeks (25%) Containing Risk
 or 15 weeks (25%) 8 Weeks (75%) 10 Weeks (25%) Containing Risk")
80
Expected value of additional duration = 1 + (0.25 * 2) = 1.5 weeks This evaluates extra week on course, plus reduced risk of 25% of a 2 weeks delay Expected value of additional effort = 2 + (0.25 * 7) = 3.75 person-weeks This evaluates extra 2 person-weeks on the course, plus the reduced risk of 25% of a further 7 person-weeks Containment Calculation
 = 1.5 weeks This evaluates extra week on course, plus reduced risk of 25% of a 2 weeks delay Expected value of additional effort = 2 + (0.25 * 7) = 3.75 person-weeks This evaluates extra 2 person-weeks on the course, plus the reduced risk of 25% of a further 7 person-weeks Containment Calculation")
81
Dealing with risk Would you book the course? What other factors need to be considered? Which course you would book? and Why? How would the diagram look if the course before is before Requirements Capture? between is between Requirements Capture and Development?

82
Any Questions?

Similar presentations