Download presentation
Presentation is loading. Please wait.

1
The Decline of the UUP?: an electoral analysis

2
Main Research Questions
What individual characteristics (background, attitudinal) best predict support for the UUP in the Assembly Elections of 2001 [NI Election Study] What aggregate characteristics (census, electoral, Orange) best predict support for the UUP in District Council elections, [Ecological Regression] Is there an 'Orange vote' and which party benefits [Ecological Regression]
 best predict support for the UUP in the Assembly Elections of 2001 [NI Election Study] What aggregate characteristics (census, electoral, Orange) best predict support for the UUP in District Council elections, [Ecological Regression] Is there an Orange vote and which party benefits [Ecological Regression]")
7
Attitudes to Integration

8
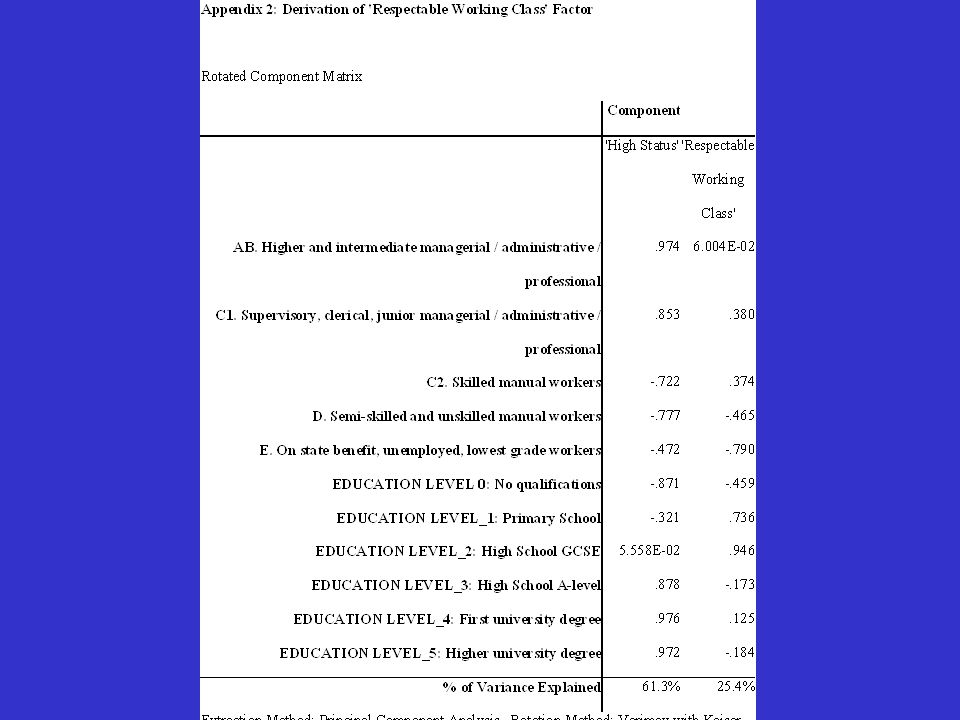
The Importance of Ideology over Class

10
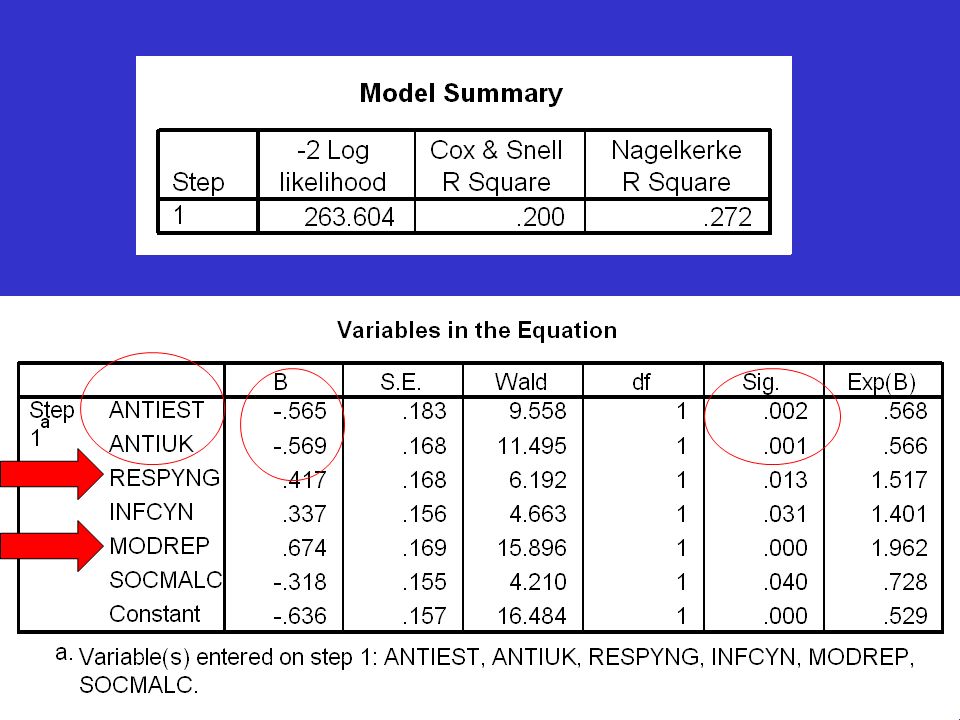
Moderate Republicans

11
Anti-UK Govt/Anti-Labour

12
Anti-Establishment

13
Respectful Young Integrationists

14
Influential Male Cynics

15
Dissatisfied Social Services

16
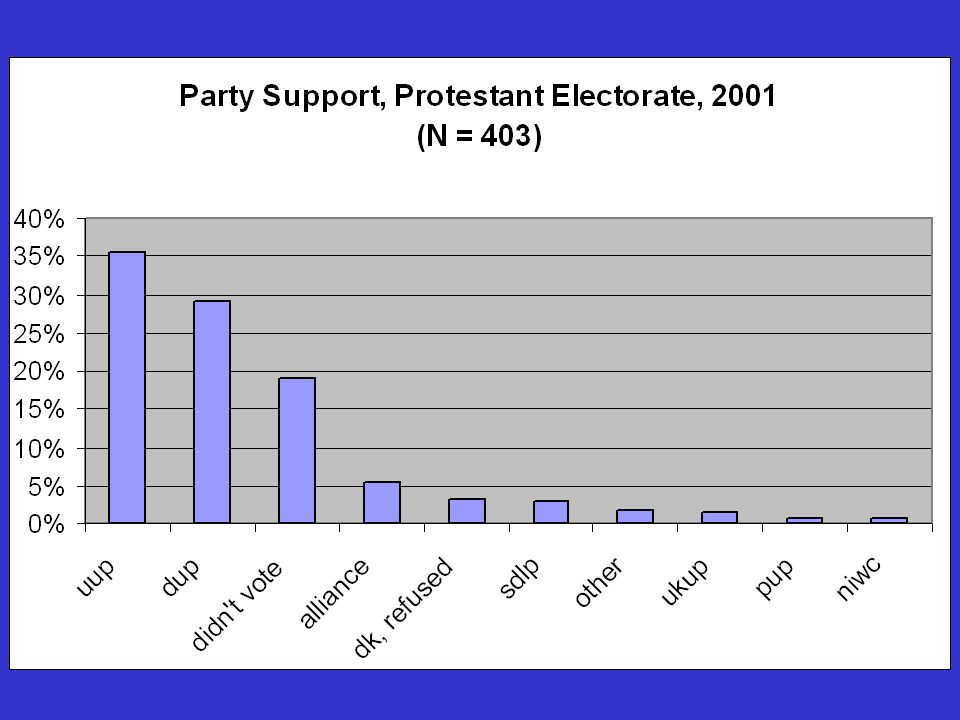
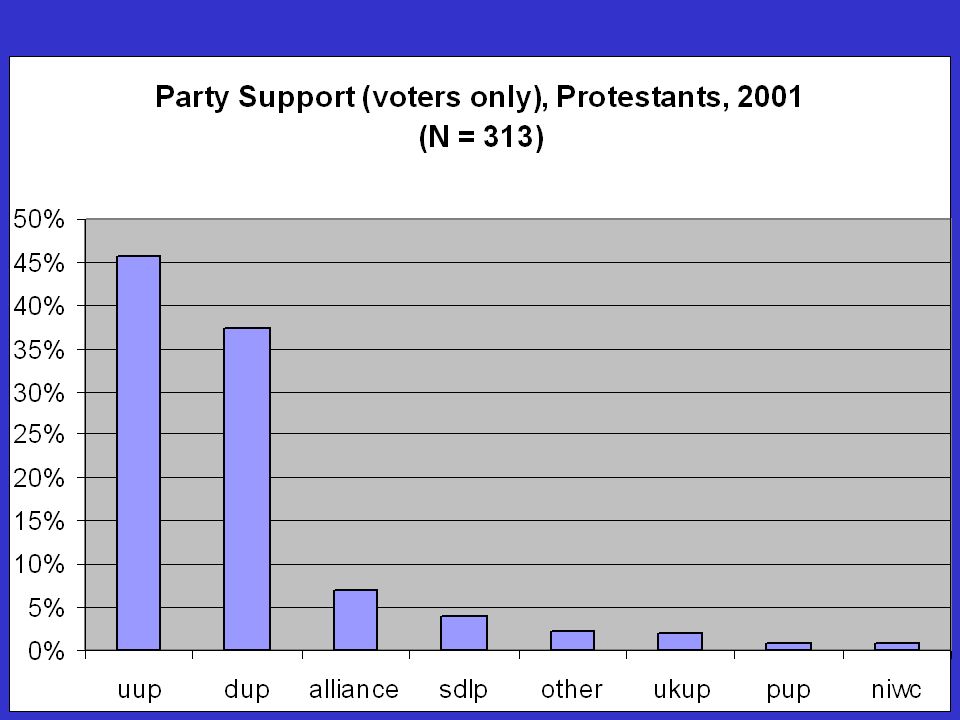
2001 Election Study Findings (Protestants)
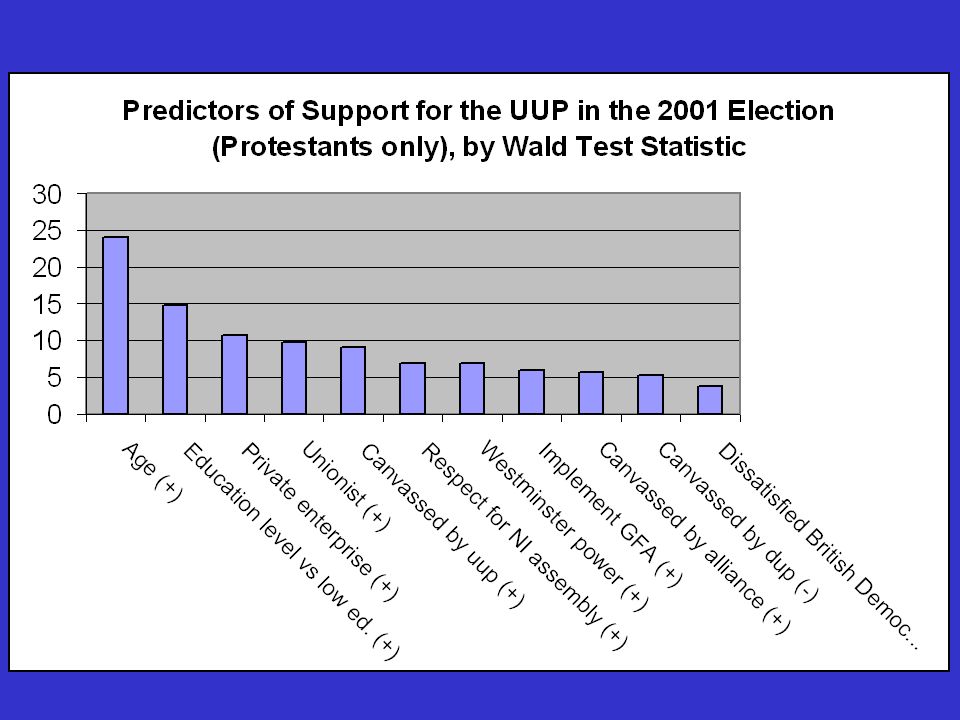
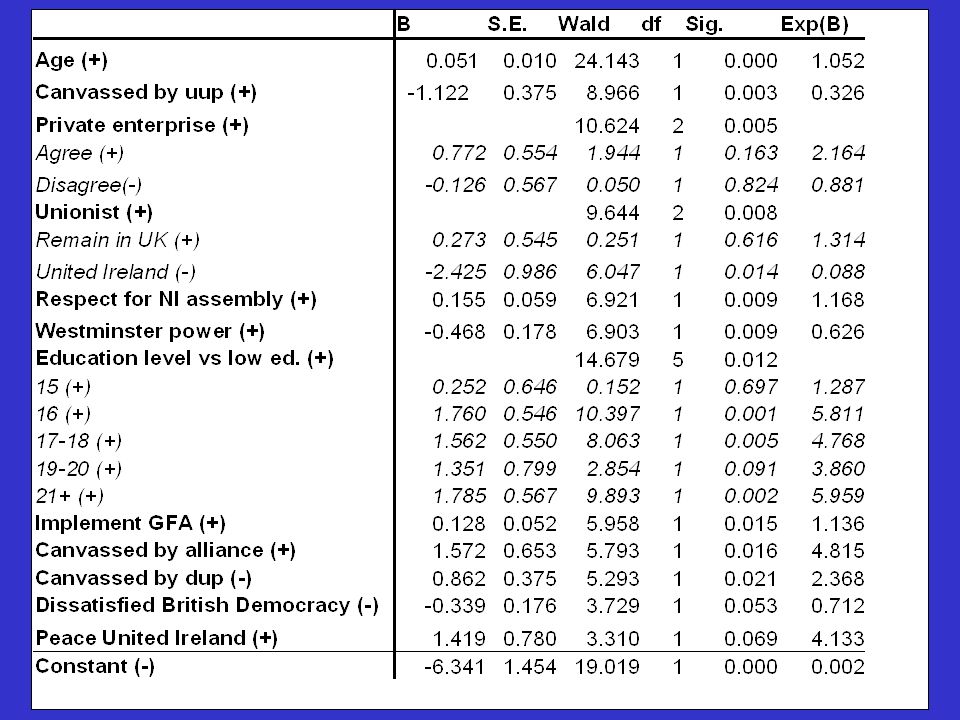
Self-Identified Protestants participate at same level as Catholics Age by far the strongest predictor of UUP vote, esp vs cohorts Education level more important than income or class for a pro-UUP vote Anti-Establishment feeling very important for anti-UUP vote

17
Survey Summary Factors associated with a deferential, traditional political culture play a central role in UUP support De-traditionalisation and cohort replacement will make UUP resurgence more difficult Liberal ('civic unionist') support is important, but this cannot compensate for loss of traditional UUP base
 support is important, but this cannot compensate for loss of traditional UUP base.")
18
Age and the Ulster Unionist Council: the Orange Order Leadership vs
Age and the Ulster Unionist Council: the Orange Order Leadership vs. UUC Orange members 48% of Orange officebearers are under 40 while just a quarter of Orange UUC members are under 45 29% of Orange officebearers over 50, while 66% of UUC Orange members were over 55 UUC is far more elite in terms of social status (wealth, education) than the Order or the Unionist Community
 than the Order or the Unionist Community.")
19
UUP share of Protestant vote at District Council level

22
Church of Ireland % of Protestants, 1991 (by DC)
")
23
Orange Order Lodges & Density 1991

24
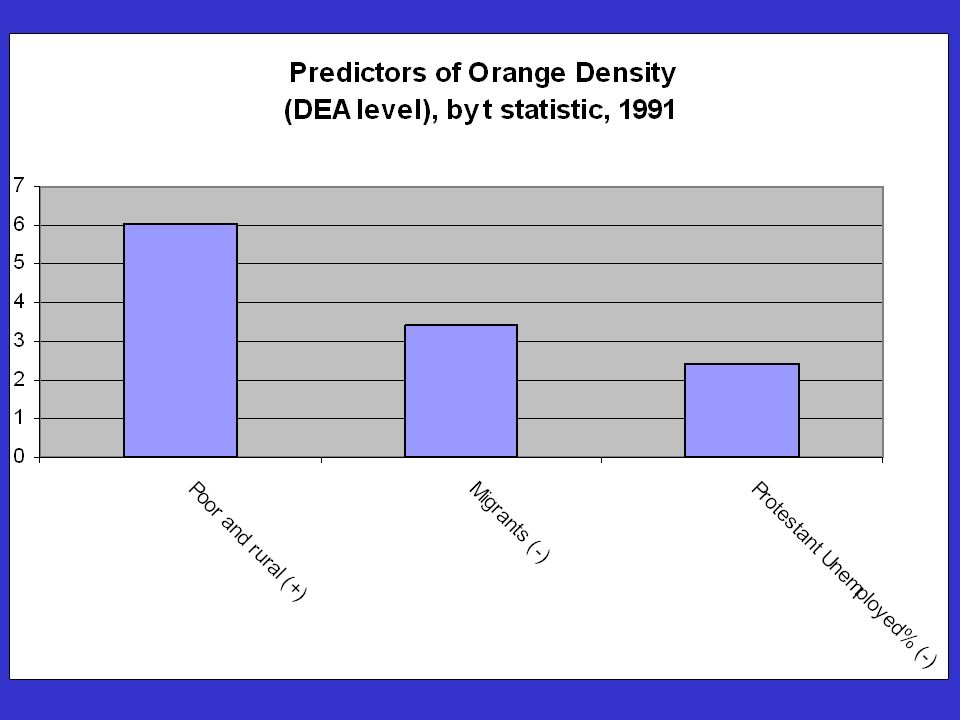
Orange Order Density 1991

28
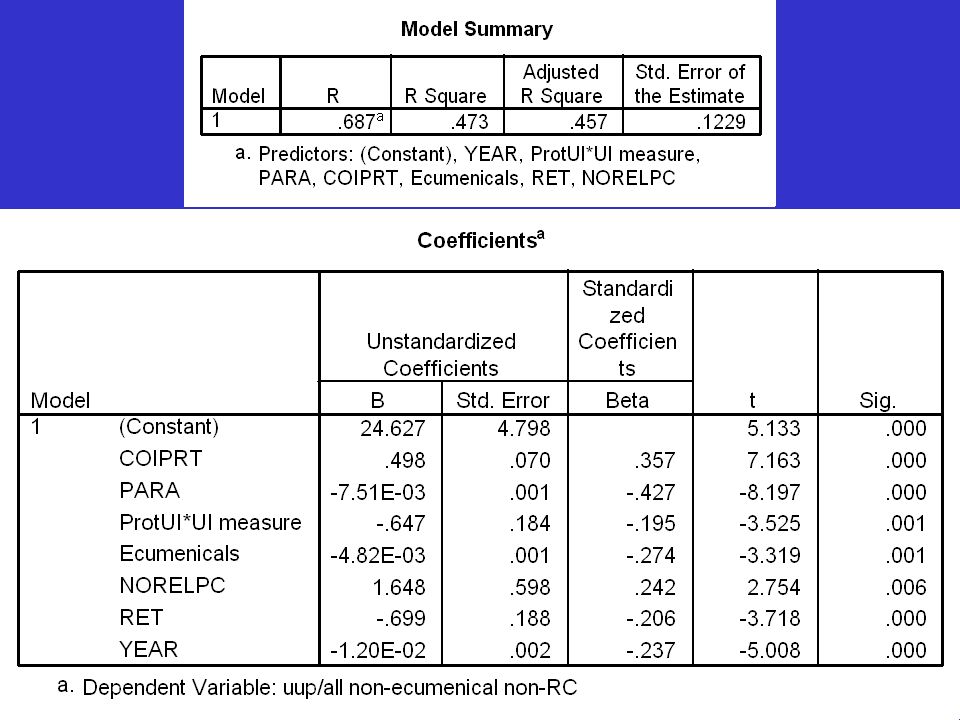
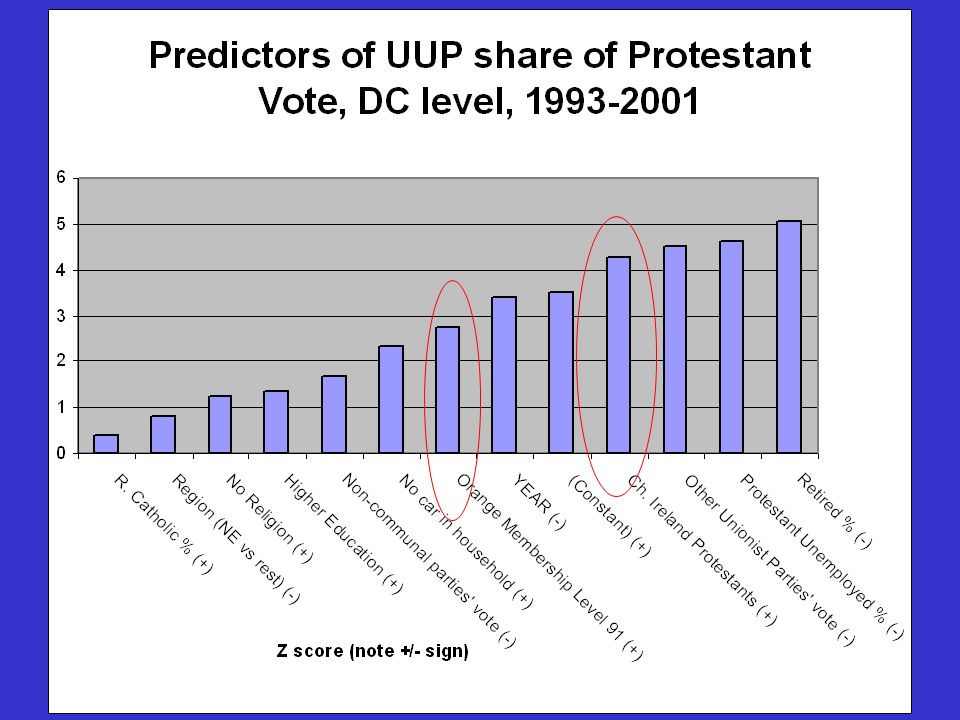
Determinants of UUP Constituencies, 1993-2001 (by z score)
")
29
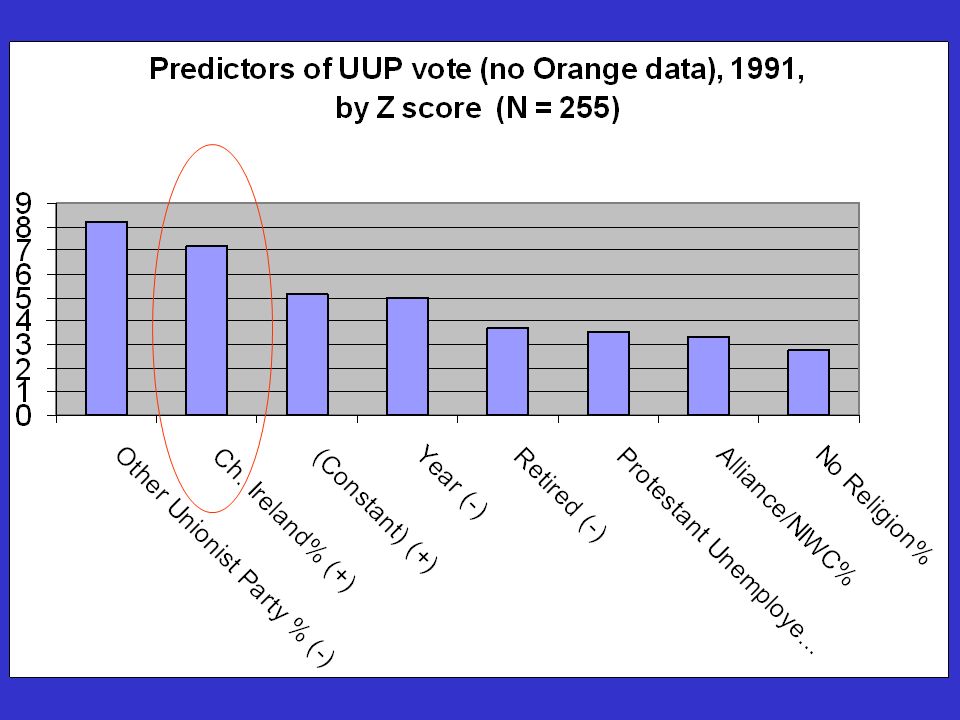
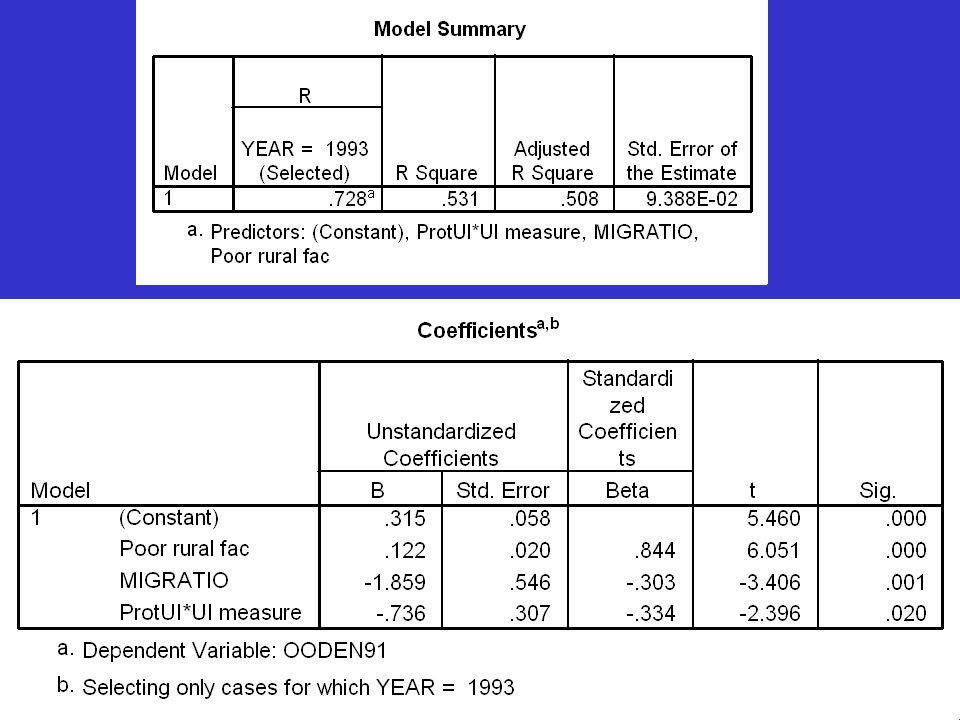
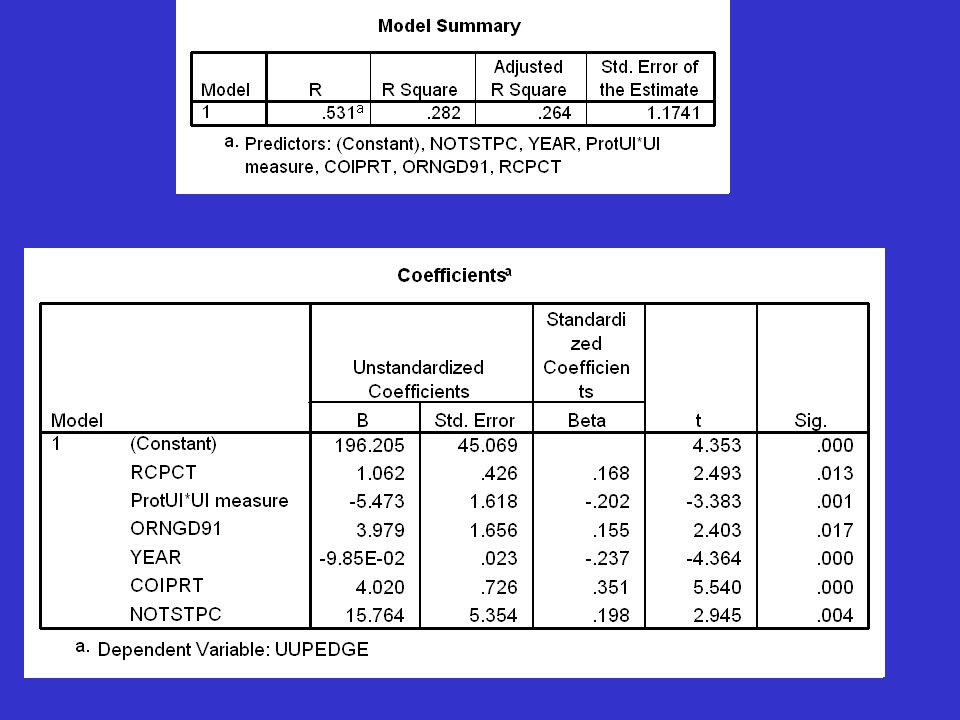
Predictors of UUP vote, 1993-2001 (with Orange density), N = 165
, N = 165")
30
The Role of Context Areas of High Protestant Unemployment are likely to be young and anti-Elite in attitude Church of Ireland and Orange counties and councils may be more deferential for historical reasons (these forces may once have shaped local political cultures) Less clear that they do so today.
 Less clear that they do so today.")
31
Conclusion Importance of 'traditional' vs 'modern' divide (i.e. Older Generation, Church of Ireland, Respect for Institutions and leaders) 'Civic Unionist' segment exists in metropolitan Belfast but does not counterbalance de-traditionalisation in UUP/DUP voting calculus

32
Traditionalists (Orange & Other), Co. Tyrone
, Co. Tyrone")
33
Orange Skeptics & Liberal Civics (East Belfast)
")
34
Non-Orange Skeptics: Protestant Working-Class Area,
Co. Armagh

35
http://www.kpdata.com/epk/index.html (Follow link 1)
END (Follow link 1)
")
38
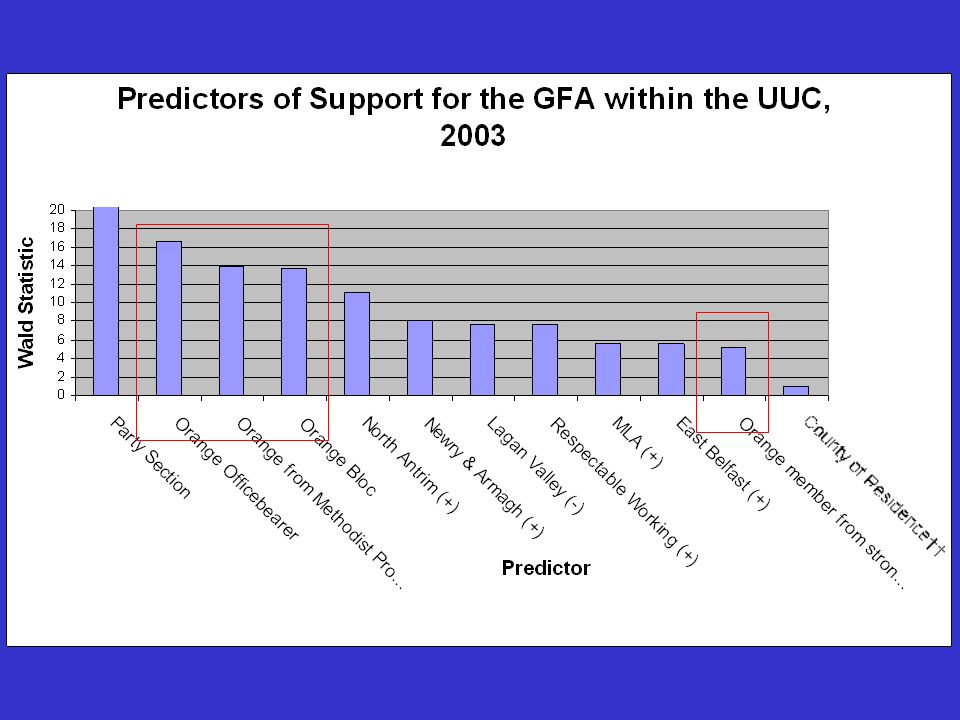
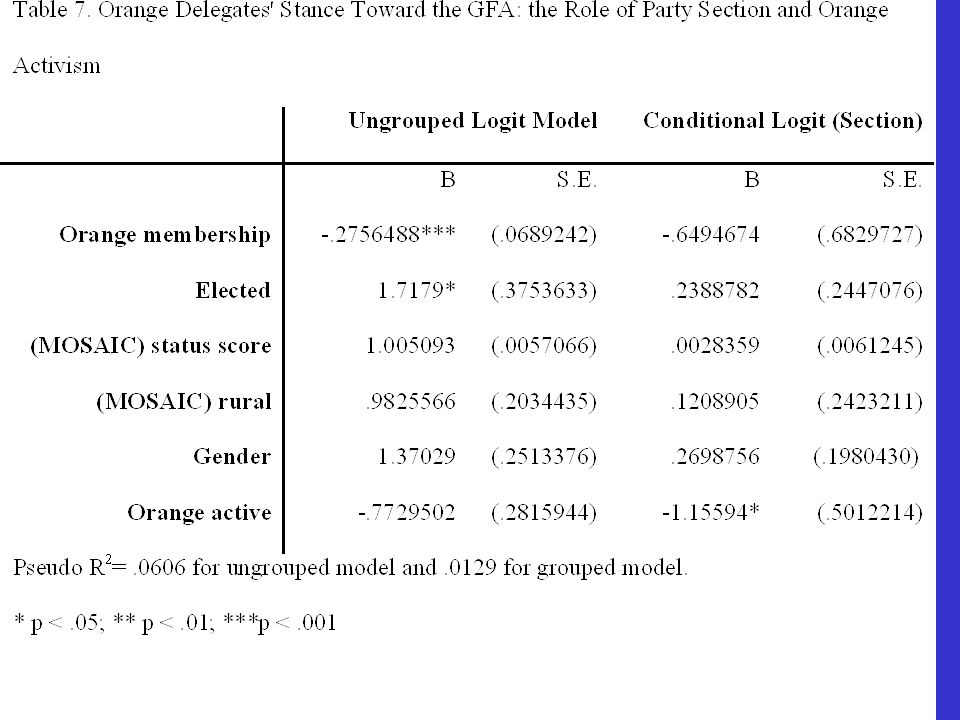
Findings: Individual Orange and MLA status are the most important individual characteristics Rural, Gender, Title, Education and Status unimportant Age may be important

39
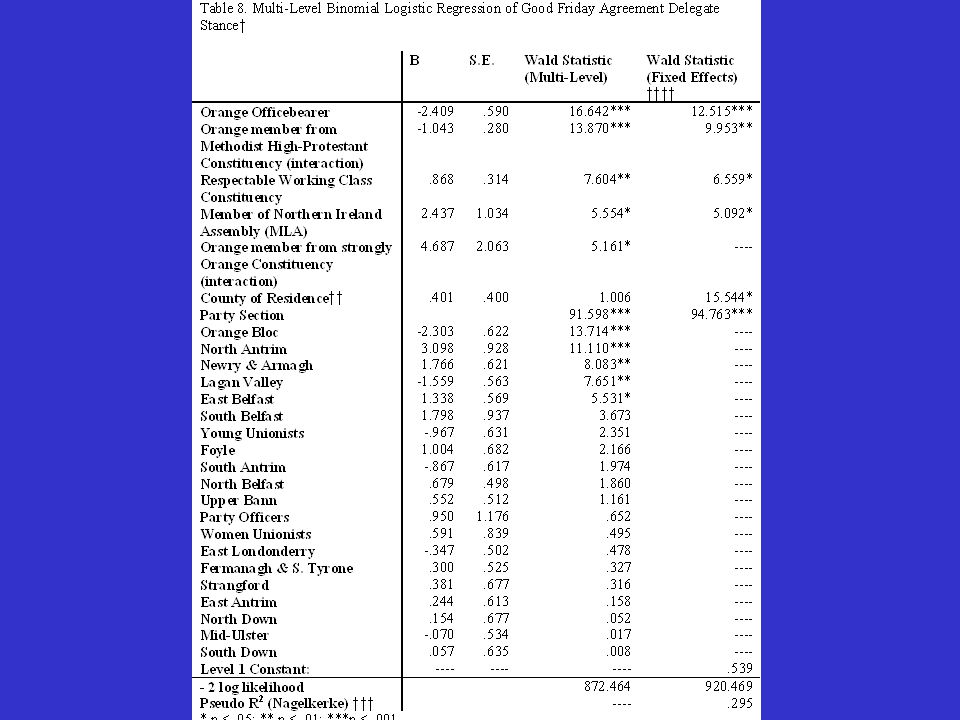
Findings: Contextual Contextual factors explain most of the variance (party section, geography of residence) Sectional splits and Geographic splits within the Orange Order are critical Big difference between UUC delegates who happen to be Orange and those who represent the Orange

40
Conclusion Implications of breaking UUC-Orange link
'Orange skeptics' vs. 'rational civics' idea needs to be contextualised to official Orangeism - esp. in Belfast & Antrim Importance of 'traditional' vs 'modern' divide (i.e. West Bann Orangemen, respectable working-class constituencies)
")
41
Differences in Stance within the Orange UUC

42
Orange Traditionalists or Orange Skeptics
Orange Traditionalists or Orange Skeptics?: the complex social base of Pro-Agreement Unionism

43
Main Research Questions
What is the social profile of the UUC and how does this differ from that of the Orange Order and the Unionist community as a whole Which factors best predict support for the Good Friday Agreement within the UUC? What are the characteristics of pro-UUP constituencies, [time permitting]

44
UUC Social Profile: Previous Survey Research
Late 2000 Survey of UUC (Tonge & Evans 2001; 2002). 1/3 response rate Social Profile in terms of age, education, gender, income, occupation, county of residence Showed that roughly half the UUC were Orange members
. 1/3 response rate. Social Profile in terms of age, education, gender, income, occupation, county of residence. Showed that roughly half the UUC were Orange members.")
45
Research Strategy We add contextual factors to the analysis
Party List (gender, title, postcode, section) Strategists assign vote (pro/anti-GFA) MOSAIC classifications assigned to party members NI MOSAIC score 1-27 (status), (rural) MOSAIC group and score used in multi-level and fixed-effects logistic regressions
 Strategists assign vote (pro/anti-GFA) MOSAIC classifications assigned to party members. NI MOSAIC score 1-27 (status), (rural) MOSAIC group and score used in multi-level and fixed-effects logistic regressions.")
46
The Social Profile of the UUC and Orange Order
by MOSAIC Classification (99% sample) % Top 12 Rural 8 Bottom 7 Nonrural Top 12 Nonrural Bottom 7 N Freemason officebearers 67.8% 15.5% 8.0% 80.2% 9.4% 766 Orange bloc UUC delegates 45.7% 36.2% 12.4% 71.6% 19.4% 105 UUC delegates total 44.3% 35.9% 8.4% 69.0% 13.1% 879 Grand Orange Lodge officebearers 34.7% 44.4% 9.7% 62.5% 17.5% 144 Northern Ireland population average 32.5% 18.1% 22.9% 39.6% 27.9% 1.6m Orange Order (lodge) officebearers 32.4% 43.9% 57.7% 22.1% 1429
 % Top 12. Rural 8. Bottom 7. Nonrural Top 12. Nonrural Bottom 7. N. Freemason officebearers. 67.8% 15.5% 8.0% 80.2% 9.4% 766. Orange bloc UUC delegates. 45.7% 36.2% 12.4% 71.6% 19.4% 105. UUC delegates total. 44.3% 35.9% 8.4% 69.0% 13.1% 879. Grand Orange Lodge officebearers. 34.7% 44.4% 9.7% 62.5% 17.5% 144. Northern Ireland population average. 32.5% 18.1% 22.9% 39.6% 27.9% 1.6m. Orange Order (lodge) officebearers. 32.4% 43.9% 57.7% 22.1%")
47
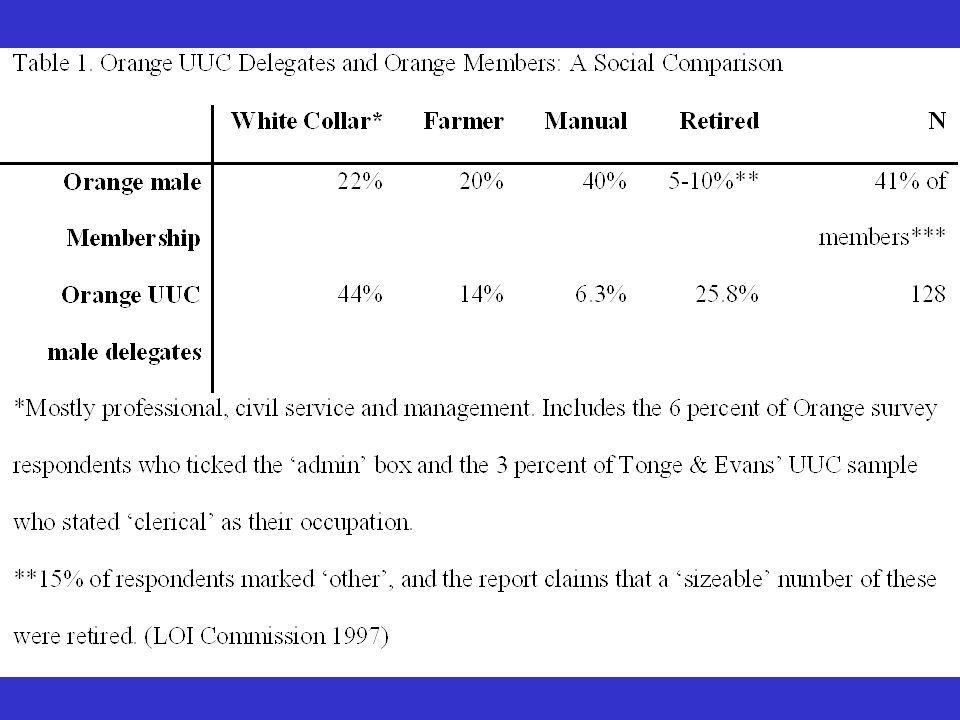
Occupation: Orange Order versus Orange UUC Delegates

48
Age: Orange Order Leadership vs. the Orange UUC
48% of Orange officebearers are under 40 while just a quarter of Orange UUC members are under 45 29% of Orange officebearers over 50, while 66% of UUC Orange members were over 55

49
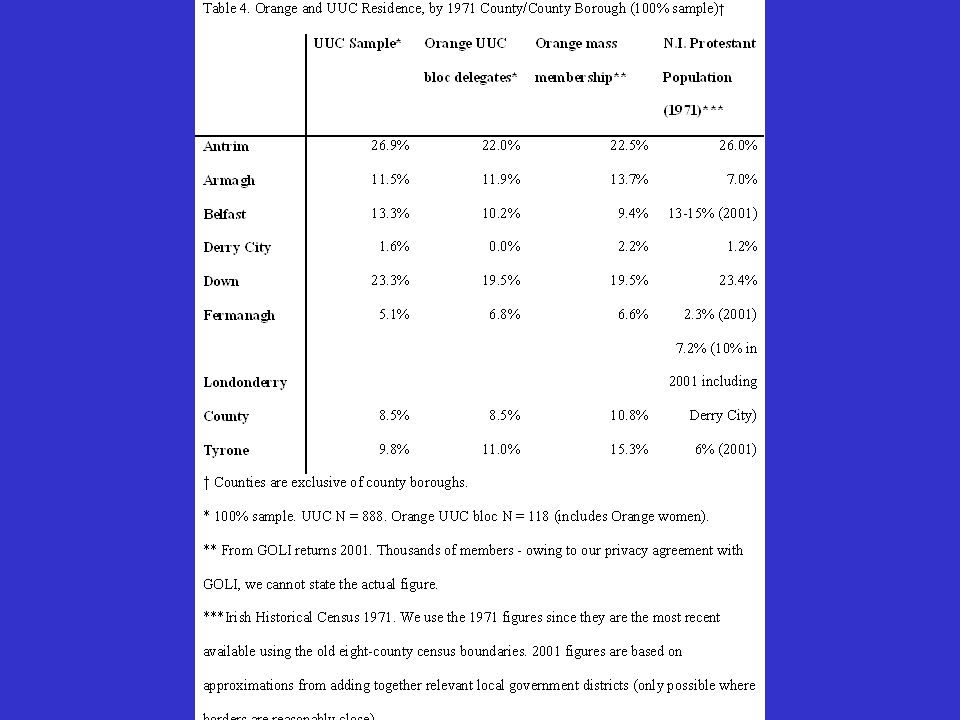
The Regional Base of the UUC

50
Findings: Social Profile
Major status difference between Orange leadership/membership and Orange UUC delegates UUC profile is elderly and elite Explains why Protestant alienation from the UUP may be greater than from the Orange Explains why many Orange leaders and a majority of the membership wish to break the link with the UUC while Orange UUC delegates do not

51
GFA Voting Dynamics: Previous Survey Research
Orange Order membership and age were clearly important (p < .001) Much unexplained: R2 = .1 predicting 1998 vote and .03 in predicting 'Vote Today' Concluded that division lay between 'Orange skeptics' and 'rational civics'
 Much unexplained: R2 = .1 predicting 1998 vote and .03 in predicting Vote Today Concluded that division lay between Orange skeptics and rational civics")
52
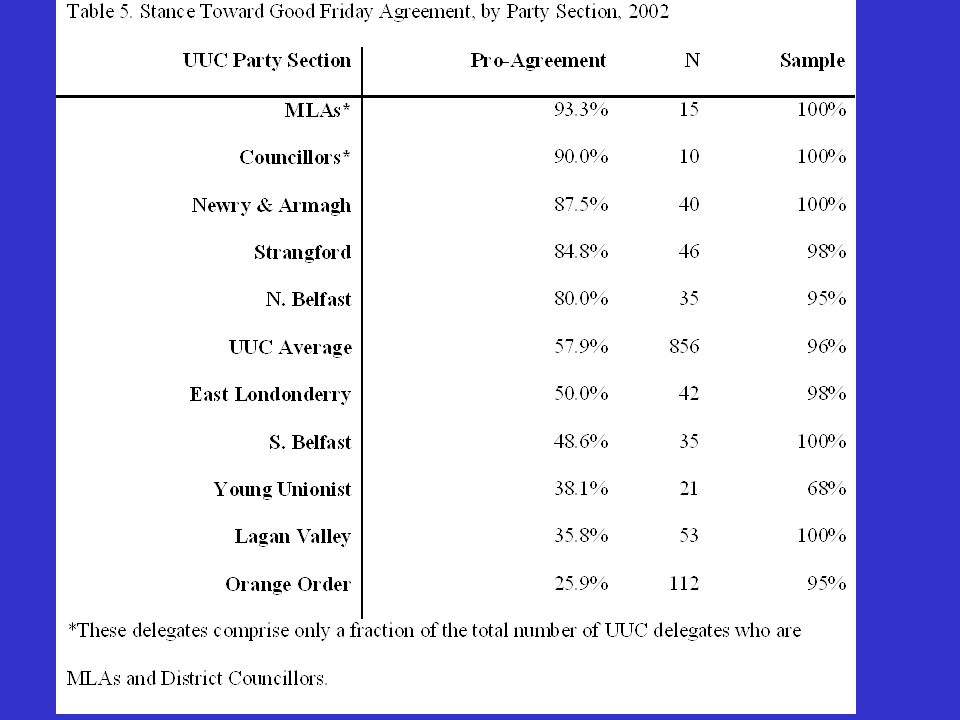
Support for the Agreement by UUP Constituency Association, c. 2002

53
UUC Constituency Profile: Rural

54
UUC Constituency Profile: Status

55
Table 2: UUC Social Profile (Party Section), by MOSAIC Classification (99% sample)
% Top 12 % Rural % Bottom 7 % Nonrural Top 12 % Nonrural Bottom 7 N East Belfast 81.6% 0.0 % 0.0% 38 North Down 74.3% 5.7% 11.4% 78.8% 12.1% 34 South Antrim 63.8% 23.4% 6.4% 83.3% 8.3% 47 MLAs 60.0% 28.0% 8.0% 11.1% 25 Strangford 59.6% 21.3% 10.6% 75.7% 13.5% UUC total 44.3% 35.9% 8.4% 69.0% 13.1% 879

56
Orange/Non-Orange Differential in Support for the Agreement

57
Orange/Non-Orange Differential in Support for the Agreement

Similar presentations