Download presentation
Presentation is loading. Please wait.

2
EU Funding 2014-20 Andrew Pritchard Director of Policy & Infrastructure

3
Introduction Why are we here? Localisation of EU Funding Emerging UK Priorities & Outcomes The role of LEPs Timescales

4
Why are we here? One of 6 events to help local organisations prepare for the next round of EU funding 2014-19 Part of a technical assistance project led by East Midlands Councils to provide an evidence base for future EU funding To make sure that we maximise the potential of EU investment

5
Localisation of EU funding Establishment of a national ‘EU Growth Programme’ LEPs to develop EU investment strategies Each LEP to be given a ‘notional allocation’ of EU funding to prioritise Payments to be made centrally Notional allocations will be reviewed against performance from 2017 onwards

6
GLLEP EU National Allocation = €133.5 million UK Local Growth Fund Allocation = tbc

7
Emerging UK Priorities Innovation SME Competitiveness ICT 45% + of ERDF Employment Skills Social Inclusion 70% + of ESF Climate Change Environment Sustainable Transport No Minimum spend Low Carbon Economy 15% + of ERDF

8
Also… Minimum 20% of combined ESF/ERDF on ‘social inclusion’ Gender equality, equal opportunities & non- discrimination Sustainable development

9
Key Outcomes “It’s the economy, stupid” More Jobs Less Worklessness

10
The Role of LEPs To develop a local EU Investment Strategy To prioritise projects against a notional allocation of EU funds To maximise the impact of EU investment in their areas To work with other LEPs to achieve economies of scale wherever possible

11
Timescales September 2013: Draft LEP EU Investment Strategies January 2014: finalise strategies March 2014: new EU Programme starts 2017 – first review of notional allocations

12
Your mission today… To think about how best EU funding could be used to address market failures. To highlight areas or issues where wider collaboration might be helpful. To ask if you do not understand.

14
East Midlands PA3 Project Socio-Economic Evidence – the future of European Funds in Greater Lincolnshire 1 st July, 2013 Chris Lawton Nottingham Business School

15
Project Rationale and Objectives The project aims to provide socio-economic evidence to help identify synergies, linkages and common challenges across LEPs within or overlapping the East Midlands To identify opportunities for collaboration across the themes identified in the ‘Europe 2020’ strategy The UK Government would: “like to see Local Enterprise Partnerships working with each other to deliver a bigger impact… and achieve economies of scale wherever possible” Source: HM Government, April 2013. ‘Technical Annex: Preliminary guidance to Local Enterprise Partnerships on development of Structural & Investment Fund Strategies.’ paragraph 2.8, p. 4.

16
Contains Ordnance Survey data © Crown copyright and database right, 2013. Local Enterprise Partnerships within or overlapping the East Midlands Region

17
Chart 1: Headline GVA per head indices (UK=100) NUTS2, 2011 Economic Context Source: ONS Crown Copyright, 2012. ‘Regional Gross Value Added, 2011’.

18
Economic Context Source: ONS Crown Copyright, 2013. ‘Annual Population Survey’, January-December 2008 and January-December 2012. From NOMIS [accessed 24 th June, 2013]. Chart 2:Employment rate (% working age residents), 2012
,")
19
The SME environment remains difficult, but some signs of improvement: – Business death rates have fallen since 2009 and business birth rates have increased – Survival rates for new businesses have significantly decreased since pre-recession – Small businesses (<50 employees) have been more likely to retain staff but cut/freeze wages and investment, with resulting lost productivity – Large businesses (>250) more likely to cut staff whilst maintaining investment and productivity levels Lenders report that demand for credit remains low Despite some structural improvements, firms seeking credit continue to report difficulties in the supply of finance Exports have been growing moderately in recent months EU Thematic Objective: SME Competitiveness
 have been more likely to retain staff but cut/freeze wages and investment, with resulting lost productivity – Large businesses (>250) more likely to cut staff whilst maintaining investment and productivity levels Lenders report that demand for credit remains low Despite some structural improvements, firms seeking credit continue to report difficulties in the supply of finance Exports have been growing moderately in recent months EU Thematic Objective: SME Competitiveness")
20
Chart 3: Business Births and Deaths (as a % of end-of-year count of active enterprises), 2011 Source: ONS Crown Copyright, 2012. ‘Business Demography 2011 – Enterprise Births, Deaths and Survivals.’ EU Thematic Objective: SME Competitiveness

21
SME Competitiveness: Business Birth Rate (as a % of end- of-year count of active enterprises), 2011 Source: ONS Crown Copyright, 2012. ‘Business Demography 2011 – Enterprise Births, Deaths and Survivals.’ Contains Ordnance Survey data © Crown copyright and database right, 2013.

22
Chart 4: Two year business survival rate from year of birth (%) EU Thematic Objective: SME Competitiveness Source: ONS Crown Copyright, 2012. ‘Business Demography 2011 – Enterprise Births, Deaths and Survivals.’

23
Chart 5: Innovation inputs: Business Enterprise Investment in R&D (as a % of total workplace GVA), 1999 and 2009 EU Thematic Objective: Innovation Source: Department for Business, Innovation and Skills, 2012. ‘Regional Economic Performance Indicators – Live Tables’.

24
EU Thematic Objective: Innovation Chart 6: Employment in High and Medium-High Technology Industries (% work- based employment), 2011 Source: ONS Crown Copyright, 2012. ‘Business Register and Employment Survey, 2011.’ Data accessed from NOMIS [17 th June, 2013] and analysed under Chancellor’s Notice Ref NTCBRES11-P0537.

25
Innovation: Employment in High and Medium-High Technology Industries (%), 2011 Source: ONS Crown Copyright, 2012. ‘Business Register and Employment Survey, 2011.’ Data accessed from NOMIS [17 th June, 2013] and analysed under Chancellor’s Notice Ref NTCBRES11-P0537. Contains Ordnance Survey data © Crown copyright and database right, 2013.

26
EU Thematic Objectives: Employment, Social Inclusion and Skills Chart 7: Unemployment Rate (% 16+ resident population), 2012 Source: ONS Crown Copyright, 2013. ‘Annual Population Survey’, January-December 2012. From NOMIS [accessed 14 th June, 2013].

27
Employment, Social Inclusion and Skills: Unemployment – model-based estimates (%), 2012 Source: ONS Crown Copyright, 2012. ‘Model-based estimates of unemployment’, January-December 2012. From NOMIS [accessed 17 th June, 2013]. Contains Ordnance Survey data © Crown copyright and database right, 2013.

28
EU Thematic Objectives: Employment, Social Inclusion and Skills Chart 8: Trends in the Unemployment Rate (% 16+ resident population), 2007-2012 Source: ONS Crown Copyright, 2013. ‘Annual Population Survey’, January-December 2007 to January-December 2012. From NOMIS [accessed 14 th June, 2013].

29
Employment, Social Inclusion and Skills: Resident Adults Qualified to a Level 4 (first degree) and above (%), 2012 Source: ONS Crown Copyright, 2012. ‘Annual Population Survey’, January-December 2012. From NOMIS [accessed 17 th June, 2013]. Contains Ordnance Survey data © Crown copyright and database right, 2013.

30
Key Points Some improvements (e.g. business births and deaths), but overall economic context remains challenging North-south or east-west divides (depending on topic) exacerbated by the recession: – Unemployment/Social Exclusion: north-south divide – Enterprise and Skills: north-south and east-west – Innovation: east-west (M1 corridor) Importance of manufacturing and large firms in regional innovation activity Enterprise, innovation and low-carbon themes will be explored further in x2 regional round-tables
, but overall economic context remains challenging North-south or east-west divides (depending on topic) exacerbated by the recession: – Unemployment/Social Exclusion: north-south divide – Enterprise and Skills: north-south and east-west – Innovation: east-west (M1 corridor) Importance of manufacturing and large firms in regional innovation activity Enterprise, innovation and low-carbon themes will be explored further in x2 regional round-tables.")
31
Common Issues: Greater Lincolnshire Local Enterprise Partnership SME CompetitivenessInnovationEmployment, Social Inclusion and Skills Leicester & Leicestershire, SEM and NEP – pockets of high business birth rates (but note higher death rates in Greater Lincolnshire) Construction – important employer across the East Midlands D2N2 – High-tech manufacturing in Lincoln: investigate common strengths and supply chain relationships with D2N2 (including Low Carbon/ links with energy sector) Leicester & Leicestershire and GCGP – Food & Drink Sheffield City Region, GCGP and D2N2 – significantly increasing unemployment rates in more isolated rural areas. Persistently higher than average unemployment in urban centres such as Lincoln and Grimsby GCGP – coastal concentration of very low skill levels, especially Boston and Fenland districts

32
Greater Lincolnshire LEP Emerging priorities

33
Background Role: lobby, support, deliver Support and commissioning role for SIs Board members want focused approach Infrastructure and catalyst projects Activity based on our competitive advantage

34
Progress Invest To Grow business loan fund Regional Growth Fund Growth Ambitions 2013 document Preparation to growth plan Business/stakeholder engagement

35
Beware Strategy-itis Mission creep Lack of detail Direct economic outputs v catalyst projects Regulations and the private sector

36
Vision to 2030

37
Summary Strong opportunities to match fund Emphasis on sectors and business Sense of place likely to emerge Two “asks” of government on SIs: Infrastructure and catalyst projects Business-friendly approach to applicants

38
Experience from current programmes

39
Lincolnshire Higher Skills The NE Group Spencer Prewett Chief Executive

40
Predominantly ERDF 20,000 SMEs Supported 250 New Business Start Ups 1,000 Jobs Created 2,500+ Individuals Assisted to Employment 400 Grants Issued 800 Business Increasing ICT Usage History & Track Record

41
Skills development in SMEs missing Established a Training Division Developed training partnerships Established Social Media Network Organisation Needs Analysis Identification of Key Worker Targeted training ESF Involvement

42
Flexible approach Business responsive service Individual responsive service Linking needs of both Enabled growth of both Continuity and sustainability 180 SMEs engaged 170 Individuals trained ESF Ability

43
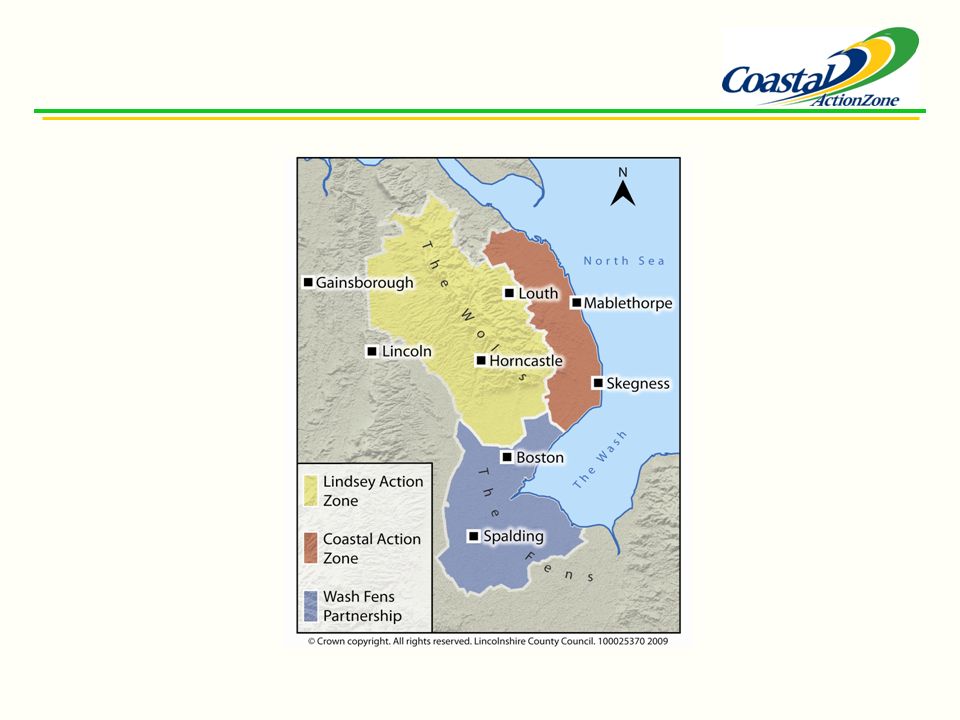
Rural Development 1 st July 2013 Coastal Action Zone Local Action Group www.coastal-rdpe.co.uk

45
CAZ RDPE Programme 2007 -2013 The creation of a quality coastal environment Aims Linking community and landscape on the Lincolnshire coast to realise the natural assets of the area, without compromising sustainable development principles. Issues Seasonality Poor Economic Performance Under Achievement Landscape

46
Five key objectives with priorities Productive coastal landscapes - Farm Diversification Enhancing coastal competitiveness - Microenterprise Development A quality coastal destination - Tourism Cherishing coastal capital - Rural heritage (Natural & Cultural) Building coastal capacity - Training and Information Cross cutting themes - Innovation and Sustainability
 Building coastal capacity - Training and Information Cross cutting themes - Innovation and Sustainability")
47
Successes Individual projects delivered more than one objective and sustainability - Increased quality self catering cottages, improving farm viability and micro-enterprises, creating wildlife habitat - Enhancing and improving the landscape and rural heritage, career development - Building local community capacity and contributing to the area and its economy The projects supported were robust as they could be Sustainability Networking and co-operation - Engagement with main business support prorammes to strengthen projects - Local involvement with initiatives and organisations - Developing Partnership working going into the new programme period

48
Lessons learnt Use local knowledge and experience Be realistic with priorities Consider a ‘tool kit’ of delivery mechanisms Be proactive with partnership working Be innovative

Similar presentations


 Informing.>")


