Download presentation
Presentation is loading. Please wait.

1
Human Population

2
Dr. Isaac Asimov (in this 1966 interview he predicted that world population would reach 6 billion near the year 2000. We passed the 6 billion mark in October 1999.) Dr. Isaac Asimov (in this 1966 interview he predicted that world population would reach 6 billion near the year 2000. We passed the 6 billion mark in October 1999.) " Which is the greater danger - nuclear warfare or the population explosion? The latter absolutely! To bring about nuclear war, someone has to DO something; someone has to press a button. To bring about destruction by overcrowding, mass starvation, anarchy, the destruction of our most cherished values-there is no need to do anything. We need only do nothing except what comes naturally - and breed. And how easy it is to do nothing." " Which is the greater danger - nuclear warfare or the population explosion? The latter absolutely! To bring about nuclear war, someone has to DO something; someone has to press a button. To bring about destruction by overcrowding, mass starvation, anarchy, the destruction of our most cherished values-there is no need to do anything. We need only do nothing except what comes naturally - and breed. And how easy it is to do nothing."
 Dr. Isaac Asimov (in this 1966 interview he predicted that world population would reach 6 billion near the year We passed the 6 billion mark in October 1999.) Which is the greater danger - nuclear warfare or the population explosion. The latter absolutely. To bring about nuclear war, someone has to DO something; someone has to press a button. To bring about destruction by overcrowding, mass starvation, anarchy, the destruction of our most cherished values-there is no need to do anything. We need only do nothing except what comes naturally - and breed. And how easy it is to do nothing. Which is the greater danger - nuclear warfare or the population explosion. The latter absolutely. To bring about nuclear war, someone has to DO something; someone has to press a button. To bring about destruction by overcrowding, mass starvation, anarchy, the destruction of our most cherished values-there is no need to do anything. We need only do nothing except what comes naturally - and breed. And how easy it is to do nothing. .")
3
LINEAR vs. EXPONENTIAL

4
http://www.ined.fr/en/everything_about_population/animations/world_population/
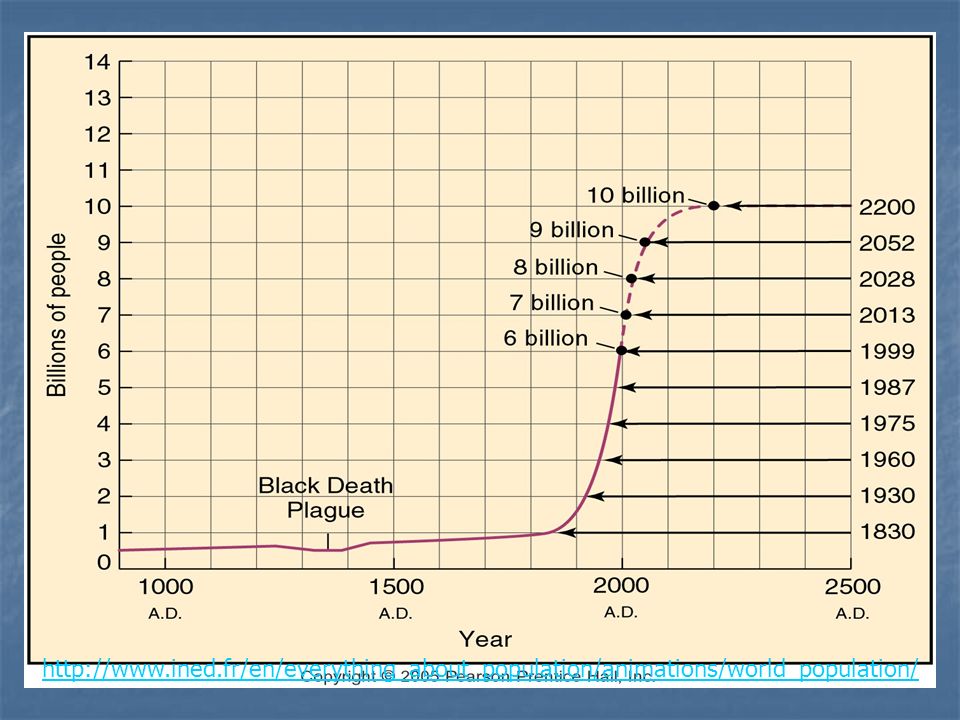
5
1 2 3

6
Countries and Areas Ranked by Population: 2009 Countries and Areas Ranked by Population: 2009 Rank Country or Area Population Rank Country or Area Population 1 China 1,338,612,968 1 China 1,338,612,968 2 India 1,156,897,766 2 India 1,156,897,766 3 United States 307,212,123 4 Indonesia 240,271,522 5 Brazil 198,739,269 6 Pakistan 174,578,558 7 Bangladesh 156,050,883 8 Nigeria149,229,090 9 Russia140,041,247 10Japan127,078,679 237 Pitcairn Islands48

7
Demography The study of the size, composition, & distribution of human populations and consequences of changes in these characteristics. The study of the size, composition, & distribution of human populations and consequences of changes in these characteristics.

8
2009 Population Growth Rates United States = 0.98% United States = 0.98% China growth rate = 0.66% China growth rate = 0.66% India growth rate = 1.41% India growth rate = 1.41% Kenya growth rate = 2.69% Kenya growth rate = 2.69% How to use this number: Multiply the country’s current population by this number to see next year’s population total How to use this number: Multiply the country’s current population by this number to see next year’s population total

9
Rule of 70 Determines how many years it will take a population to double in size. Determines how many years it will take a population to double in size. 70 = 70 = % growth rate % growth rate EX: % growth rate for world is = 1.13% EX: % growth rate for world is = 1.13% 70 = 61 years 70 = 61 years 1.41 1.41

10
ZPG Zero Population Growth Zero Population Growth Birth = Death Birth = Death Immigrants = Emigrants Immigrants = Emigrants Population growth rate = 0% Population growth rate = 0% The Earth’s Goal for all countries The Earth’s Goal for all countries Japan is actually declining in population Japan is actually declining in population Annual growth rate = -0.13 Annual growth rate = -0.13

11
Earth’s Human Annual Rate of Population Change 1963 = 2.2% 1963 = 2.2% 2009 = 1.13% 2009 = 1.13% Rate of the world’s population is slowing, BUT population went from 3.2 billion to 6.7 billion during this time! Rate of the world’s population is slowing, BUT population went from 3.2 billion to 6.7 billion during this time! Developing Countries = 1.46% Developing Countries = 1.46% Developed Countries = 0.25% Developed Countries = 0.25% Fastest growing countries: Fastest growing countries: INDIA, KENYA, PAKISTAN, NIGERIA, BANGLADESH, & INDONESIA. INDIA, KENYA, PAKISTAN, NIGERIA, BANGLADESH, & INDONESIA. http://www.ined.fr/en/everything_about_population/animations/world_population/

12
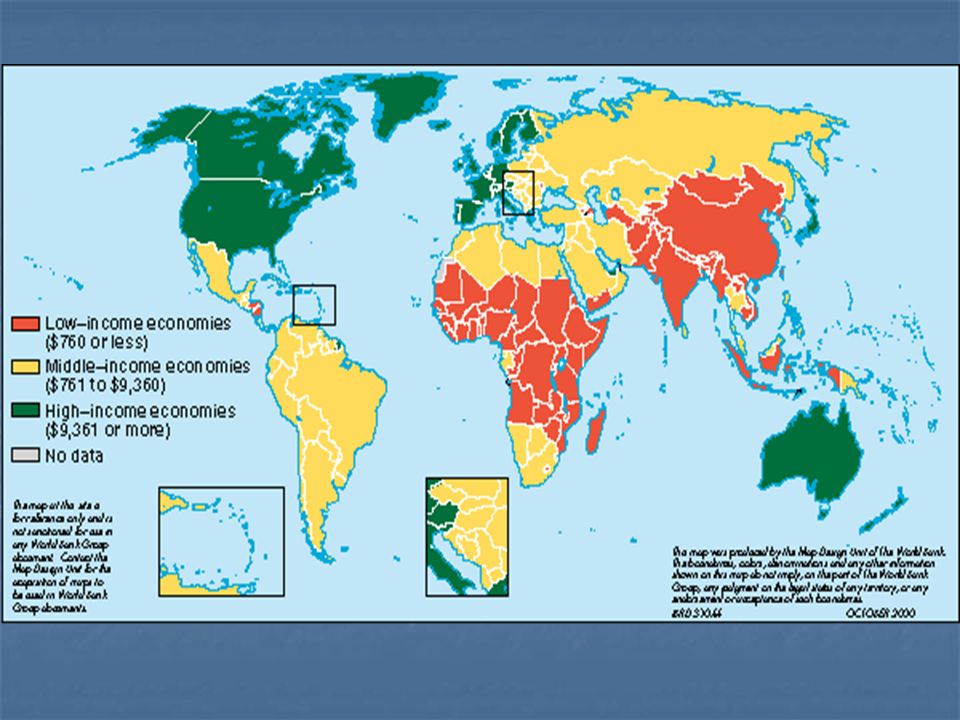
Developing vs. Developed Countries

13
GDP GDP = Gross Domestic Product GDP = Gross Domestic Product Goods & services provided within a country Goods & services provided within a country Per Capita GDP = GDP divided by total population Per Capita GDP = GDP divided by total population Assumes each person gets equal share Assumes each person gets equal share

14
Developing Countries Per capita GDP <$4,000 Per capita GDP <$4,000 Low to moderate industrialization Low to moderate industrialization Rural, agricultural, illiterate, poor Rural, agricultural, illiterate, poor 80% of world’s population 80% of world’s population 50% of population is under age 15 50% of population is under age 15 15% of wealth 15% of wealth 10-20% of resource usage 10-20% of resource usage

15
List of Least Developed Countries UN 2008 1. Afghanistan 2. Angola 3. Bangladesh 11. Chad 17. Ethiopia Per capita GDP $700 (‘03) $700 (‘03) $1900 (‘04) $1900 (‘04) $1900 (‘03) $1900 (‘03) $1200 (‘03) $1200 (‘03) $700 (‘03) $700 (‘03)
 $700 (‘03) $1900 (‘04) $1900 (‘04) $1900 (‘03) $1900 (‘03) $1200 (‘03) $1200 (‘03) $700 (‘03) $700 (‘03).")
16
Reasons for Large Families in Developing Countries Old age security Old age security Infant and childhood mortality rates Infant and childhood mortality rates Children are an economic asset Children are an economic asset Grow food, gather fuel, tend livestock, beg, carry water Grow food, gather fuel, tend livestock, beg, carry water

17
Developed Country Per capita GDP >$4,000 Per capita GDP >$4,000 Highly industrialized Highly industrialized Urban, industrial, educated, & wealthy Urban, industrial, educated, & wealthy 20% of world’s population 20% of world’s population 85% of wealth 85% of wealth 80 - 90% of resource usage 80 - 90% of resource usage

18
Per capita GDP (2008) #1 - Liechtenstein #1 - Liechtenstein #3 - Norway$87,070 #3 - Norway$87,070 #14 – United States $47,763 #14 – United States $47,763 #25 – Canada - $41,730 #25 – Canada - $41,730 #74 – Mexico - $9,980 #74 – Mexico - $9,980 #127 – China - $2,940 #127 – China - $2,940 #163 – India - $1,070 #163 – India - $1,070
 #1 - Liechtenstein #1 - Liechtenstein #3 - Norway$87,070 #3 - Norway$87,070 #14 – United States $47,763 #14 – United States $47,763 #25 – Canada - $41,730 #25 – Canada - $41,730 #74 – Mexico - $9,980 #74 – Mexico - $9,980 #127 – China - $2,940 #127 – China - $2,940 #163 – India - $1,070 #163 – India - $1,070")
20
Population Increase in Developed and Developing Countries Where should we implement mechanisms to slow population growth?

21
Fertility Rates

22
What’s this showing?

23
Global Fertility Rates Fertility Fertility # of births that occur to an individual woman in a population. # of births that occur to an individual woman in a population. Replacement Level Fertility Replacement Level Fertility # of children needed to replace their parents # of children needed to replace their parents Projected number... “should have” Projected number... “should have” Total Fertility Rate (TFR) Total Fertility Rate (TFR) Average # of children that a woman has during her fertile years. Average # of children that a woman has during her fertile years. Actual, real number…”does have” Actual, real number…”does have”
 Total Fertility Rate (TFR) Average # of children that a woman has during her fertile years. Average # of children that a woman has during her fertile years. Actual, real number… does have Actual, real number… does have .")
24
Global Fertility Rates Replacement Level Fertility Rates (1997) Replacement Level Fertility Rates (1997) Developed countries = 2.1 children Developed countries = 2.1 children Developing countries = 2.5 children Developing countries = 2.5 children (Since some baby girls die before they reproduce, the number is slightly greater than two.) (Since some baby girls die before they reproduce, the number is slightly greater than two.) Also, not every woman has a child Also, not every woman has a child Total Fertility Rates (TFR) (1997) Total Fertility Rates (TFR) (1997) World Average = 3.0 children World Average = 3.0 children Developed = 1.6 children Developed = 1.6 children 2.5 children in 1950. 2.5 children in 1950. Developing = 3.4 children Developing = 3.4 children 6.5 children in 1950. 6.5 children in 1950.

25
TFR Africa has the highest in world Africa has the highest in world U.S. has had higher than most developed countries: U.S. has had higher than most developed countries: Large # of baby boomers = moms Large # of baby boomers = moms Increased number of unmarried mothers Increased number of unmarried mothers Increased fertility rates in some racial/ethnic groups Increased fertility rates in some racial/ethnic groups Legal/illegal immigrants Legal/illegal immigrants (11% of population are foreign born. (NOVA 2007) (11% of population are foreign born. (NOVA 2007)
 (11% of population are foreign born. (NOVA 2007).")
26
Factors Affecting Birth & Fertility Rates Increasing Factors Increasing Factors Children in labor force Children in labor force Rural areas Rural areas Lack of birth control Lack of birth control Religious/cultural values against birth control Religious/cultural values against birth control Lack of abortion access Lack of abortion access Younger than 25 at marriage Younger than 25 at marriage Few jobs for women Few jobs for women Lack of educational opportunities Lack of educational opportunities Decreasing Factors Decreasing Factors Low infant mortality rate Low infant mortality rate Educational & job opportunities for women Educational & job opportunities for women Affluence Affluence Cost of raising children Cost of raising children Urbanization Urbanization Older than 25 at marriage Older than 25 at marriage Availability of pension systems Availability of pension systems

27
Fertility Rate and Income

28
Contraceptive Use and Fertility Rates

29
Measures of Overall Health Life expectancy Life expectancy Average # of years a newborn can expect to live Average # of years a newborn can expect to live Developed countries = 71 years (1997); 77 (2007) Developed countries = 71 years (1997); 77 (2007) Developing countries = 62 years (1997); 64.5 (2007) Developing countries = 62 years (1997); 64.5 (2007) Infant Mortality Rate Infant Mortality Rate # of babies out of every 1,000 who die before their first birthday. # of babies out of every 1,000 who die before their first birthday. Reflects a country’s level of nutrition & health care Reflects a country’s level of nutrition & health care Single best measure of a society’s quality of life. Single best measure of a society’s quality of life.

30
Factors Affecting Death Rates Population increase over the past 100 years most influenced by the decrease in death rates! Population increase over the past 100 years most influenced by the decrease in death rates! Better food supplies & distribution Better food supplies & distribution Better nutrition Better nutrition Better water supplies Better water supplies Advances in medicine & sanitation Advances in medicine & sanitation

31
MIGRATION Is not always voluntary Is not always voluntary Involuntary displacement by: Involuntary displacement by: Armed conflict Armed conflict Environmental degradation Environmental degradation Natural disaster Natural disaster

32
Know the differences. Match Population growth rate Population growth rate IMR IMR ZPG ZPG Rule of 70 Rule of 70 TFR TFR Replacement fertility Replacement fertility 1. How many kids the moms in a pop are having 2. How many infants die per 1000 born 3. Uses current growth rate to estimate when pop will double 4. Multiply the total # of people in the population by this number to project future pop 5. Population is stable. B = D 6. How many kids the moms in a pop have to have to keep the numbers the same

33
Know the differences. 4. Population growth rate 2. IMR 5. ZPG 3. Rule of 70 1. TFR 6. Replacement fertility How many infants die per 1000 born How many infants die per 1000 born Population is stable. B = D Population is stable. B = D Uses current growth rate to estimate when pop will double Uses current growth rate to estimate when pop will double How many kids the moms in a pop are having How many kids the moms in a pop are having How many kids the moms in a pop have to have to keep the numbers the same How many kids the moms in a pop have to have to keep the numbers the same Refers to actual number of births (or deaths) that occur per 1000 people Refers to actual number of births (or deaths) that occur per 1000 people
 that occur per 1000 people Refers to actual number of births (or deaths) that occur per 1000 people.")
34
Population Age Structure

35
Age Structure Diagrams The % of males & females in the total population divided by age groups: The % of males & females in the total population divided by age groups: 0 - 14 yrs = Pre-Productive ages 0 - 14 yrs = Pre-Productive ages 15 - 44 yrs = Reproductive ages 15 - 44 yrs = Reproductive ages 45 - older yrs = Post-Reproductive ages 45 - older yrs = Post-Reproductive ages ***The MAJOR determining factor of a country’s future population growth is: ***The MAJOR determining factor of a country’s future population growth is: the number of pre-productive people! (Under 15 yrs). the number of pre-productive people! (Under 15 yrs).
. the number of pre-productive people. (Under 15 yrs)..")
36
Where are the baby boomers? http://www.census.gov/ipc/www/idb/summaries.html

37
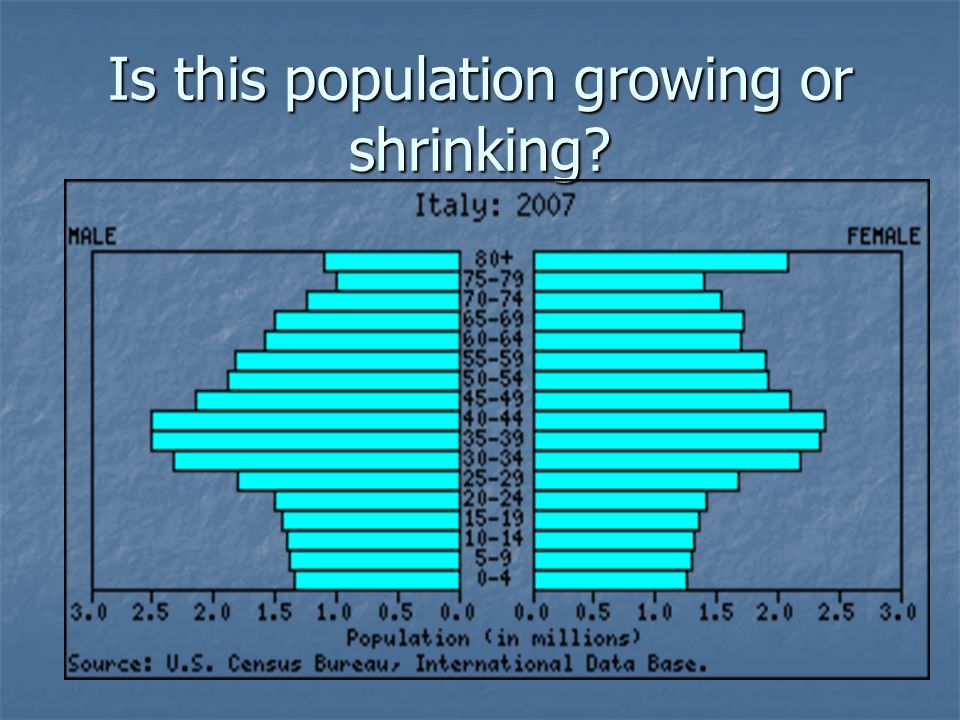
Is this population growing or shrinking?

39
Disadvantages to declining populations Increased demand for Increased demand for Medical care Medical care Social Security Social Security Public services Public services 2.5 elderly to every 1 young person 2.5 elderly to every 1 young person U.S. = 31.9% projected tax rate to pay for services. Italy = 71.5% payroll tax U.S. = 31.9% projected tax rate to pay for services. Italy = 71.5% payroll tax Labor shortages Labor shortages Alleviated by automation or immigration Alleviated by automation or immigration

40
Projecting Future Populations: Developed Countries

41
Population Projections: Developing Nations Remember, what percent of the total population is developing?

42
Population Power In 2000, 31% of people on the planet were under 15 yrs old. (1.9 billion people) In 2000, 31% of people on the planet were under 15 yrs old. (1.9 billion people) 34% of population in developing countries 34% of population in developing countries 19% of population in developed countries 19% of population in developed countries Even if each woman only has 1 or 2 children, the overall population size will soar! Even if each woman only has 1 or 2 children, the overall population size will soar! How to slow or stop this exponential growth? How to slow or stop this exponential growth? Effective methods to slow birth rates Effective methods to slow birth rates Drastic rise in death rates Drastic rise in death rates Would a bird flu pandemic be bad for the Earth???? Would a bird flu pandemic be bad for the Earth????
 In 2000, 31% of people on the planet were under 15 yrs old. (1.9 billion people) 34% of population in developing countries 34% of population in developing countries 19% of population in developed countries 19% of population in developed countries Even if each woman only has 1 or 2 children, the overall population size will soar. Even if each woman only has 1 or 2 children, the overall population size will soar. How to slow or stop this exponential growth. How to slow or stop this exponential growth. Effective methods to slow birth rates Effective methods to slow birth rates Drastic rise in death rates Drastic rise in death rates Would a bird flu pandemic be bad for the Earth . Would a bird flu pandemic be bad for the Earth .")
43
The Demographic Transition

44
Demographic Transitioning PRE-INDUSTRIAL STAGE PRE-INDUSTRIAL STAGE Harsh living conditions lead to high birth rate (high IMR) & high death rate Harsh living conditions lead to high birth rate (high IMR) & high death rate TRANSITIONAL STAGE TRANSITIONAL STAGE Industrialization begins, food production goes up, healthcare improves Industrialization begins, food production goes up, healthcare improves death decreases but birth rates stay high death decreases but birth rates stay high Rapid growth Rapid growth
 & high death rate Harsh living conditions lead to high birth rate (high IMR) & high death rate TRANSITIONAL STAGE TRANSITIONAL STAGE Industrialization begins, food production goes up, healthcare improves Industrialization begins, food production goes up, healthcare improves death decreases but birth rates stay high death decreases but birth rates stay high Rapid growth Rapid growth")
45
Demographic Transitioning INDUSTRIAL STAGE INDUSTRIAL STAGE Industrialization is widespread. Industrialization is widespread. Jobs increase, education & its cost increase, IMR goes down, birth control use is up. Jobs increase, education & its cost increase, IMR goes down, birth control use is up. Birth rate approaches death rate Birth rate approaches death rate POST-INDUSTRIAL STAGE POST-INDUSTRIAL STAGE ZPG achieved, population size decreases as birth rate continues to fall ZPG achieved, population size decreases as birth rate continues to fall Sustainable economic dev’t Sustainable economic dev’t 37 countries (mostly W. Europe) have entered 37 countries (mostly W. Europe) have entered
 have entered 37 countries (mostly W. Europe) have entered.")
46
Population Control

47
China’s Population Control Socialist dictatorship Socialist dictatorship 1960’s realized only option to population control was mass starvation! 1960’s realized only option to population control was mass starvation! Instituted social coercion plan Instituted social coercion plan Free birth control, abortions, & sterilizations Free birth control, abortions, & sterilizations Encouraged to marry at later age & only 1 kid Encouraged to marry at later age & only 1 kid Between 1972 – 2000 Between 1972 – 2000 Crude birth rate drop 50% Crude birth rate drop 50% TFR dropped from 5.7 to 1.8 TFR dropped from 5.7 to 1.8

48
China’s One Child Policy Couples who pledged only one child: Couples who pledged only one child: Extra food Extra food Larger pensions Larger pensions Better housing Better housing Free medical care Free medical care Salary bonuses Salary bonuses Free school tuition Free school tuition Preferential treatment in employment markets Preferential treatment in employment markets

49
China’s One Child Policy Effectiveness Effectiveness 81% of married women in China are using modern contraception 81% of married women in China are using modern contraception Increased employment opportunities for women. Increased employment opportunities for women. Problems Problems Girls are aborted, killed, and neglected Girls are aborted, killed, and neglected 2007 – do not have equal number of sexes 2007 – do not have equal number of sexes

Similar presentations


 G. Tyler Miller’s.>")


 Population size (N) -ideal habitat -maximum reproduction -unlimited resources Increase often.>")


