Download presentation
Presentation is loading. Please wait.

1
Human Population Human Population and Its Impact Chapter 6

2
What is the future of the human population? o We do not know how long we can continue increasing the earth’s carrying capacity for humans without seriously degrading the life- support system that keeps us and many other species alive.

3
Current Growth Rate of the World Current Global Population Growth If the global growth rate has Been dropping since 1960, then why is the global population still increasing?

4
Human Population Through Time

5
Time to get to each billion mark What factors impact population growth? Infant mortality rate Life expectancy Income Education level Gender equality Access to contraceptives Medicine Sanitation

6
What 3 countries have the world’s largest populations? 1.China (19% of total world pop) 2.India (18% of the population) 3.United States
 2.India (18% of the population) 3.United States.")
7
Terms to be familiar with Pre-reproductive age 0-14 Reproductive age 15-44 Post Reproductive Age >45 Age structure Diagrams: Visuals of population based on gender and cohort Demography: The study of populations

8
More Terms Total Fertility Rate (TFR) Average number of children a woman has during her child bearing years. Replacement Level Fertility (RLF) The number of children a couple needs to have to offset the average number of deaths in population to maintain current size ~2.1-2.5
 The number of children a couple needs to have to offset the average number of deaths in population to maintain current size ~")
9
How can we determine population growth? Similar to population dynamics of ecology we can determine population change using (birth rate + immigration) – (death rate + emigration) Crude birth rate = # of births / 1,000 individuals Crude death rate = # of deaths / 1,000 individuals So using those and assuming immigration/emigration don’t have a major impact % population growth can be calculated CBR – CDR 10
 – (death rate + emigration) Crude birth rate = # of births / 1,000 individuals Crude death rate = # of deaths / 1,000 individuals So using those and assuming immigration/emigration don’t have a major impact % population growth can be calculated CBR – CDR 10.")
10
We can also predict how long it will take for populations to double Rule of 70 To determine the amount of time to double in size the rule of 70 can be used: 70 = doubling time % population growth Try it: A population is growing at a rate of 1.5%, how long will it take for that population to double in size?

11
Comparisons Less Developed Countries Lower level of industry Lower income $3 > / day High infant mortality Lower levels of education TFR >2.1 to achieve replacement level fertility Unclean water More Developed Countries High levels of industrialization Gender equality Low infant mortality Better sanitation and clean drinking water Higher income RLF =2.1 Low TFR

12
How can we determine impact on environment? Ehlrich Equation (after Paul Ehlrich and his population bomb idea) I = P opulation x A ffluence x T echnology Environmental impact = Population x affluence x technology A= average consumption (GNI) T= can be measured based on CO 2 emission
 I = P opulation x A ffluence x T echnology Environmental impact = Population x affluence x technology A= average consumption (GNI) T= can be measured based on CO 2 emission.")
13
Social Scientists you should be familiar with 1.Paul Ehlrich Human population will grow exponentially but then drastic drop due to war, social upheaval 2.Malthus: The human population grows exponentially but food does not. Once we overshoot K (due to food limitations) mass starvation will hit
 mass starvation will hit.")
14
So what determines whether BR/FR is high or low? Role of children Financial burden or benefit Urbanization As we see urbanization # of children decrease Education Cost of education and level of female education Infant mortality rate Average age of marriage Pension systems Legality of abortions Religious beliefs

16
What Factors impact DR? Food Supply Distribution Nutrient level Medical advances Technology Vaccinations Sanitation and hygiene Clean water

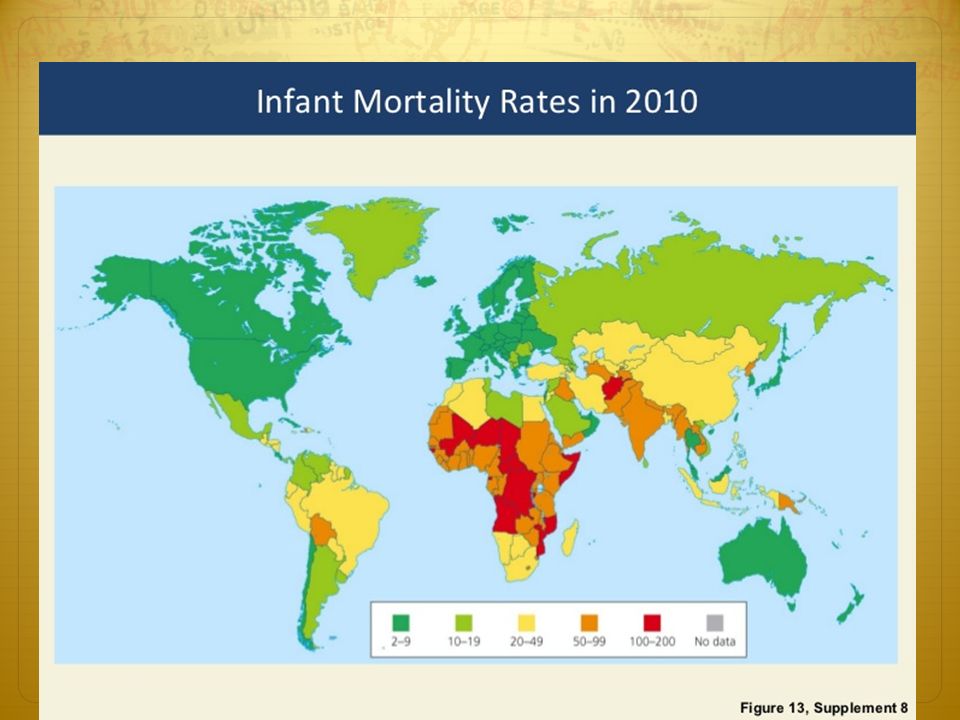
18
How can we determine the overall health of a population? 1. LIFE EXPECTANCY The longer the average life expectancy indicates a better overall health of the population. 2. INFANT MORTALITY The lower the infant mortality rate the healthier the overall population. Most likely if these are both healthy the population has the following Adequate food supply (quantity and quality) and distribution to all Sanitation and clean drinking water Medical advancements / vaccinations
 and distribution to all Sanitation and clean drinking water Medical advancements / vaccinations.")
19
How age structure diagrams can help to make future predictions on populations.

20
You should be able to look at the previous age structure diagrams and explain what the prediction for future population growth and size is.

21
So how do countries transition?

22
Stage 4 and 5 can be clumped into one stage. Preindustrial Transitional Industrial Post Industrial Stage 1 Stage 2Stage 3Stage 4

23
Additionally for Monday Read section 6.3 and 6.4

Similar presentations


>")
