Download presentation
Presentation is loading. Please wait.

1
Environmental Problems & Their Causes Chapter 1 Sections 1.1 – 1.3

2
Dr. Isaac Asimov (in this 1966 interview he predicted that world population would reach 6 billion near the year 2000, but his prediction was conservative: we passed the 6 billion mark in October 1999.) Dr. Isaac Asimov (in this 1966 interview he predicted that world population would reach 6 billion near the year 2000, but his prediction was conservative: we passed the 6 billion mark in October 1999.) " Which is the greater danger - nuclear warfare or the population explosion? The latter absolutely! To bring about nuclear war, someone has to DO something; someone has to press a button. To bring about destruction by overcrowding, mass starvation, anarchy, the destruction of our most cherished values-there is no need to do anything. We need only do nothing except what comes naturally - and breed. And how easy it is to do nothing." " Which is the greater danger - nuclear warfare or the population explosion? The latter absolutely! To bring about nuclear war, someone has to DO something; someone has to press a button. To bring about destruction by overcrowding, mass starvation, anarchy, the destruction of our most cherished values-there is no need to do anything. We need only do nothing except what comes naturally - and breed. And how easy it is to do nothing."
 Dr. Isaac Asimov (in this 1966 interview he predicted that world population would reach 6 billion near the year 2000, but his prediction was conservative: we passed the 6 billion mark in October 1999.) Which is the greater danger - nuclear warfare or the population explosion. The latter absolutely. To bring about nuclear war, someone has to DO something; someone has to press a button. To bring about destruction by overcrowding, mass starvation, anarchy, the destruction of our most cherished values-there is no need to do anything. We need only do nothing except what comes naturally - and breed. And how easy it is to do nothing. Which is the greater danger - nuclear warfare or the population explosion. The latter absolutely. To bring about nuclear war, someone has to DO something; someone has to press a button. To bring about destruction by overcrowding, mass starvation, anarchy, the destruction of our most cherished values-there is no need to do anything. We need only do nothing except what comes naturally - and breed. And how easy it is to do nothing. .")
3
LINEAR vs. EXPONENTIAL

4
http://www.ined.fr/en/everything_about_population/animations/world_population/

5
Countries and Areas Ranked by Population: 2007 Countries and Areas Ranked by Population: 2007 Rank Country or Area Population Rank Country or Area Population 1 China 1,321,851,888 1 China 1,321,851,888 2 India 1,129,866,154 2 India 1,129,866,154 3 United States 301,139,947 4 Indonesia 234,693,997 5 Brazil 190,010,647 6 Pakistan 164,741,924 7 Bangladesh 150,448,339 8 Russia 141,377,752 9 Nigeria 135,031,164 10Japan 127,433,494 10Japan 127,433,494 11 Mexico 108,700,891 11 Mexico 108,700,891 12 Philippines 91,077,287 13 Vietnam 85,262,356 14Germany 82,400,996 15 Egypt 80,335,036 16 Ethiopia 76,511,887 17Turkey 71,158,647 18 Congo (Kinshasa) 65,751,512 19. Iran 65,397,521 20Thailand 65,068,149 20Thailand 65,068,149 101 Paraguay6,669,086

6
1 2 3

7
Demography The study of the size, composition, & distribution of human populations and consequences of changes in these characteristics. The study of the size, composition, & distribution of human populations and consequences of changes in these characteristics.

8
Calculating Population Change Based upon births, deaths, & migration Based upon births, deaths, & migration Population Change = Population Change = (Births + Immigration) – (Deaths + Emigration) Crude birth rate = # of live births per 1,000 people in a given year Crude birth rate = # of live births per 1,000 people in a given year Crude death rate = # of deaths per 1,000 people in a given year Crude death rate = # of deaths per 1,000 people in a given year
 – (Deaths + Emigration) Crude birth rate = # of live births per 1,000 people in a given year Crude birth rate = # of live births per 1,000 people in a given year Crude death rate = # of deaths per 1,000 people in a given year Crude death rate = # of deaths per 1,000 people in a given year")
9
2008 Population Growth Rates United States = 0.88% United States = 0.88% China growth rate = 0.63% China growth rate = 0.63% India growth rate = 1.58% India growth rate = 1.58% Kenya growth rate = 2.75% Kenya growth rate = 2.75% Mexico growth rate = 1.14% Mexico growth rate = 1.14% Canada growth rate = 0.83% Canada growth rate = 0.83% How to use this number: Multiply the country’s current population by this number to see next year’s population total How to use this number: Multiply the country’s current population by this number to see next year’s population total

10
Rule of 70 Determines how many years it will take a population to double in size. Determines how many years it will take a population to double in size. 70 = 70 = % growth rate % growth rate EX: % growth rate for world is = 1.14% EX: % growth rate for world is = 1.14% 70 = 61 years 70 = 61 years 1.41 1.41

11
ZPG Zero Population Growth Zero Population Growth Birth = Death Birth = Death Immigrants = Emigrants Immigrants = Emigrants Population growth rate = 0% Population growth rate = 0% The Earth’s Goal for all countries The Earth’s Goal for all countries Japan is actually declining in population Japan is actually declining in population Annual growth rate = -0.13 Annual growth rate = -0.13

12
Earth’s Human Annual Rate of Population Change 1963 = 2.2% 1963 = 2.2% 2008 = 1.14% 2008 = 1.14% Rate of the world’s population is slowing, BUT population went from 3.2 billion to 6.7 billion during this time! Rate of the world’s population is slowing, BUT population went from 3.2 billion to 6.7 billion during this time! Developing Countries = 1.46% Developing Countries = 1.46% Developed Countries = 0.25% Developed Countries = 0.25% Fastest growing countries: Fastest growing countries: INDIA, KENYA, PAKISTAN, NIGERIA, BANGLADESH, & INDONESIA. INDIA, KENYA, PAKISTAN, NIGERIA, BANGLADESH, & INDONESIA. http://www.ined.fr/en/everything_about_population/animations/world_population/

13
Economic Growth An increase in the capacity to provide goods & services for people’s final use. An increase in the capacity to provide goods & services for people’s final use. Two ways to increase economic growth Two ways to increase economic growth Increase the CONSUMPTION of goods Increase the CONSUMPTION of goods Increase the population with needs Increase the population with needs

14
GNP, GDP, & per capita GNP GNP = Gross National Product GNP = Gross National Product All the goods & services provided within & outside of a country. (current $ value) All the goods & services provided within & outside of a country. (current $ value) GDP = Gross Domestic Product GDP = Gross Domestic Product Goods & services provided within a country Goods & services provided within a country Per Capita GNP = GNP divided by total population Per Capita GNP = GNP divided by total population Assumes each person gets equal share Assumes each person gets equal share
 All the goods & services provided within & outside of a country. (current $ value) GDP = Gross Domestic Product GDP = Gross Domestic Product Goods & services provided within a country Goods & services provided within a country Per Capita GNP = GNP divided by total population Per Capita GNP = GNP divided by total population Assumes each person gets equal share Assumes each person gets equal share.")
15
Developing Countries Per capita GNP <$4,000 Per capita GNP <$4,000 Low to moderate industrialization Low to moderate industrialization Rural, agricultural, illiterate, poor Rural, agricultural, illiterate, poor 80% of world’s population 80% of world’s population 50% of population is under age 15 50% of population is under age 15 15% of wealth 15% of wealth 10-20% of resource usage 10-20% of resource usage

16
List of Least Developed Countries UN 2008 1. Afghanistan 2. Angola 3. Bangladesh 11. Chad 17. Ethiopia Per capita GDP Per capita GDP $700 (‘03) $700 (‘03) $1900 (‘04) $1900 (‘04) $1900 (‘03) $1900 (‘03) $1200 (‘03) $1200 (‘03) $700 (‘03) $700 (‘03)
 $700 (‘03) $1900 (‘04) $1900 (‘04) $1900 (‘03) $1900 (‘03) $1200 (‘03) $1200 (‘03) $700 (‘03) $700 (‘03).")
17
Reasons for Large Families in Developing Countries Old age security Old age security Infant and childhood mortality rates Infant and childhood mortality rates Children are an economic asset Children are an economic asset Grow food, gather fuel, tend livestock, beg, carry water Grow food, gather fuel, tend livestock, beg, carry water

18
Developed Country Per capita GNP >$4,000 Per capita GNP >$4,000 Highly industrialized Highly industrialized Urban, industrial, educated, & wealthy Urban, industrial, educated, & wealthy 20% of world’s population 20% of world’s population 85% of wealth 85% of wealth 80 - 90% of resource usage 80 - 90% of resource usage

19
Per capita GNP (2005) #1 - Luxemburg $65,602 #1 - Luxemburg $65,602 #6 – United States $43,763 #6 – United States $43,763 #36 – Canada - $32, 546 #36 – Canada - $32, 546 #80 – Mexico - $7, 154 #80 – Mexico - $7, 154 #145 – China - $1, 736 #145 – China - $1, 736 #175 – India - $724 #175 – India - $724
 #1 - Luxemburg $65,602 #1 - Luxemburg $65,602 #6 – United States $43,763 #6 – United States $43,763 #36 – Canada - $32, 546 #36 – Canada - $32, 546 #80 – Mexico - $7, 154 #80 – Mexico - $7, 154 #145 – China - $1, 736 #145 – China - $1, 736 #175 – India - $724 #175 – India - $724")
20
GNP 1998

21
Wealth Gap Per capita GNP is calculated equally per person, but it is not distributed equally. Per capita GNP is calculated equally per person, but it is not distributed equally. Gap between rich & poor is growing. Gap between rich & poor is growing. Assets of the average person = $2,200 Assets of the average person = $2,200 1% of world has 40% of total wealth 1% of world has 40% of total wealth 37 million people; at least $500,000 in assets. 37 million people; at least $500,000 in assets. Over 1 billion people survive on less than $1 per day. Over 1 billion people survive on less than $1 per day.

22
Population Increase in Developed and Developing Countries Where should we implement mechanisms to slow population growth?

23
Living Sustainably Sustainable Society Sustainable Society Manages its economy & population size without using the resources to the point of failing to replenish. Manages its economy & population size without using the resources to the point of failing to replenish. Earth Capital = Earth’s air, water, soil, wildlife, minerals, fossil fuels…etc… Earth Capital = Earth’s air, water, soil, wildlife, minerals, fossil fuels…etc…

24
Resources (1.3) Anything we get from the environment to meet our needs and desires. Anything we get from the environment to meet our needs and desires. Directly available: sun, air, water, soil, plants Directly available: sun, air, water, soil, plants Indirectly available: oil, iron, groundwater, crops Indirectly available: oil, iron, groundwater, crops Categories: Categories: Renewable Renewable Potentially Renewable Potentially Renewable Non-renewable. Non-renewable.

25
Renewable Can be replaced in our lifetime. Can be replaced in our lifetime. Solar Energy Solar Energy Winds, Tides, & flowing Water Winds, Tides, & flowing Water

26
Nonrenewable Resources Not renewable on a human time scale Not renewable on a human time scale Energy Resources Energy Resources Fossil Fuels (oil, coal & natural gas) Fossil Fuels (oil, coal & natural gas) Not recyclable Not recyclable Metallic Minerals Metallic Minerals iron, copper, aluminum… iron, copper, aluminum… Recyclable Recyclable Non-metallic minerals Non-metallic minerals clay, sand, phosphates… clay, sand, phosphates… Recyclable, but not economically logical Recyclable, but not economically logical
 Fossil Fuels (oil, coal & natural gas) Not recyclable Not recyclable Metallic Minerals Metallic Minerals iron, copper, aluminum… iron, copper, aluminum… Recyclable Recyclable Non-metallic minerals Non-metallic minerals clay, sand, phosphates… clay, sand, phosphates… Recyclable, but not economically logical Recyclable, but not economically logical")
27
Copper Mine

28
Coal Mine

29
Potentially Renewable Renewable resources that if over-exploited will become nonrenewable during our lifetime. Natural processes renew. Renewable resources that if over-exploited will become nonrenewable during our lifetime. Natural processes renew. Water Water Air Air Soil Soil Biodiversity (plants & animals) Biodiversity (plants & animals)
 Biodiversity (plants & animals).")
30
Biodiversity Three (3) Types of Biodiversity: Genetic Diversity Genetic Diversity The variation in genetic traits The variation in genetic traits Species Diversity Species Diversity The variation in species in an ecosystem The variation in species in an ecosystem Ecological Diversity Ecological Diversity The variation of ecosystems. The variation of ecosystems.

31
Environmental Degradation More Population Causes… Urbanization of productive land Salinization / waterlogging of soil Poor soil management Wetlands destruction Deforestation Groundwater depletion Pollution Livestock overgrazing Reduction in biodiversity by eliminating habitat See fig 1-13

32
Where does the most pressure come from?

33
Tragedy of the Commons Common property resources Common property resources Owned by no one (or everyone) for free Owned by no one (or everyone) for free Clean air, open ocean, its fish, migratory birds, public lands Clean air, open ocean, its fish, migratory birds, public lands
 for free Owned by no one (or everyone) for free Clean air, open ocean, its fish, migratory birds, public lands Clean air, open ocean, its fish, migratory birds, public lands")
34
Tragedy of the Commons Begins with unregulated access to a resource owned by no one. Begins with unregulated access to a resource owned by no one. Harvest based on largest amount over the shortest period of time. Harvest based on largest amount over the shortest period of time. No thought given to sustainable harvests. No thought given to sustainable harvests. Usually ends with no resource for anyone. Usually ends with no resource for anyone.

35
Preventing a Tragedy of the Commons Private ownership Private ownership Users pay approach Users pay approach Regulated access Regulated access Use resources at rates below sustainable yield Use resources at rates below sustainable yield Fairness in access rights Fairness in access rights Common consent of the regulated Common consent of the regulated What did you do to regulate the number of goldfish you caught? What did you do to regulate the number of goldfish you caught?

36
Depleting our Resources Economic Depletion costs of exploiting what is left exceeds the economic value of it Economic Depletion costs of exploiting what is left exceeds the economic value of it We have 5 choices: We have 5 choices: Recycle/reuse does it change forms? Recycle/reuse does it change forms? Use less of it Use less of it Develop a substitute Develop a substitute Do without it Do without it Waste less Waste less Discuss the options in relation to gasoline Discuss the options in relation to gasoline

37
Reserves Reserves http://www.infoplease.com/ipa/A0872964.html http://www.infoplease.com/ipa/A0872964.html http://www.infoplease.com/ipa/A0872964.html Known deposits of a usable mineral that can be profitably extracted at current prices. Known deposits of a usable mineral that can be profitably extracted at current prices. Today, the US reserve has the capacity to hold 727 million barrels. It is the largest emergency oil stockpile in the world. Together, the facilities and crude oil represent about $22 billion investment in energy security ($5 billion for facilities and $17 billion for crude oil). U.S. Dept. of Energy 2008 Today, the US reserve has the capacity to hold 727 million barrels. It is the largest emergency oil stockpile in the world. Together, the facilities and crude oil represent about $22 billion investment in energy security ($5 billion for facilities and $17 billion for crude oil). U.S. Dept. of Energy 2008
. U.S. Dept. of Energy 2008 Today, the US reserve has the capacity to hold 727 million barrels. It is the largest emergency oil stockpile in the world. Together, the facilities and crude oil represent about $22 billion investment in energy security ($5 billion for facilities and $17 billion for crude oil). U.S. Dept. of Energy")
38
Returning to the Root of the Problem: What’s putting pressure on our Resources? Human Population: Growth & Distribution Chapter 6 Sections 6.1 & 6.2

39
What’s this showing?

40
Global Fertility Rates Fertility Fertility # of births that occur to an individual woman in a population. # of births that occur to an individual woman in a population. Replacement Level Fertility Replacement Level Fertility # of children needed to replace their parents # of children needed to replace their parents Projected number... “should have” Projected number... “should have” Total Fertility Rate (TFR) Total Fertility Rate (TFR) Average # of children that a woman has during her fertile years. Average # of children that a woman has during her fertile years. Actual, real number…”does have” Actual, real number…”does have”
 Total Fertility Rate (TFR) Average # of children that a woman has during her fertile years. Average # of children that a woman has during her fertile years. Actual, real number… does have Actual, real number… does have .")
41
Global Fertility Rates Replacement Level Fertility Rates (1997) Replacement Level Fertility Rates (1997) Developed countries = 2.1 children Developed countries = 2.1 children Developing countries = 2.5 children Developing countries = 2.5 children (Since some baby girls die before they reproduce, the number is slightly greater than two.) (Since some baby girls die before they reproduce, the number is slightly greater than two.) Also, not every woman has a child Also, not every woman has a child Total Fertility Rates (TFR) (1997) Total Fertility Rates (TFR) (1997) World Average = 3.0 children World Average = 3.0 children Developed – 1.6 children Developed – 1.6 children 2.5 children in 1950. 2.5 children in 1950. Developing – 3.4 children Developing – 3.4 children 6.5 children in 1950. 6.5 children in 1950.

42
TFR Africa has the highest in world Africa has the highest in world U.S. has had higher than most developed countries: U.S. has had higher than most developed countries: Large # of baby boomers = moms Large # of baby boomers = moms Increased number of unmarried mothers Increased number of unmarried mothers Increased fertility rates in some racial/ethnic groups Increased fertility rates in some racial/ethnic groups Legal/illegal immigrants Legal/illegal immigrants (11% of population are foreign born. (NOVA 2007) (11% of population are foreign born. (NOVA 2007)
 (11% of population are foreign born. (NOVA 2007).")
43
Factors Affecting Birth & Fertility Rates Increasing Factors Increasing Factors Children in labor force Children in labor force Rural areas Rural areas Lack of birth control Lack of birth control Religious/cultural values against birth control Religious/cultural values against birth control Lack of abortion access Lack of abortion access Younger than 25 at marriage Younger than 25 at marriage Few jobs for women Few jobs for women Lack of educational opportunities Lack of educational opportunities Decreasing Factors Decreasing Factors Low infant mortality rate Educational & job opportunities for women Affluence Cost of raising children Urbanization Older than 25 at marriage Availability of pension systems

44
Fertility Rate and Income

45
Contraceptive Use and Fertility Rates

46
Know the differences. Match Population growth rate Population growth rate IMR IMR ZPG ZPG Rule of 70 Rule of 70 TFR TFR Replacement fertility Replacement fertility Crude rate Crude rate 1. Refers to actual number of births (or deaths) that occur per 1000 people 2. How many kids the moms in a pop are having 3. How many infants die per 1000 born 4. Uses current growth rate to estimate when pop will double 5. Multiply the total # of people in the population by this number to project future pop 6. Population is stable. B = D 7. How many kids the moms in a pop have to have to keep the numbers the same
 that occur per 1000 people 2. How many kids the moms in a pop are having 3. How many infants die per 1000 born 4. Uses current growth rate to estimate when pop will double 5. Multiply the total # of people in the population by this number to project future pop 6. Population is stable. B = D 7. How many kids the moms in a pop have to have to keep the numbers the same.")
47
Know the differences. 5. Population growth rate 3. IMR 6. ZPG 4. Rule of 70 2. TFR 7. Replacement fertility 1. Crude rate Multiply the total # of people in the population by this number to project future pop Multiply the total # of people in the population by this number to project future pop How many infants die per 1000 born How many infants die per 1000 born Population is stable. B = D Population is stable. B = D Uses current growth rate to estimate when pop will double Uses current growth rate to estimate when pop will double How many kids the moms in a pop are having How many kids the moms in a pop are having How many kids the moms in a pop have to have to keep the numbers the same How many kids the moms in a pop have to have to keep the numbers the same Refers to actual number of births (or deaths) that occur per 1000 people Refers to actual number of births (or deaths) that occur per 1000 people
 that occur per 1000 people Refers to actual number of births (or deaths) that occur per 1000 people.")
48
Factors Affecting Death Rates Population increase over the past 100 years most influenced by the decrease in death rates! Population increase over the past 100 years most influenced by the decrease in death rates! Better food supplies & distribution Better food supplies & distribution Better nutrition Better nutrition Better water supplies Better water supplies Advances in medicine & sanitation Advances in medicine & sanitation

49
Causes of Human Mortality

50
Measures of Overall Health Life expectancy Life expectancy Average # of years a newborn can expect to live Average # of years a newborn can expect to live Developed countries = 71 years (1997); 77 (2007) Developed countries = 71 years (1997); 77 (2007) Developing countries = 62 years (1997); 64.5 (2007) Developing countries = 62 years (1997); 64.5 (2007) Infant Mortality Rate Infant Mortality Rate # of babies out of every 1,000 who die before their first birthday. # of babies out of every 1,000 who die before their first birthday. Reflects a country’s level of nutrition & health care Reflects a country’s level of nutrition & health care Single best measure of a society’s quality of life. Single best measure of a society’s quality of life.

51
U.S. Infant Mortality Rate Higher than 35 other countries due to: Higher than 35 other countries due to: Inadequate health care for poor women & their babies Inadequate health care for poor women & their babies Drug addiction among pregnant women Drug addiction among pregnant women High birth rate among teenagers High birth rate among teenagers

52
MIGRATION Is not always voluntary Is not always voluntary Involuntary displacement by: Involuntary displacement by: Armed conflict Armed conflict Environmental degradation Environmental degradation Natural disaster Natural disaster

53
Why would a population continue to grow if it achieved replacement level fertility rates? Because of the AGE STRUCTURE Because of the AGE STRUCTURE How many future moms are there? How many future moms are there?

54
Population Age Structure Section 6-2

55
Age Structure Diagrams The % of males & females in the total population divided by age groups: The % of males & females in the total population divided by age groups: 0 - 14 yrs = Pre-Productive ages 0 - 14 yrs = Pre-Productive ages 15 - 44 yrs = Reproductive ages 15 - 44 yrs = Reproductive ages 45 - older yrs = Post-Reproductive ages 45 - older yrs = Post-Reproductive ages ***The MAJOR determining factor of a country’s future population growth is: ***The MAJOR determining factor of a country’s future population growth is: the number of pre-productive people! (Under 15 yrs). the number of pre-productive people! (Under 15 yrs).
. the number of pre-productive people. (Under 15 yrs)..")
56
Where are the baby boomers? http://www.census.gov/ipc/www/idb/summaries.html

57
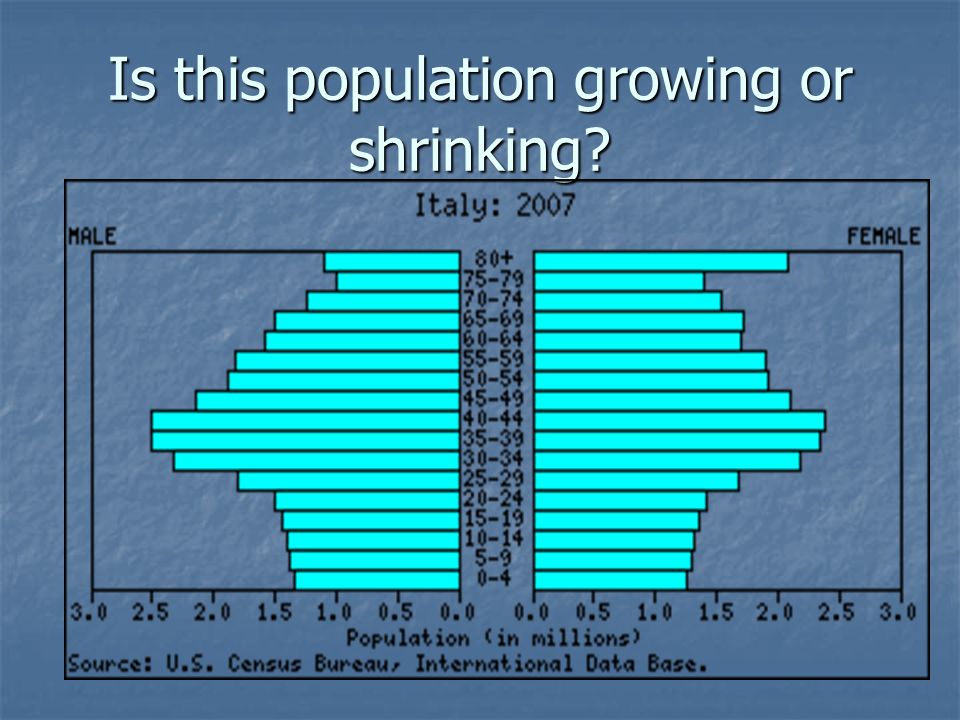
Is this population growing or shrinking?

59
Disadvantages to declining populations Increased demand for Increased demand for Medical care Medical care Social Security Social Security Public services Public services 2.5 elderly to every 1 young person 2.5 elderly to every 1 young person U.S. = 31.9% projected tax rate to pay for services. Italy = 71.5% payroll tax U.S. = 31.9% projected tax rate to pay for services. Italy = 71.5% payroll tax Labor shortages Labor shortages Alleviated by automation or immigration Alleviated by automation or immigration

60
Projecting Future Populations: Developed Countries

61
Population Projections: Developing Nations Remember, what percent of the total population is developing?

62
Population Power In 2000, 31% of people on the planet were under 15 yrs old. (1.9 billion people) In 2000, 31% of people on the planet were under 15 yrs old. (1.9 billion people) 34% of population in developing countries 34% of population in developing countries 19% of population in developed countries 19% of population in developed countries Even if each woman only has 1 or 2 children, the overall population size will soar! Even if each woman only has 1 or 2 children, the overall population size will soar! How to slow or stop this exponential growth? How to slow or stop this exponential growth? Effective methods to slow birth rates Effective methods to slow birth rates Drastic rise in death rates Drastic rise in death rates Would a bird flu pandemic be bad for the Earth???? Would a bird flu pandemic be bad for the Earth????
 In 2000, 31% of people on the planet were under 15 yrs old. (1.9 billion people) 34% of population in developing countries 34% of population in developing countries 19% of population in developed countries 19% of population in developed countries Even if each woman only has 1 or 2 children, the overall population size will soar. Even if each woman only has 1 or 2 children, the overall population size will soar. How to slow or stop this exponential growth. How to slow or stop this exponential growth. Effective methods to slow birth rates Effective methods to slow birth rates Drastic rise in death rates Drastic rise in death rates Would a bird flu pandemic be bad for the Earth . Would a bird flu pandemic be bad for the Earth .")
63
The Demographic Transition

64
Demographic Transitioning PRE-INDUSTRIAL STAGE PRE-INDUSTRIAL STAGE Harsh living conditions lead to high birth rate (high IMR) & high death rate Harsh living conditions lead to high birth rate (high IMR) & high death rate TRANSITIONAL STAGE TRANSITIONAL STAGE Industrialization begins, food production goes up, healthcare improves Industrialization begins, food production goes up, healthcare improves death decreases but birth rates stay high death decreases but birth rates stay high Rapid growth Rapid growth
 & high death rate Harsh living conditions lead to high birth rate (high IMR) & high death rate TRANSITIONAL STAGE TRANSITIONAL STAGE Industrialization begins, food production goes up, healthcare improves Industrialization begins, food production goes up, healthcare improves death decreases but birth rates stay high death decreases but birth rates stay high Rapid growth Rapid growth")
65
Demographic Transitioning INDUSTRIAL STAGE INDUSTRIAL STAGE Industrialization is widespread. Industrialization is widespread. Jobs increase, education & its cost increase, IMR goes down, birth control use is up. Jobs increase, education & its cost increase, IMR goes down, birth control use is up. Birth rate approaches death rate Birth rate approaches death rate POST-INDUSTRIAL STAGE POST-INDUSTRIAL STAGE ZPG achieved, population size decreases as birth rate continues to fall ZPG achieved, population size decreases as birth rate continues to fall Sustainable economic dev’t Sustainable economic dev’t 37 countries (mostly W. Europe) have entered 37 countries (mostly W. Europe) have entered
 have entered 37 countries (mostly W. Europe) have entered.")
66
How can we lower our growth rates? Problem: Problem:

67
China’s Population Control Socialist dictatorship Socialist dictatorship 1960’s realized only option to population control was mass starvation! 1960’s realized only option to population control was mass starvation! Instituted social coercion plan Instituted social coercion plan Free birth control, abortions, & sterilizations Free birth control, abortions, & sterilizations Encouraged to marry at later age & only 1 kid Encouraged to marry at later age & only 1 kid Between 1972 – 2000 Between 1972 – 2000 Crude birth rate drop 50% Crude birth rate drop 50% TFR dropped from 5.7 to 1.8 TFR dropped from 5.7 to 1.8

68
China’s One Child Policy Couples who pledged only one child: Couples who pledged only one child: Extra food Extra food Larger pensions Larger pensions Better housing Better housing Free medical care Free medical care Salary bonuses Salary bonuses Free school tuition Free school tuition Preferential treatment in employment markets Preferential treatment in employment markets

69
China’s One Child Policy Effectiveness Effectiveness 81% of married women in China are using modern contraception 81% of married women in China are using modern contraception Increased employment opportunities for women. Increased employment opportunities for women. Problems Problems Girls are aborted, killed, and neglected Girls are aborted, killed, and neglected 2007 – do not have equal number of sexes 2007 – do not have equal number of sexes

70
Extra Slides Some may clarify concepts Some are just interesting facts Some are to challenge your critical thinking

71
Changing Human Survivorship Curves: Went from B to A % Survival Age BirthDeath A B

72
World Population Growth and Absolute Growth

74
Comparing Projected Populations Fertility Rate > 2 Fertility Rate < 2

76
Demographic Transition Comparisons

77
Calculating Fertility Rates and Doubling Times (CBR – CDR)/10 = Rate of increase or decrease in population per 1,000 per year 70/Rate of Increase = Doubling Time
/10 = Rate of increase or decrease in population per 1,000 per year 70/Rate of Increase = Doubling Time")
78
Calculating Fertility Rates and Doubling can you figure out these numbers using the crude rates?

84
The 10 Leading Global Risk Factors Fig. 15-9 here

85
Public Policy: The Policy Life Cycle: how media, individuals, law & government react to issues Public Policy: The Policy Life Cycle: how media, individuals, law & government react to issues

86
Citizen Involvement Grassroots concerns Informing constituents Informing elected officials Electing or defeating political candidates Recycling, conserving, stewardship

87
Environmental Problems in various Policy Life Cycle Stages

Similar presentations


 G. Tyler Miller’s.>")


