Download presentation
Presentation is loading. Please wait.

1
Geosystems Robert W. Christopherson FIFTH EDITION
AN INTRODUCTION TO PHYSICAL GEOGRAPHY Robert W. Christopherson

2
Chapter 1 Essentials of Geography
Geosystems 5e An Introduction to Physical Geography Robert W. Christopherson Charlie Thomsen

3
Key Learning Concepts After reading the chapter you should be able to:
Define geography and physical geography in particular. Describe systems analysis, open and closed systems, feedback information, and system operations, and relate these concepts to Earth systems. Explain Earth’s reference grid: latitude and longitude, and latitudinal geographic zones and time. Define cartography and mapping basics: map scale and map projections. Describe remote sensing and explain geographic information system (GIS) methodology as a tool used in methodology as a tool used in geographic analysis.
 methodology as a tool used in methodology as a tool used in geographic analysis.")
4
The Science of Geography
Geography – from geo “Earth” and graphein “to write” Geography is A method, not a body of knowledge Holistic (relating to or concerned with wholes or with complete systems rather than with the analysis of, treatment of, or dissection into parts). Eclectic (composed of elements drawn from various sources). Geographers use spatial analysis (the examination of spatial interactions, patterns, and variations over area/or space. Geography is a spatial science; spatial analysis its essential approach). Spatial- The nature or character of physical space, as in an area; occupying or operating within space.
. Eclectic (composed of elements drawn from various sources). Geographers use spatial analysis (the examination of spatial interactions, patterns, and variations over area/or space. Geography is a spatial science; spatial analysis its essential approach). Spatial- The nature or character of physical space, as in an area; occupying or operating within space.")
5
What is the Science of Geography?
Geography is the science that studies the interdependence of geographic areas, places, and locations; natural systems; processes; and societal and cultural activities over Earth's surface. Physical geography involves the spatial analysis of Earth's physical environment. Various words denote the geographic context of spatial analysis: space, territory, zone, pattern, distribution, place, location, region, sphere, province, and distance. Spatial patterns of Earth's weather, climate, winds and ocean currents, topography, and terrestrial biomes are examples of geographic topics.

6
Example of what physical geographers do:
Question: How might a physical geographer analyze water pollution in the Great Lakes? Answer: Geographers for example can describe the lake elevations, flows, volumes and annual mixing patterns as temperatures change seasonally. They can locate population centers and point sources of pollution using population concentrations estimate non-point sources of pollution. They can map published data of water chemical analyses. They can use a Geographic Information System (GIS) model develop a composite overlay of all the above elements.
 model develop a composite overlay of all the above elements.")
7
Geographic themes: The Association of American Geographers (AAG) and the National Council for Geographic Education (NCGE), set forth five key themes for modern geographic education: location, place, human-Earth relationships, movement, and region.
 and the National Council for Geographic Education (NCGE), set forth five key themes for modern geographic education: location, place, human-Earth relationships, movement, and region.")
8
The five geographic themes:
Location: Either absolute or relative location. Location answers the question where? – or the specific planetary address of a location. Region: Portion of the Earth’s surface with uniform characteristics; how they form and change; how they relate to other regions. Human-Earth Relationship: Humans and the environment: resource exploitation, hazard perception, and environmental modification- the oldest theme of geographic inquiry. Place: The characteristics that make each place unique (realistic or spiritual). Movement: Communication, movement, circulation, and diffusion across Earth’s surface. Global interdependence links all regions and places- both physical and human systems.
. Movement: Communication, movement, circulation, and diffusion across Earth’s surface. Global interdependence links all regions and places- both physical and human systems.")
9
Geography is also: The science that studies the relationships among
natural systems, geographic areas, society, cultural activities, and the interdependence of all of these over space.

10
Content of Geography Geography derives subject matter from many different sciences. The focus of this class is physical geography but geographers also integrate some human and cultural components. Synthesis of Earth topics and human topics is suggested by movement toward the middle of the continuum- a holistic, or balanced view. (See Figure 1.2- next slide).
.")
11
Figure 1.2

12
Scientific Method Like all other sciences, geographers use the scientific method approach that uses applied common sense in an organized and objective manner; based on observation, reasoning, hypothesis, predictions, and finally the development of a theory. Observation: What data are needed? What do we want to know? What questions need answering? Reasoning: Explanation and interpretation. Building useful models of real systems- conceptual, numerical. Hypothesis: General statement summarize data, observations, and model simulations. Predictions: Experiments conducted; more data gathered through observation and measurement; hypothesis refined. Theory: Real world understood; the knowledge of how things happen and behave as part of broad, general principles.

13
Figure 1: Page 7 Geographers use the scientific method- from perceptions, to observations, reasoning, hypothesis, predictions, and possibly to general theory and natural laws.

14
Earth Systems Concepts
Systems Theory: Geographers use systems methodology as an analytic tool. A system is any ordered, interrelated set of things and their attributes, linked by flows of energy and matter, as distinct from the surrounding environment outside the system Open systems: A system with inputs and outputs crossing back and forth between the system and the surrounding environment. Earth is an open system in terms of energy-why? Other examples are the automobile and a leaf (see next 2 slides). Closed systems: A system that is shut off from the surrounding environment so that it is entirely self-contained in terms of energy and materials; Earth is a closed system in terms of physical matter and resources.
. Closed systems: A system that is shut off from the surrounding environment so that it is entirely self-contained in terms of energy and materials; Earth is a closed system in terms of physical matter and resources.")
15
More systems: System feedback: As a system operates, it generates outputs that influence its own operations. These outputs function as “information” that is returned to various points in the system via pathways called “feedback loops.” Feedback loops can guide further system operations. Example: In plant photosynthesis any increase or decrease in daylight or water can cause a decrease in growth of a plant. System equilibrium: A system that maintains structure and equilibrium over time. The rates of inputs and outputs in the system are equal and the amounts of energy and matter are constant. Examples: the rotations of planets. Gradual change of the system is defined as Dynamic equilibrium. Examples: Long term climatic changes, increasing temperatures of the atmosphere and oceans.

16
Figure 1.3

17
Open system: Photosynthesis in plants create consumption of light, CO2, nutrients, and H2O and produces oxygen and sugars while at night much of the reverse takes place. Figure 1.4

18
Earth’s Four Spheres Atmosphere Hydrosphere Lithosphere Biosphere
Figure 21.2

19
Earth’s Four Spheres- Plan for the Course.
Atmosphere: (Chap. 2-6). The atmosphere is a thin veil of gases surrounding the Earth, which form a protective boundary between outer space and the biosphere; generally considered to extend about 480 km from the surface. Hydrosphere: (Chap. 7-10) An abiotic (non biological) open system that includes all of the Earth’s water. Lithosphere: (Chap ). Earth’s crust and a portion of the upper mantle directly below the crust form the lithosphere. Biosphere: (Chap ). The intricate, interconnected web that links all organisms with their physical environment.
. The atmosphere is a thin veil of gases surrounding the Earth, which form a protective boundary between outer space and the biosphere; generally considered to extend about 480 km from the surface. Hydrosphere: (Chap. 7-10) An abiotic (non biological) open system that includes all of the Earth’s water. Lithosphere: (Chap ). Earth’s crust and a portion of the upper mantle directly below the crust form the lithosphere. Biosphere: (Chap ). The intricate, interconnected web that links all organisms with their physical environment.")
20
Earth’s Dimensions, Location, and Time Calculations
Latitude Longitude Great circles, Small Circles Prime Meridian and standard time

21
(Figure 1.9) Earth’s dimensions: Earth circumference (a) and diameter (b)- equatorial and polar - are shown. The dashed line is a perfect circle for reference to Earth’s geoid (the surface within or around the earth that is everywhere normal to the direction of gravity and coincides with mean sea level in the oceans). Figure 1.9

22
Latitude On a map or globe, lines denoting angles of latitude run east and west, parallel to Earth's equator. Latitude is an angular distance north or south of the equator measured from a point at the center of Earth. A line connecting all points along the same latitudinal angle is called a parallel. (See next slide.)
")
23
Latitude Figure 1.11:

24
Longitude On a map or globe, lines designating angles of longitude run north and south at right angles (90°) to the equator and all parallels. Longitude is an angular distance east or west of a surface location measured from a point at the center of Earth. A line connecting all points along the same longitude is called a meridian. (See next slide.)
 to the equator and all parallels. Longitude is an angular distance east or west of a surface location measured from a point at the center of Earth. A line connecting all points along the same longitude is called a meridian. (See next slide.)")
25
Longitude Figure 1.14

26
Great Circles and Small Circles
A great circle is any circle of Earth's circumference whose center coincides with the center of Earth. Every meridian is one-half of a great circle that crosses each parallel at right angles and passes through the poles. An infinite number of great circles can be drawn on Earth, but only one parallel is a great circle–the equatorial parallel. All the rest of the parallels diminish in length toward the poles, and, along with other circles that do not share Earth's center, constitute small circles (See next slide).
.")
27
Great Circles and Small Circles
Figure 1.15

28
Prime Meridian and Standard Time
Prime Meridian: the meridian of 0 degrees longitude which runs through the original site of the Royal Observatory at Greenwich, England, and from which other longitudes are measured east or west. Greenwich, England was selected by international agreement in an 1884 treaty. – Greenwich Mean Time (GMT) became the world standard time. (See next slide). International Date Line: An important corollary of the prime meridian is the 180 degrees meridian on the opposite side of the planet. The meridian is called the International Date Line (IDL) and marks the place where each day officially begins (at 12:01 A.M.). From this “line” the new day sweeps westward. The westward movement is created by the Earth turning eastward on its axis. The IDL deviates from the 180 degrees meridian, this deviation is due to local administrative and political preferences. (See next slide).
 became the world standard time. (See next slide). International Date Line: An important corollary of the prime meridian is the 180 degrees meridian on the opposite side of the planet. The meridian is called the International Date Line (IDL) and marks the place where each day officially begins (at 12:01 A.M.). From this line the new day sweeps westward. The westward movement is created by the Earth turning eastward on its axis. The IDL deviates from the 180 degrees meridian, this deviation is due to local administrative and political preferences. (See next slide).")
29
Figure 1.17: Prime Meridian and Standard Time

30
What does timekeeping have to do with longitude
What does timekeeping have to do with longitude? How is Coordinated Universal Time (UTC) determined on Earth? Earth revolves 360° every 24 hours, or 15° per hour, and a time zone of one hour is established for each 15° of longitude. Thus, a world standard was established, and time was set with the prime meridian at Greenwich, England. Each time zone theoretically covers 7.5° on either side of a controlling meridian and represents one hour. Greenwich Mean Time (GMT) is called Coordinated Universal Time (UTC); and although the prime meridian is still at Greenwich, UTC is based on average time calculations kept in Paris and broadcast worldwide. UTC is measured today by the very regular vibrations of cesium atoms in 6 primary standard clocks–the NIST-F1 being the newest placed in operation by the United States in 2000.
 determined on Earth Earth revolves 360° every 24 hours, or 15° per hour, and a time zone of one hour is established for each 15° of longitude. Thus, a world standard was established, and time was set with the prime meridian at Greenwich, England. Each time zone theoretically covers 7.5° on either side of a controlling meridian and represents one hour. Greenwich Mean Time (GMT) is called Coordinated Universal Time (UTC); and although the prime meridian is still at Greenwich, UTC is based on average time calculations kept in Paris and broadcast worldwide. UTC is measured today by the very regular vibrations of cesium atoms in 6 primary standard clocks–the NIST-F1 being the newest placed in operation by the United States in")
31
Maps, Scales, and Projections
Map – a generalized view of an area, as seen from above and reduced in size Scale – ratio of map units to ground units Projection – process of transforming spherical Earth to flat map

32
Maps A picture -- or a map -- is worth a thousand words! A map is a simplified view of the earth's surface that shows where places and things are located and helps us communicate that information efficiently. In this section, you will learn more about maps and how to read them.

33
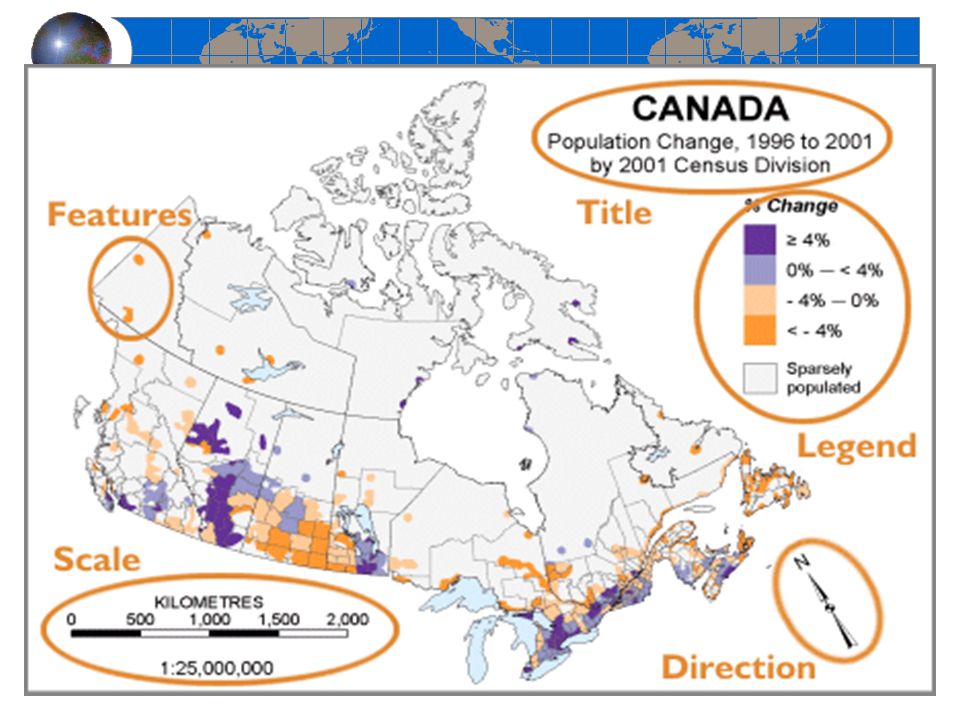
Reading Maps Common Elements:
Maps have certain common elements that help us read them effectively.

35
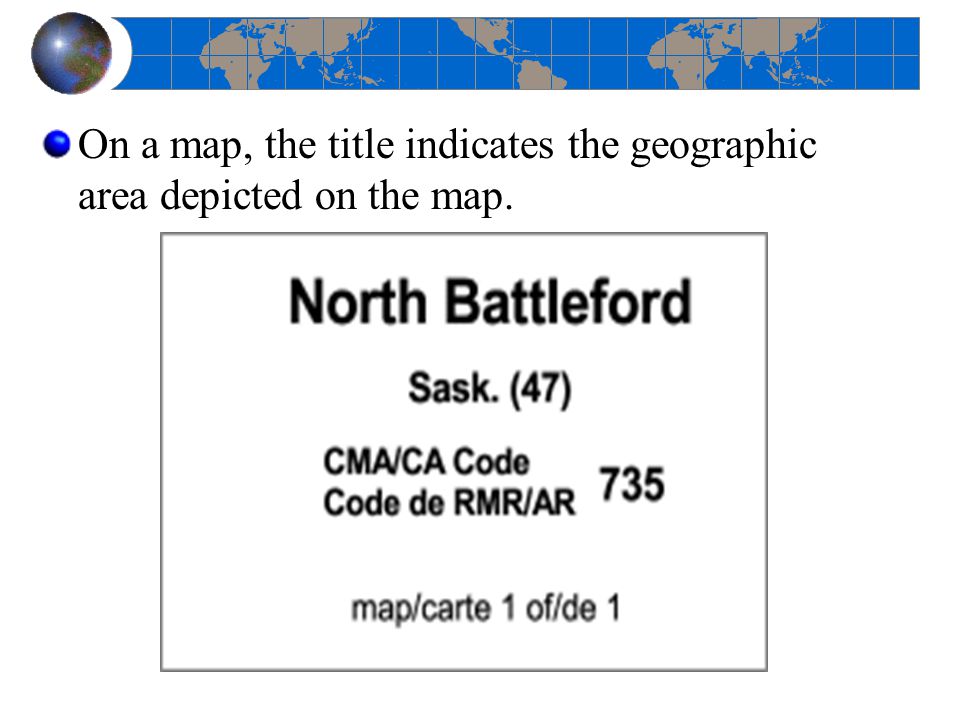
On a map, the title indicates the geographic area depicted on the map.
36
On a thematic map, the title also indicates the data being presented on the map.

37
Legend The legend is the key to understanding the map and, together with the title, is the first place you should look when reading a map. The map legend explains the meaning of symbols used on the map.

39
Scale Scale is a statement of how distance on the map relates to distance on the ground. Two common expressions of scale are: Representative fraction Graphic Bar (or bar scale)
")
40
Representative fraction
Example of Representative fraction: 1:63,360 Meaning: 1 unit of distance on the map equals 63,360 of the same units on the ground. The ratio is universal: 1cm on the map = 63,360 cm on the ground or 1 inch on the map = 63,360 inches on the ground.

41
Graphic Bar (or bar scale)
Example: Use the graphic scale printed on the map to measure distances on the map in terms of ground distances.

42
Small scale or large scale?
Small scale = less detail (more land coverage), for example 1:1,000,000. Large scale = more detail (less land coverage), for example 1:10,000. Sometimes, small scale maps contain "insets" at a larger scale to show detail in a congested area of the small scale map. (See next slide).
, for example 1:1,000,000. Large scale = more detail (less land coverage), for example 1:10,000. Sometimes, small scale maps contain insets at a larger scale to show detail in a congested area of the small scale map. (See next slide).")
43
Example:

44
DIRECTION: Most maps include a "north arrow“ (see below) to reference direction on the map. Maps produced by Statistics Canada usually show "true north", which is the direction to the North Pole of the earth, rather than magnetic north or grid north. The north arrow on a map is usually located in or near the map legend. If a north arrow does not appear on the map, north is assumed to be the top of the map There are other types of "north" that can be shown on maps. Most topographic maps will show the difference between true, magnetic and grid north. Magnetic north is the north magnetic pole. It is currently located in Nunavut at 78oN 105oW. The north arrow of a magnetic compass points toward the north magnetic pole. (Note: the difference between true north and magnetic north is call ed magnetic declination.) Grid north is an artificial north that is used on map which have a rectangular grid. The vertical lines do not converge as one proceeds northward. These map are most commonly used for navigation.
 Grid north is an artificial north that is used on map which have a rectangular grid. The vertical lines do not converge as one proceeds northward. These map are most commonly used for navigation.")
45
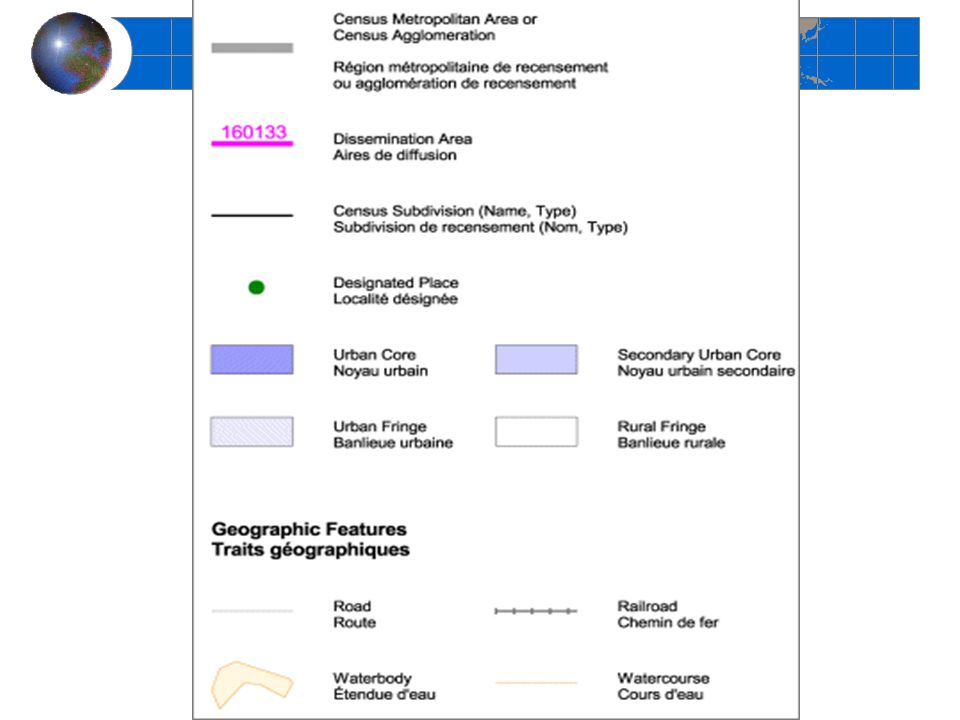
Features Thematic maps use symbols to display a specific data theme such as population change, distribution of lone-parent families, average farm income, etc. A minimum amount of reference information, such as boundaries and major water features, help map readers orient themselves to the geographic area covered by the map.

46
Example:

47
Features (continued) Reference maps use symbols to show the location of physical features, such as roads, railroads, rivers, lakes, etc., and non-visible features such as boundaries, names and codes of geographic areas (See next slide)..
..")
48
Example:

49
Classes of Map Projections
A globe is the only true representation of distance, direction, area, shape, and proximity. A flat map distorts those properties. Therefore, in preparing a flat map, the cartographer must decide which characteristics to preserve, which to distort, and how much distortion is acceptable. Four general classes and perspectives of map projections are used by cartographers: cylindrical, planar, conic, and oval. (See next slide).
.")
50
Classes of Map Projections
Figure 1.22

51
Modern Earth Measurements: Remote Sensing What is remote sensing
Modern Earth Measurements: Remote Sensing What is remote sensing? What are you viewing when you observe a weather image on TV? Remote Sensing: Our eyes and cameras are familiar means of obtaining remote-sensing information about a distant subject without having physical contact. Remote sensors on satellites and other craft sense a broader range of wavelengths than can our eyes. They can be designed to “see” wavelengths shorter than visible light (ultraviolet) and wavelengths longer than visible light (infrared and microwave radar). Active remote sensing: Active systems direct a beam of energy at a surface and analyze the energy that is reflected back. An example is radar (radio detection and ranging). Passive remote sensing: Passive remote-sensing systems record energy radiated from a surface, particularly visible light (like our eyes) and infrared.
 and wavelengths longer than visible light (infrared and microwave radar). Active remote sensing: Active systems direct a beam of energy at a surface and analyze the energy that is reflected back. An example is radar (radio detection and ranging). Passive remote sensing: Passive remote-sensing systems record energy radiated from a surface, particularly visible light (like our eyes) and infrared.")
52
Active and Passive Remote Sensing
Passive sensing visible light Active sensing radar Figure 1.25

53
Remote Sensing Figure 1.26

54
Geographic Information Systems (GIS)
GIS systems combine spatial and attribute data Maps can contain multiple data layers: Physical features Cultural features Layers can be added to create composite overlay

55
Geography and Technology
Geography affects us in many ways Our natural environment Our human environment Geography is a Hi-Tech discipline Earth Observation Global Positioning Systems (GPS) Geographic Information Systems (GIS) Traditionally, geography has been seen as affection our natural environment (physical geography) and our human environment (human geography). However, more recently, geography has been viewed as an emerging hi-tech discipline, with such systems as Earth Observation, GPS and GIS. We will examine each of these more closely.
 Geographic Information Systems (GIS) Traditionally, geography has been seen as affection our natural environment (physical geography) and our human environment (human geography). However, more recently, geography has been viewed as an emerging hi-tech discipline, with such systems as Earth Observation, GPS and GIS. We will examine each of these more closely.")
56
Earth Observation Landsat (TM) RadarSAT SPOT LANDSAT RADARSAT ERS NOAA
There are several satellites orbiting the earth and taking pictures of various landforms and surfaces on the earth. Some of these satellites are: SPOT - The French satellite - Systeme Pour l’Observation de la Terre - there is data available from this satellite on ArcCanada. LandSAT - The first satellite ever put in orbit, by the US. It was used for spy operations during the Cold War. Some of this data is available from NASA. RadarSAT - Canadian made satellite system. Originally built to monitor ice flow in the Arctic because radar waves can penetrate weather systems and ice (for example cloud cover). NOAA - National Oceanic and Atmospheric Association… If you ever watch the weather channel, and see cloud cover/movement images, you are probably looking at a NOAA image. ERS - European satellite
. NOAA - National Oceanic and Atmospheric Association… If you ever watch the weather channel, and see cloud cover/movement images, you are probably looking at a NOAA image. ERS - European satellite.")
57
Geographic Information Systems
We can describe any element of our world in two ways: Attribute Information: What is it? Species: Oak Height: 15m Age: 75 Yrs Location Information: Where is it? 51°N, 112°W Finally, GIS… Every element of our world, can be described in two ways. Let’s take this tree for example... This tree has a location - described with a latitude and longitude - it is located at 51oN and 112oW. This is its "location information". This same tree also has additional “attribute information”. This is an oak tree, it is 15m high and it is 75 years old. Describing Our World

58
GIS - Links Data Sets GIS software links the location data and the attribute data: The location and attribute information is stored inside your computer and a GIS links the two types of information together. It uses a map to display the location information and a table to display the attribute information. There is a constant link between the location and attribute information - when Manitoba is highlighted on the map, it is also highlighted in the table.

59
GIS - Analysis GIS software can answer questions about our world:
What provinces have more than 1.5 million people? Attribute Questions: What provinces border Saskatchewan? Spatial Questions: Using GIS you can ask questions related to either the location or the attribute information. The power behind a GIS is the ability you now have to ask questions using the two types of information that are housed in a GIS. We can ask a spatial question such as "Which provinces border on Saskatchewan?" In this case, we are asking a question relating to the location information so the GIS is going to go the map to answer this question. It will highlight all those provinces that answer the question. However, it is important to remember that those same provinces will also be highlighted in the table, thus demonstrating the link between the two types of information. On the other hand we can ask a question that relates to the attribute information such as "How many provinces have more than 1.5 million people?" In this case, the GIS will go to the table, where the attribute information is stored, and highlight those provinces that meet these criteria. Keep in mind that the same provinces will also be highlighted on the map.

60
GIS - Layers GIS contains many layers of information:
Base Map Data These are just a few of the kinds of layers a GIS can contain: Elevation GIS works in layers: You can begin with Base map data… And add elevation data… And then add the surface geology for the same area… With these layers you can begin to ask question about the area and discover relationships among the features.

61
GIS - Analysis GIS can analyze data in many ways:
Population and demographic data (language distribution in southern Ontario) Physical features for the same area (surface geology) GIS also allows us to view data in a 3D perspective (fly-throughs, etc)
 Physical features for the same area (surface geology) GIS also allows us to view data in a 3D perspective (fly-throughs, etc)")
62
GIS Technology GIS GIS borrows from other software technology: CAD
Graphics Computer Assisted Design and Graphics Software Relational Database Relational Database Management Systems Statistical Analysis Statistical Analysis and Reporting Packages One more thing that we should discuss in relation to the power of GIS is about the actual technology that makes up the software. Once you start working with the software you will realize that most of it is not all that unfamiliar to you. In essence, there are three components that are part of GIS technology. 1.Relational database - A database is a set of data that can share between different applications systems. An example of a relational database is Microsoft Access. This portion of the technology relates to how the location and attribute data are linked together and shared inside a GIS. 2.CAD Graphics - The second component that makes up a GIS is the graphics component. In a GIS you can move features around, change colors and modify the map layout. These are all tasks that are commonly performed in a graphics program such a CorelDraw or Microsoft Paint. 3.Statistical analysis - GIS also has an analysis component included in its technology. You can perform a variety of analytical tasks on the data included in the attribute table such as standard deviation, mean calculations, data summaries and so on. Statistical analysis performed in a GIS is similar to that done is programs such as Microsoft Excel or Corel QuatroPro.

63
Summary - What is GIS? GIS is about using data to describe our world in two ways: Location Data - Where is it? Attribute Data - What is it? GIS software maintains a link between layers of location and attribute data With the Link, we can ask questions about our world…

64
Real World Applications
Environmental Park Management Agriculture Public Utilities Health Care Emergency 911 Real Estate Marketing GIS is used in many different organizations for a whole variety of purposes. The following is an outline of some of the different ways that people use GIS to solve complicated spatial relalated problems. There are obviously hundreds of other uses but we are only going to look at some of the more popular ones.

65
Park Management Will the new building spoil the Park Scenery?
Let's say, for example, you are the manager of a park where people tend to come and do a lot of hiking. As your park becomes more popular and more people are frequenting it, you realize that there is a need to build a new visitors center. However, you want to make sure that the new building isn't visible from the peak of your mountain so as not to spoil the scenery. Using a GIS, you can input the change in elevation across the mountain that hikers are climbing. You can then take a cross section of the mountain and, using what is called a "line of sight" function, you can determine which areas of the mountain are not visible from the peek and thus establish the best place to build your new visitors center. Park planners use Geotechnology to determine if a new Visitor Centre can be seen from the peak.

66
Agriculture How can I improve food production?
Precision farming is becoming more and more significant as farmers are working on smaller areas of land while having to increase crop production. GIS and remote sensing technology is becoming more widespread within this sector. A farmer can use GIS to map out the pH levels across his fields as well as the nitrogen levels and soil types. He may also use it to keep track of which seeds were planted in what location and when they need to be harvested. Advances in remote sensing technology (satellite imagery) allow a farmer to detect the onset of an insect infestation or disease in its early stages - before the human eye is able to notice such a thing. Satellite imagery allows farmers to pinpoint the exact location of a disease so he may localize his pesticide spraying and manage his crops more effectively. Geotechnology is used in making crop management decisions to maximize yields and minimize fertilizer input.
 allow a farmer to detect the onset of an insect infestation or disease in its early stages - before the human eye is able to notice such a thing. Satellite imagery allows farmers to pinpoint the exact location of a disease so he may localize his pesticide spraying and manage his crops more effectively. Geotechnology is used in making crop management decisions to maximize yields and minimize fertilizer input.")
67
Public Utilities Is it safe to dig here?
You have surely seen the sign on the back of phone company trucks or gas company trucks that says "Call before you dig!" Let's say you were going to be building a new fence around your property. You first have to call all the utilities companies and find out where the utility cross your property. In the past, workers from these companies would come out to your house and spray paint your lawn where the utility lines are located. These days, chances are when you call that number, the person on the other end of the phone is sitting in front of a GIS. When you give them your address, they can easily pull up your land parcel, and overlay all of the utility lines. They can then easily fax or mail you a map and you don’t have to wait for someone to come out and spray your lawn before you can begin building your fence. A proposed excavation, identified by address, is compared to pipelines in the area using Geotechnology.

68
Health Care What Communities are at risk from Disease?
A good example of how GIS is used in health care is illustrated by a project done in Guatemala. In parts of the country, an epidemic of River Blindness disease was occurring. It was discovered that mosquitoes are the carriers of this disease. Therefore, health officials used a GIS to map out the area and they plotted the location of mosquito breeding sites. They were then able to accurately assess which communities surrounding these sites were going to be affected by this disease. As a result, they were able to manage their health care treatment facilities much more effectively. Geotechnology identifies communities at risk of River Blindness and helps determine the impact of treatment.

69
Emergency 911 What is the fastest route to the Hospital?
This falls under the same concept of health care but with a different application. When you call an ambulance, you want to know that the ambulance with get to your house as fast as possible and then get you to the nearest hospital as fast as possible. Using a street network file as well as GPS (Global Positioning System) technology, ambulance dispatchers use a GIS to pinpoint the location of the ambulance in relation to your home and establish the quickest route to be taken. A GIS can take into account time of day, traffic volume, one way streets, speed limits and stop signs in order to make sure that the optimal route is taken. Directions can then be printed out or sent via satellite to the ambulance itself. All this can take place within a matter of seconds! Similarly, a delivery service such as UPS or Pizza Pizza would implement the same technology. Geotechnology can choose the fastest route to a hospital. The GIS can take into account traffic and other impediments.
 technology, ambulance dispatchers use a GIS to pinpoint the location of the ambulance in relation to your home and establish the quickest route to be taken. A GIS can take into account time of day, traffic volume, one way streets, speed limits and stop signs in order to make sure that the optimal route is taken. Directions can then be printed out or sent via satellite to the ambulance itself. All this can take place within a matter of seconds! Similarly, a delivery service such as UPS or Pizza Pizza would implement the same technology. Geotechnology can choose the fastest route to a hospital. The GIS can take into account traffic and other impediments.")
70
Real Estate Where is my Dream Home?
This is a really interesting application in using GIS. Traditionally, looking for a house has been a rather long (and sometimes frustrating!) procedure involving you and a real estate agent travelling around a neighborhood in search of your dream home. Obviously, before you begin your search you have established certain criteria that are important to you such as type (house, apartment…), cost, location, proximity to schools, age group of others in the neighborhood and so on. Using a GIS that has all this information stored in its database, you can ask the GIS to show you all the homes for sale that meet your criteria. The GIS will be able to bring up all the listings that fit your criteria. What a GIS allows for is the spatial component that was not there before. You can now narrow down your selection by establishing limits to distances away from schools, parks, shopping centre and so on. More and more we are going to begin seeing GIS used is this type of application. With Geotechnology, an agent can show a map of a neighborhood and a picture or video of the actual properties.
 procedure involving you and a real estate agent travelling around a neighborhood in search of your dream home. Obviously, before you begin your search you have established certain criteria that are important to you such as type (house, apartment…), cost, location, proximity to schools, age group of others in the neighborhood and so on. Using a GIS that has all this information stored in its database, you can ask the GIS to show you all the homes for sale that meet your criteria. The GIS will be able to bring up all the listings that fit your criteria. What a GIS allows for is the spatial component that was not there before. You can now narrow down your selection by establishing limits to distances away from schools, parks, shopping centre and so on. More and more we are going to begin seeing GIS used is this type of application. With Geotechnology, an agent can show a map of a neighborhood and a picture or video of the actual properties.")
71
Marketing How can I optimize my Marketing Campaign?
This is probably one of the fastest growing fields that makes use of GIS. The term Business Geographics is commonly used to describe this type of application. Several colleges specializing in GIS education have implemented a program that is geared specifically towards teaching business applications using GIS. To illustrate one of the uses of GIS in marketing, let's say that you are a jewelry store in a mid-sized town of about 50,000 people and you are going to have a sale. You print up 50,000 flyers and distribute them to everyone in town and you get approximately 500 people to your sale. However, you realize that this is a very expensive way of advertising and you decide to do some research about who your customers are. For several months, as customers come into your store, you ask them what their postal code is. Using a GIS, you begin to plot where all your customers live. Now you can relate that information to demographic information such as age and income to build a database on your customers. Now you can start to do some analysis. Using a GIS, you are able to determine that most of your customers live within a five-kilometre radius of your store and live in areas of above average income. You realize that there are only about 5000 people in your community who meet your customer profile. When you are ready for your next sale, you now only have to print out 5000 flyers and you will get the same 500 people at your sale. Similarly, the information gathered can help you to determine where you should build a new store to better service your customer base. Many companies use this information to send out junk mail. If you notice, areas where there is a high concentration of students will likely receive a great deal of flyers relating to pizza delivery whereas suburban community dwellers may receive flyers about furniture sales and so on. Geotechnology can query a database and identify only those areas with the highest household income within a specified distance of a store.

72
Geosystems 5e An Introduction to Physical Geography
End of Chapter 1 Geosystems 5e An Introduction to Physical Geography Robert W. Christopherson Charlie Thomsen

Similar presentations