Download presentation
Presentation is loading. Please wait.

1
2008 Latino Voter Survey in Key Battleground States Produced by The NALEO Educational Fund and Latino Decisions, Sponsored by AARP October 23, 2008

2
Survey Methodology Telephone survey of Latino registered voters in four key battleground states (Colorado, Florida, New Mexico, Nevada) All interviews conducted by bilingual Latino interviewers Latino Decisions surveyed 1,600 Latino registered voters, Aug 18 – Sept 10, for a total of 400 interviews in each state, with a margin of error of +/- 4.7% for each state Database of registered voters Largest sampling of Latino registered voters in these important states for this election.
 All interviews conducted by bilingual Latino interviewers Latino Decisions surveyed 1,600 Latino registered voters, Aug 18 – Sept 10, for a total of 400 interviews in each state, with a margin of error of +/- 4.7% for each state Database of registered voters Largest sampling of Latino registered voters in these important states for this election.")
3
2008 Latino Voter Survey in Key Battleground States Vote Choice and Issue Priorities

4
Question: How closely are you following news about the 2008 presidential race? COFLNMNV Closely85.686.087.580.9 Not too close9.39.78.713.8 Not at all4.62.83.64.8 Latino interest in the election is at record levels in these four important states

6
Question: Generally speaking, do you think of yourself as a Republican, a Democrat, an independent, or something else? COFLNMNV Democrat62.734.169.361.1 Republican12.335.414.115.7 Independent / other22.626.215.319.8 Continuing a trend noted in 2006, Latino Democratic partisanship has increased

7
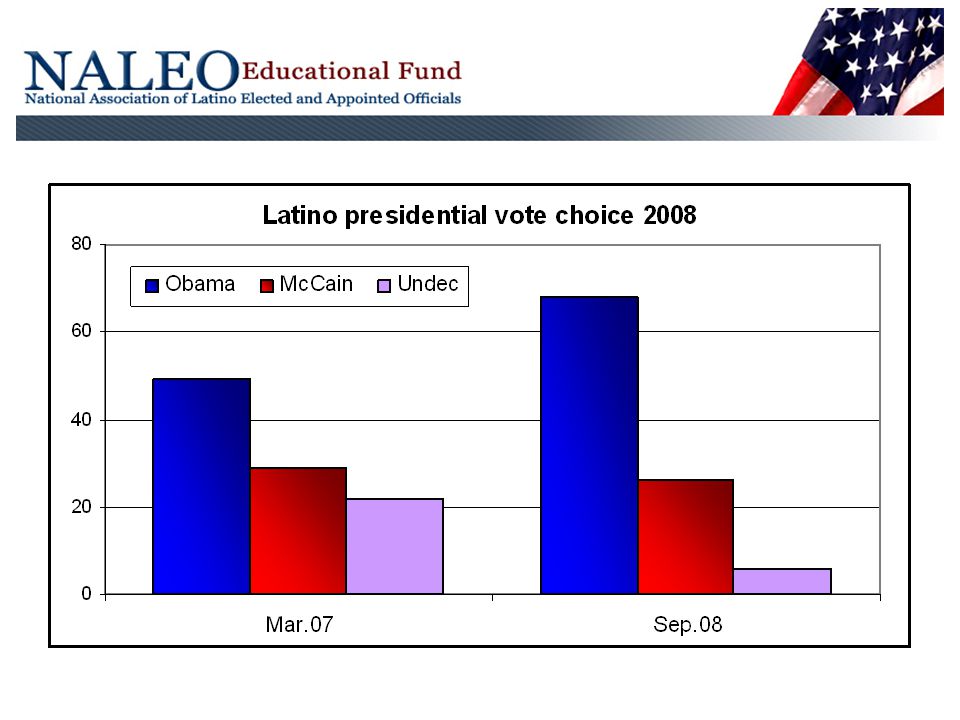
Question: If the 2008 election for President was held today who would you vote for? COFLNMNV Obama / Biden74.145.968.571.2 McCain / Palin20.648.225.521.6 Undecided5.35.96.07.2 Despite low support in the primary, Latinos now support Obama at higher levels than Kerry or Gore

11
Source: Real Clear Politics, poll average, 10/21/08

12
Democrats currently hold a strong edge over Republicans when it comes to positive partisan brand. COFLNMNV Democratic64.039.864.461.5 Republican5.920.34.46.8 No diff / DK30.339.931.331.8 Question: Which political party do you think has more concern for the Latino community?

13
Issues: As with all voters, the economy dominates the agenda COFLNMNV Jobs/Economy48.150.554.954.2 War in Iraq27.330.834.024.7 Health care20.317.019.813.2 Immigration reform13.111.210.926.8 Education11.614.49.415.3 Gas prices12.27.18.89.2 Question: What general issues would be most important to you in deciding who to vote for?

14
The Economy… Question: Over the past year, have you ever had a month where you had a hard time making your monthly payment? All RVs< $40K Colorado35%46% Florida30%49% New Mexico30%48% Nevada28%38%

15
A majority of Latino voters in each of the four states prefer an approach toward immigration reform that combines a concurrent focus on border security and dealing with undocumented immigrants already here. COFLNMNV Border security first15.921.517.214.9 Deal with immigrants first20.916.217.521.4 Do both together51.355.453.454.2 Something else/other option5.13.74.45.5 Don’t know6.93.37.53.9 →

16
Significant majorities of the Latino voters surveyed believe a new direction is needed in Iraq COFLNMNV Should continue current policy6.713.310.29.1 Favor an even larger troop commitment6.56.44.43.2 Should begin reducing U.S. forces45.237.744.234.9 Favor immediate troop withdrawal39.738.738.149.1 Don’t know1.93.93.13.8

17
Universal health insurance has strong support among Latino Voters across all four states Question: Should the Federal government ensure that all people have health insurance, even if it means raising taxes? Yes No Colorado 65% 19% Florida 61% 22% New Mexico 63% 22% Nevada 63% 27%

18
Like many Americans, Latino voters are worried about the future of Social Security Question: Overall, how do you think the social security system for retirement is working in the U.S. Good Poor/Fair Colorado 26% 71% Florida 29% 66% New Mexico 31% 65% Nevada 28% 69%

19
Question: Which candidate do you trust to do a better job at Improving the Economy?

20
Question: Which candidate do you trust to do a better job at Creating more jobs?

21
Question: Which candidate do you trust to do a better job at handling the situation in Iraq?

22
Question: Which candidate do you trust to do a better job at handling Immigration reform?

23
Question: Which candidate do you trust to do a better job at handling health care?

Similar presentations


>")


