Download presentation
Presentation is loading. Please wait.

1
Greenhouse Floriculture A Global and National Perspective

2
Long ago….. Columella describes use of mica sheets ~100 AD (Italy) Roses forced by pouring warm water into trenches 2X day ~380 AD (Italy) Flowers grown in south facing glass pavilions 1385 (France) 1500’s Glass bells used to cover plants 1500’s (Italy)
 Roses forced by pouring warm water into trenches 2X day ~380 AD (Italy) Flowers grown in south facing glass pavilions 1385 (France) 1500’s Glass bells used to cover plants 1500’s (Italy).")
3
Contemporary Bell Jars

4
1602 Dutch East India Company founded

5
Les Orangeries 1600’s orangeries in Europe, glass used in south facing sides and stove heat. Citrus, apricot, peach and grape vineries. Symbols of wealth and prosperity.

6
1632 Oxford Conservatory built. 1675 Hot water heated greenhouse built in England. 1676 Stoves sold with calculated heat outputs.

7
Victorian Greenhouse

8
20 th Century Conservatories

9
Mid 20 th Century Peaked roofed single span greenhouses Single pane of glass Wooden framing Manual control for cooling. Shift from vegetable and fruit production to ornamental production.

10
1973 Oil Crisis: The Organization Of Arab Petroleum Exporting Countries (OAPEC) refused to sell to countries that supported Israel in the Yom Kippur War. Fuel prices soared. Passive Solar Greenhouses returned; however only for small scale and hobby greenhouses.

11
21 st Century Global Greenhouse Floral Production

12
Global Floral Production US18.5%$4.57 Billion Japan14.80%$3.65 Billion Netherlands13.20%$3.25 Billion Nelson 2000 46.5% of the World’s floral products

13
US Fresh Flower Production $595 Million imported $431 Million produced in US. Flower Auction Nelson 2000

14
Quality (high) Productio n Cost (low) Transportation Costs (low) Suitability of a Production Area
 Productio n Cost (low) Transportation Costs (low) Suitability of a Production Area")
15
US Floriculture Crops (wholesale) Top Five States Producing Greenhouse Flora Crops for 2006: 1. California: $1.02 Billion (same as 2005) 2. Florida: $800 Million ( down 16% 2005) 3. Michigan 4. Texas 5. New York
 2. Florida: $800 Million ( down 16% 2005) 3. Michigan 4. Texas 5. New York.")
16
Top 6 to 15 Greenhouse Floriculture Producing States New Jersey Maryland North Carolina South Carolina Pennsylvania Ohio Illinois Oregon Washington Hawaii

17
Popular Cut Flowers Alstroemeria Delphinium F1 LiliesDutch Iris

18
More Cut Flowers Tulips Lisianthus

19
World Production and International Marketing

20
Infrastructure Needs to Start Floral Production in a Developing Country Temperature, light intensity, humidity, daylength Social and political stability, international policies International airport, cooling facilities, competitive air freight costs Affordable and dependable utilities, irrigation, low labor costs Technical support

21
Bedding Plants 33.4% Herbaceous Perennials 13.2% Potted Flowering Plants 16.2% Foliage Plants 14.1% Cut Flowers 10.7% Propagative 9.5% Floricultural Crops 2006 Summary, USDA July 2007

22
Bedding Plants: $1,281,000,000 in 2006 Sales* * Top 15 states, USDA 2006

23
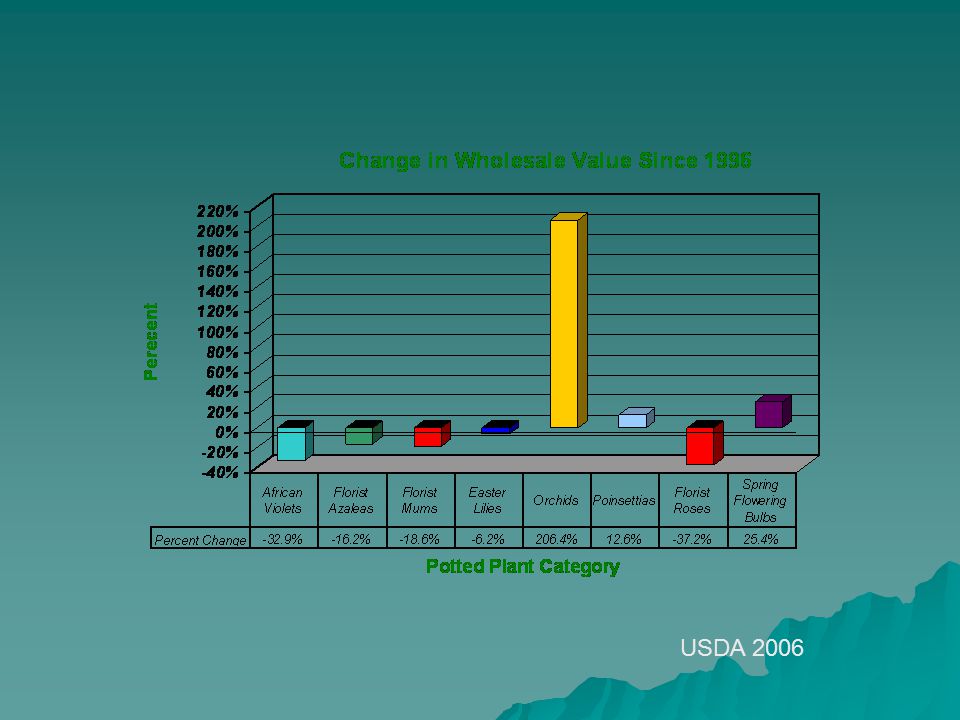
US Potted Plant Production 2005 USDA 2006

25
http://www.hrt.msu.edu/faculty/Runkle/Orchid/Orchid_Research.htm#economic

26
Herbaceous Perennials: 13% of US Floral Production

27
Alocasia calidora Foliage Plants for Indoor and Patio Use: 14% US Floriculture Crops.

28
USDA 2007 Plug Tray Production: 13% of US Floriculture Crops Leaders: FL, MI $ CA Annuals, perennials, potted flowering plants, cut flowers and foliage Plants.

29
USDA 2007 Plug Tray Production: 13% of US Floriculture Crops Leaders: FL, MI $ CA Annuals, perennials, potted flowering plants, cut flowers and foliage Plants.

30
Homework: Read Chapter 2. pp. 41 – 92. Module 1. Question 1. Due Tues. Jan. 22 nd. Module 1. Questions 2 – 6. Due Jan. 29 th. On line: www.uvm.edu~carmstro Tuesday, Jan. 22 nd Bob Rimol Rimol Greenhouse Systems Greenhouse Construction 1 st Lab session 5:00 PM Headhouse

Similar presentations