Download presentation
Presentation is loading. Please wait.

1
Variability and Trends of Air Temperature and Pressure in the Maritime Arctic, 1875-2000 Air Temp. and press. show strong multidecadal variability on timescales of 50- 80 yrs = Low Frequency Oscillation (LFO) Surface albedo, greenhouse gases, and cloud cover can amplify the LFO (shown in GCMs) “there is still a large degree of uncertainty about the role of natural low frequency variability and trends” ??
 Surface albedo, greenhouse gases, and cloud cover can amplify the LFO (shown in GCMs) there is still a large degree of uncertainty about the role of natural low frequency variability and trends .")
2
Data Datasets of monthly SAT/SLP are from many different places in the Northern Hemisphere SAT/SLP time series, data was from stations north of 62°N only Used best 75 of 200 land stations (omitted data pre-1875) The goal of the data set was to get a single time record of monthly SAT/SLP that could explain the Artic/Sub-Arctic air temp and press variability. Figure 1

4
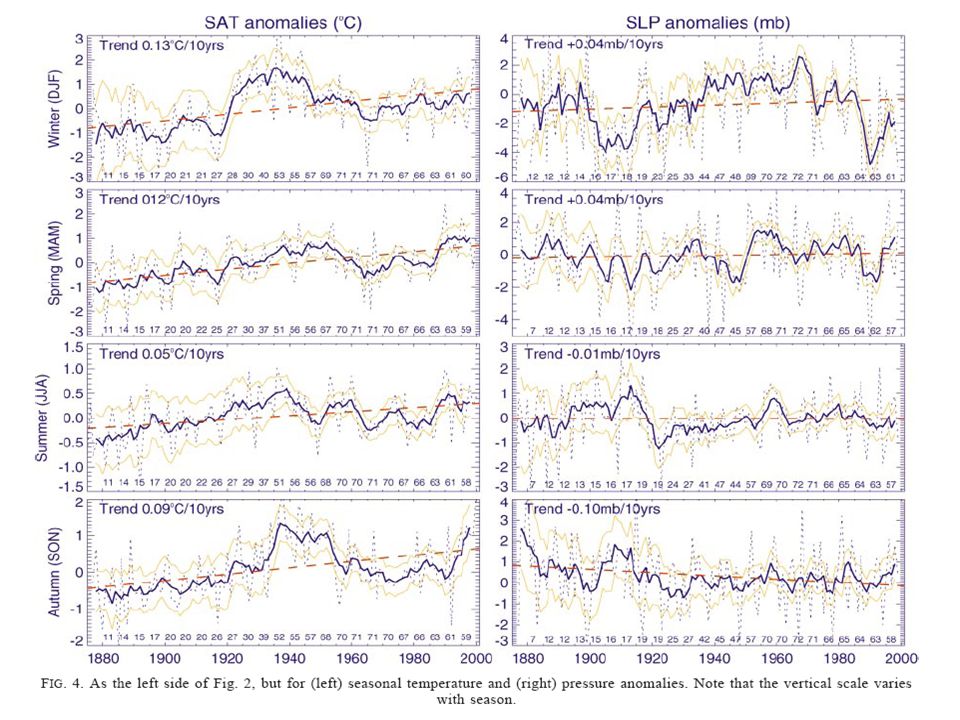
Low-frequency variability SAT shows 2 negative (cold) and 2 positive (warm) phases of LFO Using 1875-2001 Arctic SAT data, a stronger LFO in polar regions compared to low latitudes. Supported by Arctic coastal stations and the North Atlantic Oscillation (NAO). Higher temps in 1930s-40s and lower temps in 1960s-70s are associated with the pos and neg LFO phases SAT/SLP variablilty show strong seasonality, with stronger in cold season and weaker in the warm season. Changes in Arctic atmospheric circulation have large impact of Arctic ice conditions. Cyclonic circulation causes increased wind vorticity that favors thinner ice and ice drifting. Anticyclonic causes decreased vorticity that favors convergent ice producing thicker ice. (today we have cylconic vorticity) Figure 2,3,4,5
. Higher temps in 1930s-40s and lower temps in 1960s-70s are associated with the pos and neg LFO phases SAT/SLP variablilty show strong seasonality, with stronger in cold season and weaker in the warm season. Changes in Arctic atmospheric circulation have large impact of Arctic ice conditions. Cyclonic circulation causes increased wind vorticity that favors thinner ice and ice drifting. Anticyclonic causes decreased vorticity that favors convergent ice producing thicker ice. (today we have cylconic vorticity) Figure 2,3,4,5.")
9
Trends Since 1875, Arctic is warming at rate of.09°C/decade Compared to overall Northern Hemisphere trend, Artic SATs increase twofold from 1875-2001. Vinnikov et al. (1980) also found this twofold polar amplification from 1891-1978 Arctic SAT trends depend on phases and intensity of the LFO with any long-term trends. Northern hemisphere don not show this dependence on the LFO. Figure 2,6 & Table 1
 also found this twofold polar amplification from Arctic SAT trends depend on phases and intensity of the LFO with any long-term trends. Northern hemisphere don not show this dependence on the LFO. Figure 2,6 & Table 1.")
12
Conclusions Arctic air temp and press display a substantial variability on 50-80 yr timescales. SAT trends are stronger in the polar regions Arctic has warmed by 1.2°C since 1875 “The complicated nature of Arctic temperature and pressure variations makes understanding of possible causes of the variability, and evaluation of the anthropogenic warming effect most difficult”

13
Jones et al. 1999

14
Arctic Oscillation (AO)
")
15
North Atlantic Oscillation (NAO)
")
Similar presentations


 1. Is it warming? --climate proxy info (recap) -- info from historical & instrumental records 2. What.>")


