Download presentation
Presentation is loading. Please wait.

1
Kenneth Morley Geog. 8901 10/15/12

2
Review of: “Processes and impacts of Arctic amplification: A research synthesis” by Mark C. Serreze, and Roger G. Barry What is Polar Amplification, (PA)? Is it actually occuring? What are some of the physical processes associated with this change? Has Polar Amplification been observed in Paleoclimate records? Potential impacts of PA.
. Is it actually occuring. What are some of the physical processes associated with this change. Has Polar Amplification been observed in Paleoclimate records. Potential impacts of PA..")
3
Review of: “Role of Polar Amplification in Long-Term Surface Air Temperature Variations and Modern Arctic Warming” by Roman V. Bekryaev Data and Methods Results Graphical Results PA Large Scale Local Conclusions

5
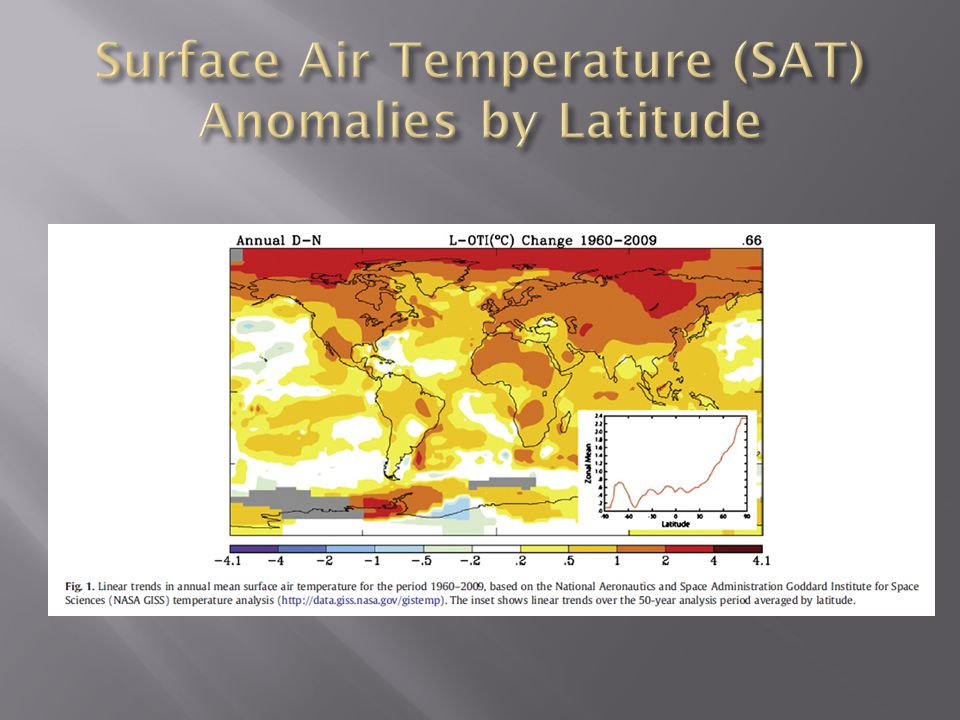
Polar Amplification is a natural process that causes climate change to progress more rapidly at high latitudes (>60degrees) than in the middle of the hemispheres. Most climate scientists and models agree that this amplification is caused by a combination of various feedback loops and is much more pronounced in the Northern Arctic rather than the Southern Antarctic. This will be discussed later. The Intergovernmental Panel on Climate Change (IPCC) found that currently, Arctic warming is on average 1.9 times higher than the global mean warming.
 found that currently, Arctic warming is on average 1.9 times higher than the global mean warming..")
7
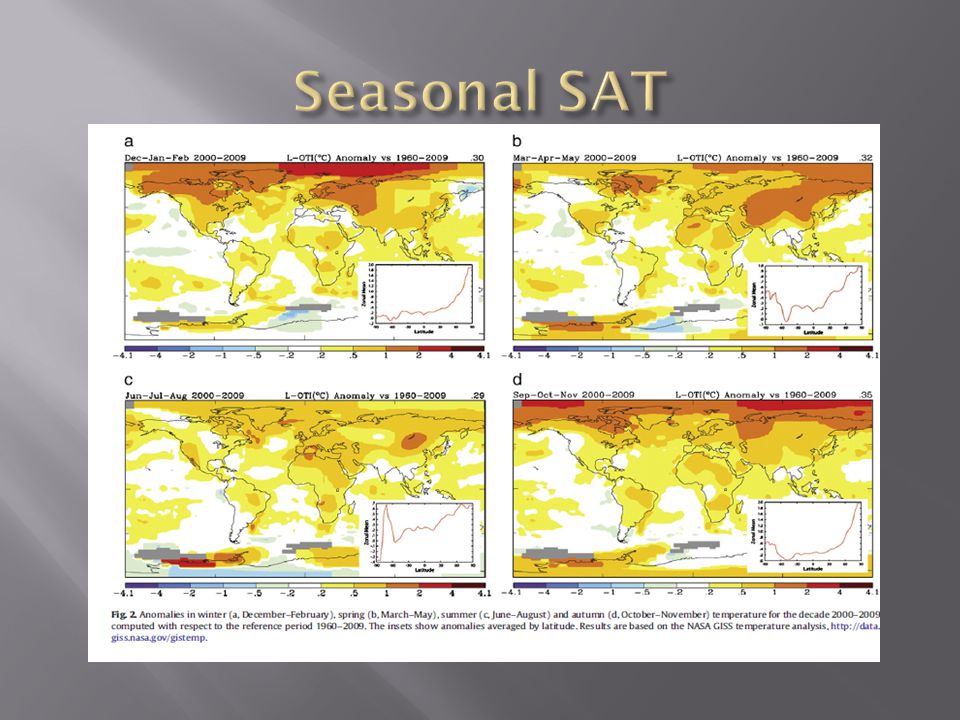
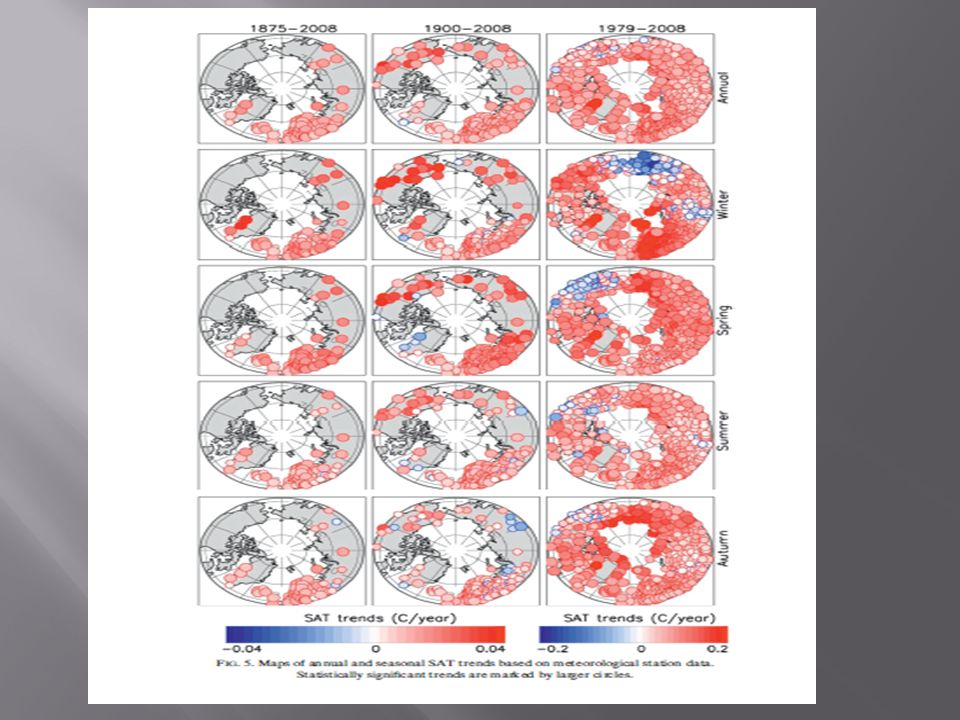
Polar Amplification is much more pronounced in the Fall and Winter seasons. This is largely because of the increased heat capacity gained by the oceans because more of the ice pack melted during the summer.

10
Meteorologist C.E.P Brooks in one of his writings (1949) claimed that winter temperatures in Spitzbergen, Norway (80 degrees N) rose 9 degrees C between 1911 and 1920. A 2002 Study by Igor Polyakov and others, suggested that from 1920-present there was actually Arctic COOLING. He concluded that there is no Polar Amplification occurring. This obviously raised questions among the climate community and this study was reexamined. Those who studied Polyakov’s work concluded that there was far too much bias given to long term observations, and land station data.

11
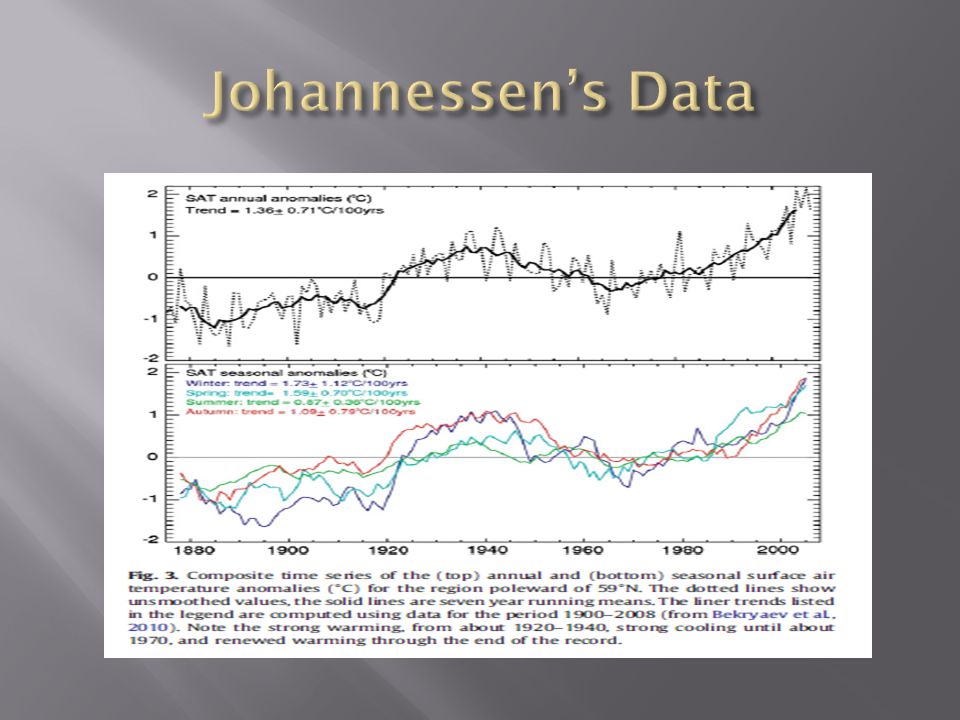
Johannessen et al. took Polyakov’s data and enhanced it using additional land stations and output from the European Centre for Medium-Range Weather Forecasts numerical weather prediction model (1995). This study confirmed a high latitude warming from 1920-1940 and cooling from 1940-1970 that had been found in previous research but also showed recent warming has been enhanced north of the Arctic Coast. This study helped to confirm what had been seen in multiple climate models.
. This study confirmed a high latitude warming from and cooling from that had been found in previous research but also showed recent warming has been enhanced north of the Arctic Coast. This study helped to confirm what had been seen in multiple climate models..")
14
The increased fossil fuel emissions of gases such as carbon dioxide, and methane are causing a warming of our atmosphere. This warming is exaggerated in the Arctic region because of the delicate balance of the Arctic sea ice. As fossil fuels reflect more of Earth’s emitted long wave radiation back to the surface, temperatures rise and ice melts.

15
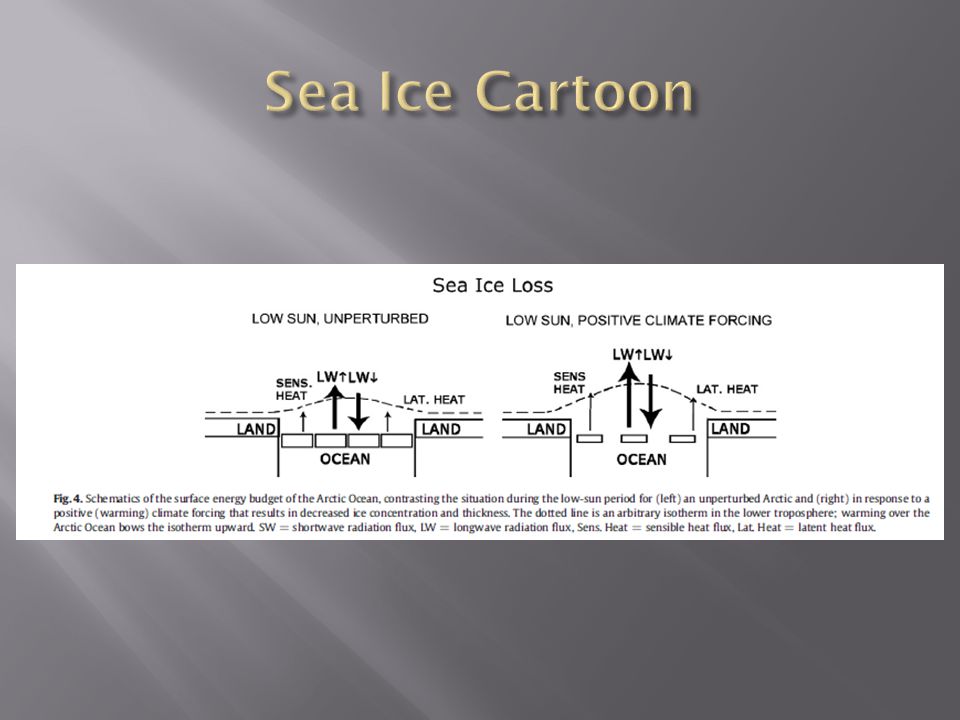
In the Fall, Winter, and Spring seasons, sea ice insulates a warmer ocean from the bitter cold atmosphere. If this ice is not present, the warm (relatively) water can heat the surrounding atmosphere. This heating in turn can cause more ice melt and thus more heating. Sea ice also has a very high albedo. This means that much of the solar radiation that comes in contact with the ice is able to be reflected back into space. When ice melts, it leaves behind large spaces of dark ocean water that absorb the radiation. This increases the oceans heat capacity and causes the ocean to remain warmer after the sun sets going into the polar night. This causes polar amplification to be very strong in the Fall and Winter season.
 water can heat the surrounding atmosphere. This heating in turn can cause more ice melt and thus more heating. Sea ice also has a very high albedo. This means that much of the solar radiation that comes in contact with the ice is able to be reflected back into space. When ice melts, it leaves behind large spaces of dark ocean water that absorb the radiation. This increases the oceans heat capacity and causes the ocean to remain warmer after the sun sets going into the polar night. This causes polar amplification to be very strong in the Fall and Winter season..")
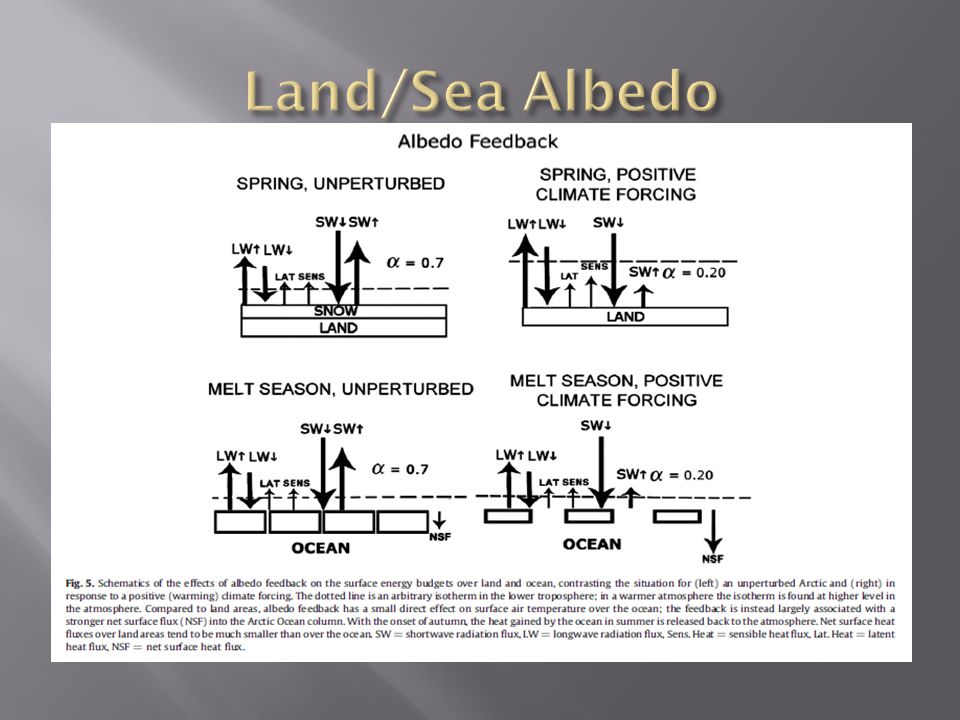
18
Decreased albedo from the melting of ice and snow has a much different effect over land then over the ocean. Over land, increased surface air temperatures cause snow to melt earlier in the spring. This causes the darker ground to be exposed leading to more absorption of solar radiation and higher SAT. This is different than the albedo effect over the ocean because over water, there is a lag to the albedo effect because of the increased heat capacity of the water. This lag is seen in the Fall and Winter months when the ocean is too warm for ice to form.

20
While the PA in the Fall, Winter, and Spring months is dominated by the effects of sea ice and albedo, Summer PA is also present. Studies have shown that most of the Summer warming occurs between the 600 and 800 hPa pressure surface. This lead scientists to believe the atmospheric heat transport was also causing additional warming. A study by Yang et al. discovered that around 50% of the decadal warming was caused by increasing pole ward energy transport.

21
The Atlantic Multi-decadal Oscillation is a temporal oscillation between warm and cool sea-surface temperatures mostly seen in the North Atlantic. This oscillation causes warm sea-surface temperatures that melt ice and prevent new, wintertime ice from forming.

23
One of the most potent greenhouse gases that exist in our atmosphere is water vapor. The poles are usually a very dry environment but with the warmer temperatures, reduced sea ice, and increased vegetation, this could be changing. As the air warms and more solar radiation is being absorbed by the Earth, the air can hold more water vapor. This causes increased heating and higher temperatures.

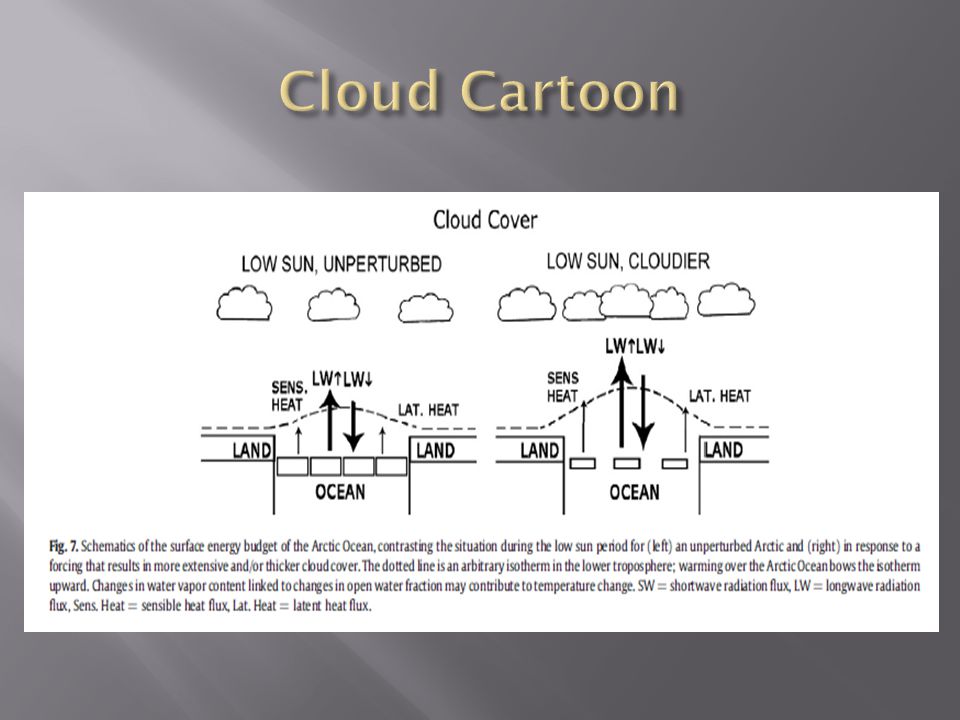
24
The increased temperatures and water vapor cause an increase in clouds. In the Arctic, the radiation balance depends on the absence of low level clouds in order for the Earth to emit long wave radiation directly to space. The increase of temperatures causes an increase in low level water clouds that reflect this terrestrial radiation back to the surface and cause a net warming effect.

27
A small portion of this paper discussed the effect aerosols had on PA. Sulfate aerosols that are produced as a result of combustion actually reflect sunlight and thus have a net cooling effect. However, since we have come up with cleaner combustion techniques, there are less sulfate particles being produced than before. Because most of China uses Coal as a major fuel source, black carbon aerosols are very prevalent and absorb radiation to cause a net warming effect. Shindell and Faluvegi (2009) believe the increase in black carbon and decrease in sulfate aerosols have greatly influenced the Arctic warming over the last three decades.
 believe the increase in black carbon and decrease in sulfate aerosols have greatly influenced the Arctic warming over the last three decades..")
30
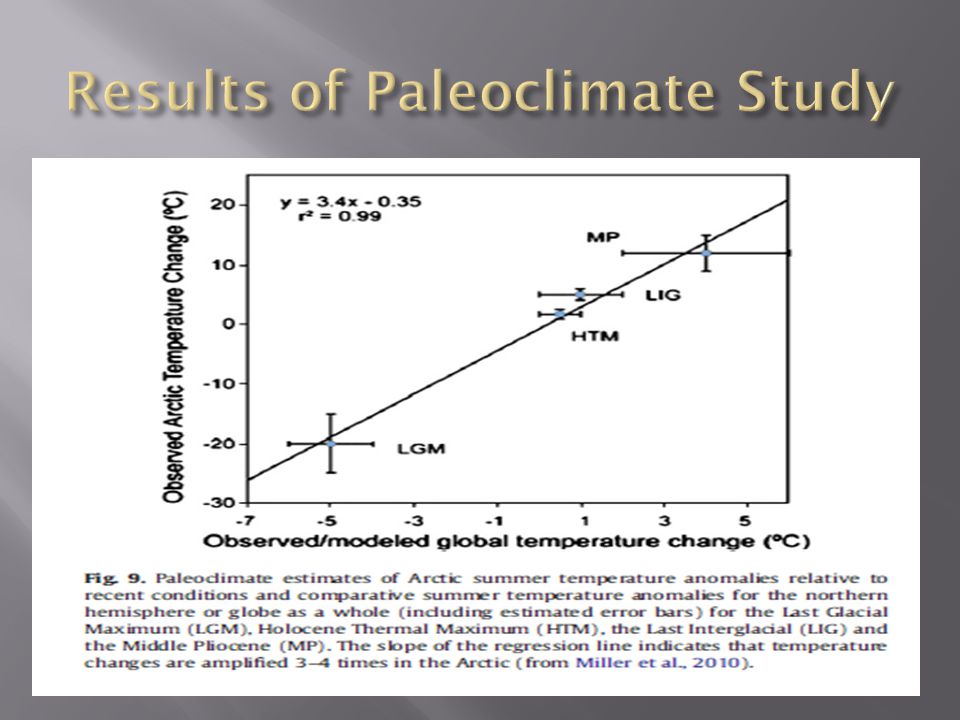
Miller et al. published a study examining the temperatures and PA anomalies for the Holocene Thermal Maximum (HTM, about 9000–6000 years ago), the Last Glacial Maximum (LGM), about 21,000 years ago, the Last Interglacial (LIG, or Eemian) about 130,000–120,000 years ago, and the Middle Pliocene warm period, about 3.5 million years ago. (Mark C. Serreze, and Roger G. Barry, 91) They found that Arctic temperature changes were consistently higher then mean Northern Hemisphere temperatures by a factor of 3-4.
, the Last Glacial Maximum (LGM), about 21,000 years ago, the Last Interglacial (LIG, or Eemian) about 130,000–120,000 years ago, and the Middle Pliocene warm period, about 3.5 million years ago. (Mark C. Serreze, and Roger G. Barry, 91) They found that Arctic temperature changes were consistently higher then mean Northern Hemisphere temperatures by a factor of")
33
The past decade has produced various models and forecasts about how PA will actually affect how we live. In these models, the amount of sea ice is a changeable variable where greenhouse gases and other factors are fixed. This allows scientists to see the impact arctic ice levels have on the atmosphere. One study shows reduction of ice can change the position and intensity of the North American storm track. Others show a weakened polar jet stream that is compensated by stronger low pressure centers located over North America. Finally, a study by Petoukhov and Semenov shows a strong anticyclone formation over the Arctic Ocean that provides for a cooling effect.

34
I personally believe PA is occurring, but the extent and strength is unknown. Even with the multitude of climate models and research projects being performed on this problem, many answers still elude scientists. Much more needs to be learned about the effects of climate change before any major conclusions about PA other than the fact it is occurring can be drawn. We basically know how it is occurring but we do not know the magnitude of the changes.

35
Why is PA not as strong in the Southern Hemisphere as the Northern Hemisphere?

36
Role of Polar Amplification in Long-Term Surface Air Temperature Variations and Modern Arctic Warming by Roman V. Bekryaev.

37
While the first paper dealt more with what polar amplification is, this paper discusses a large scale research project attempting to use new data to see evidence of PA and climate change. The authors discuss new techniques and data sources used as well as results and conclusions.

38
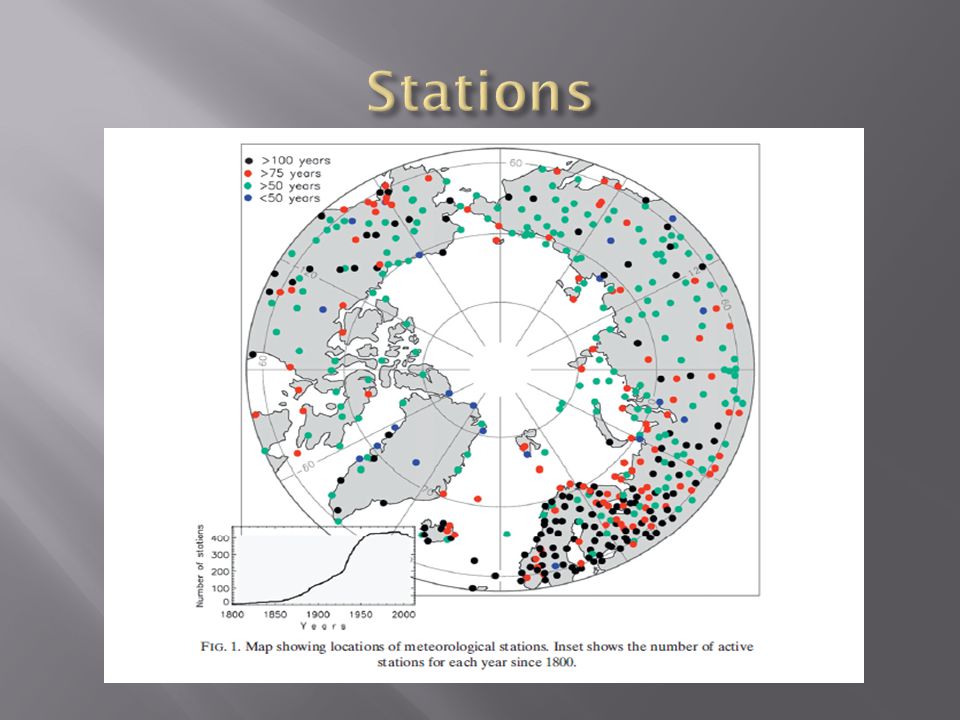
The purpose of this project was to gain a better understanding of Polar Amplification (PA) and the Northern Hemisphere (NH). To do this a vast amount of data was collected. Monthly surface air temperature (SAT) values were taken from 441 stations. Most of these were north of 60 degrees latitude. Some stations in Northern Scotland were between 57-59 degrees North because of a lack of data coverage. A shipboard station was also used.
 values were taken from 441 stations. Most of these were north of 60 degrees latitude. Some stations in Northern Scotland were between degrees North because of a lack of data coverage. A shipboard station was also used..")
40
Data was taken from sources such as The National Snow Ice Data Center, The University Corporation for Atmospheric Research, and various European sites. One major, previously untapped data source that was utilized was the Climatologic Reference Book of the USSR. This book contained SAT records for Soviet weather stations across the nation.

42
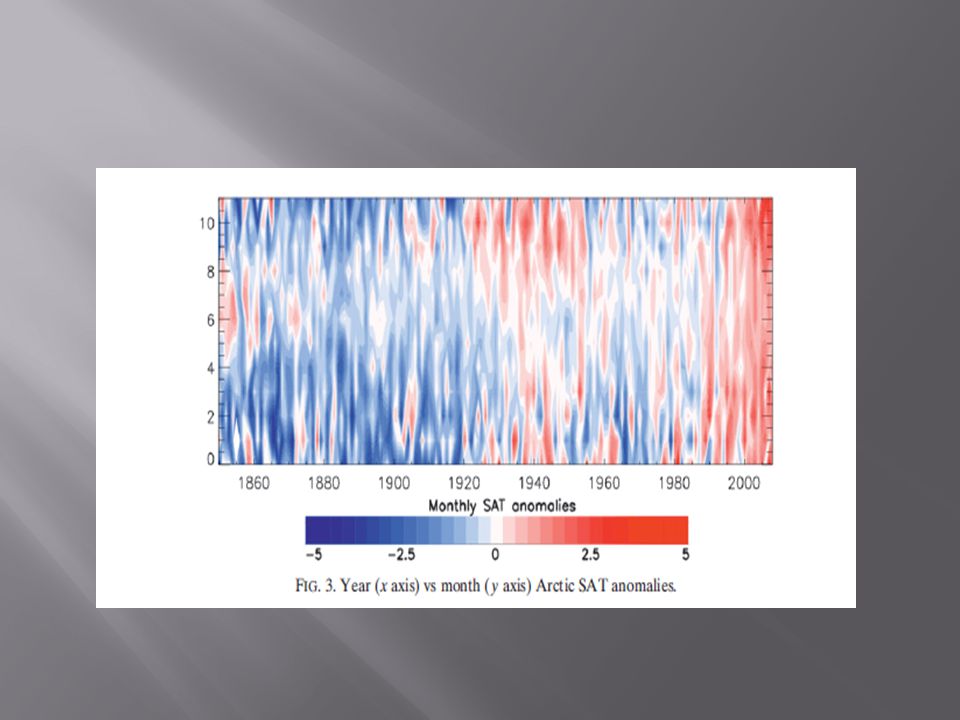
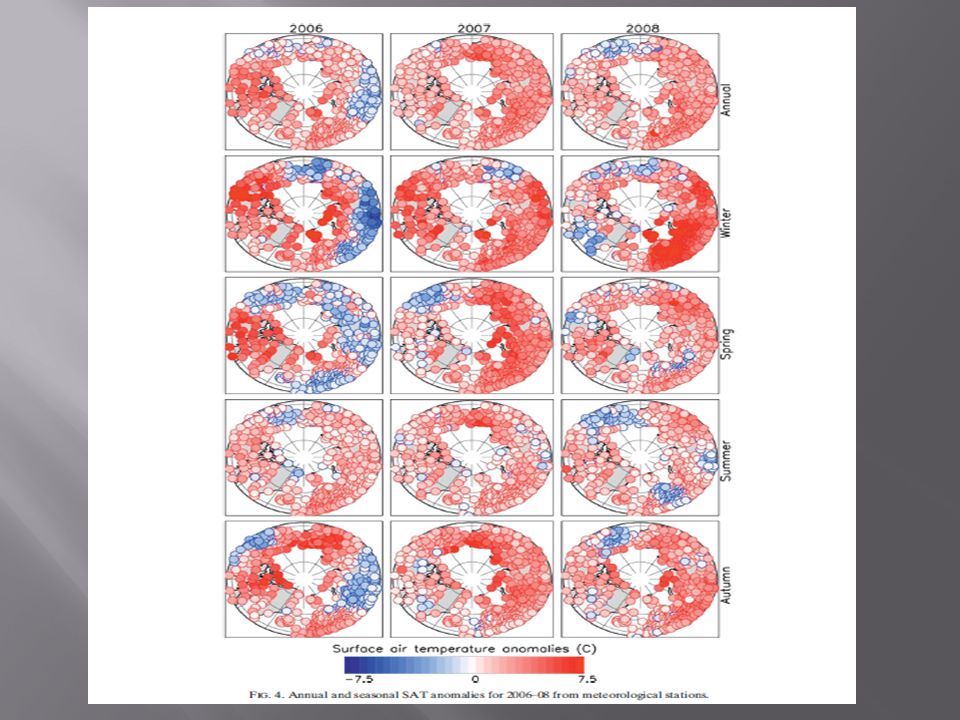
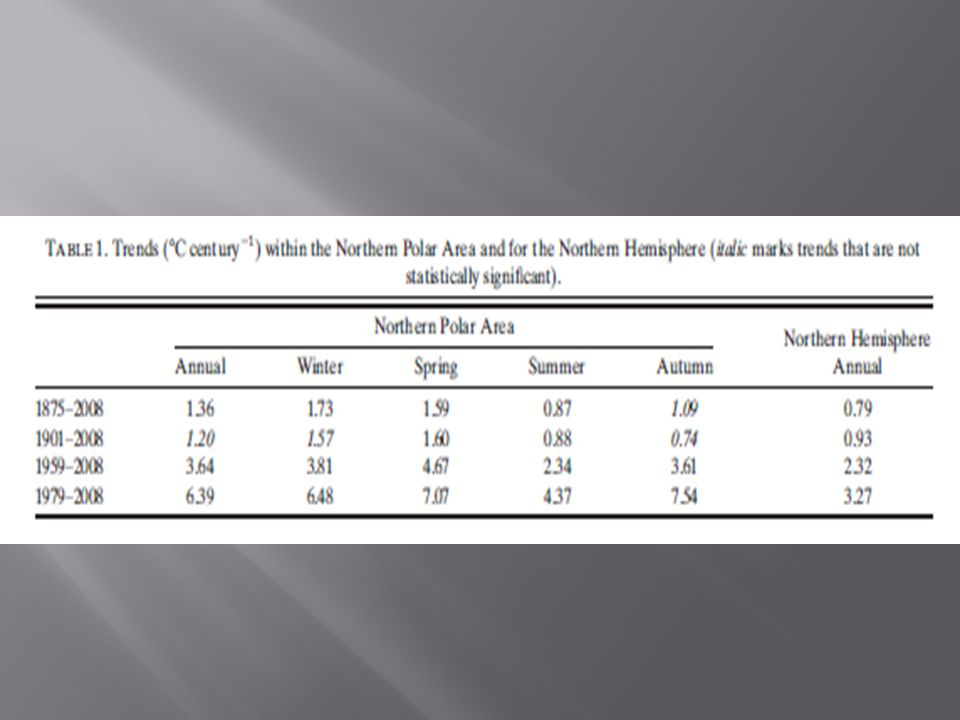
After all the data was compiled, it was determined that Northern Polar Area (NPA) SAT anomalies were highest in 2003, 2005, and 2007. These values were 1.72, 2.11, and 2.18 degrees C respectively. These values also coincided with the lowest Arctic ice cover ever recorded. Data also showed accelerated warming to the tune of.36 degrees C per decade between 1959 and 2008 and.64 degrees C per decades since 1979. Finally, long scale warming of 1.36 degrees C per century from 1875 to 2008 were observed.

48
Two types of PA affect the NPA: Large scale and local scale.

49
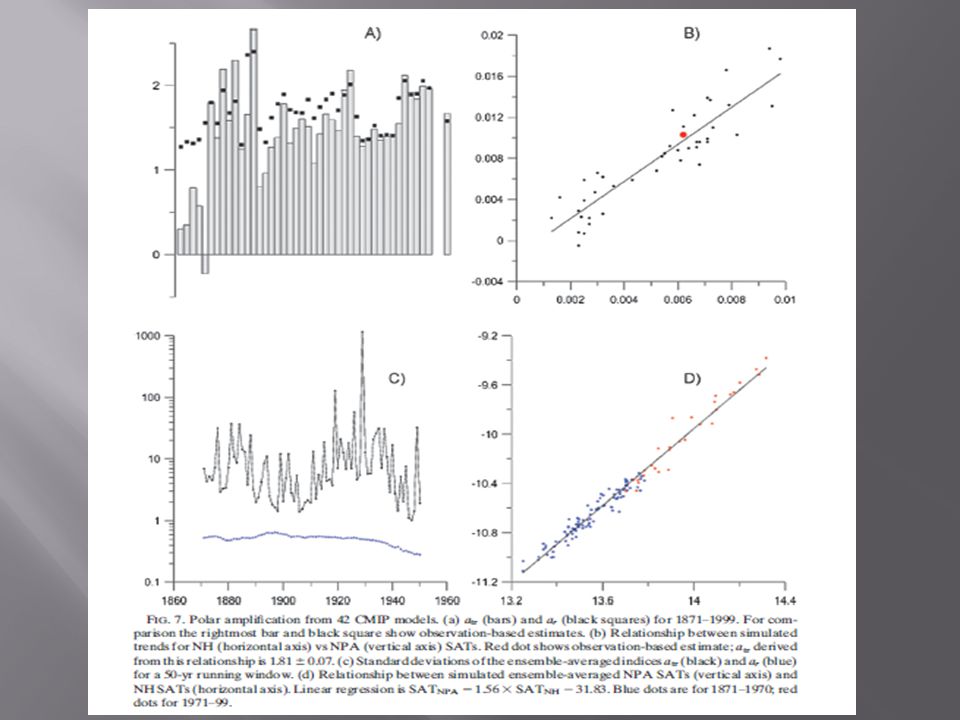
To examine large scale PA, NPA must be compared with NH. This ratio has been used to describe the difference between warming in the polar regions to that of the Northern Hemisphere. However, in this case, an unrealistic number (far too low of.28) was calculated so the authors developed a new technique. In this new technique, a linear regression was taken of the NH and NPA temperature anomalies. The slope of this line was used to determine PA strength.
 was calculated so the authors developed a new technique. In this new technique, a linear regression was taken of the NH and NPA temperature anomalies. The slope of this line was used to determine PA strength..")
52
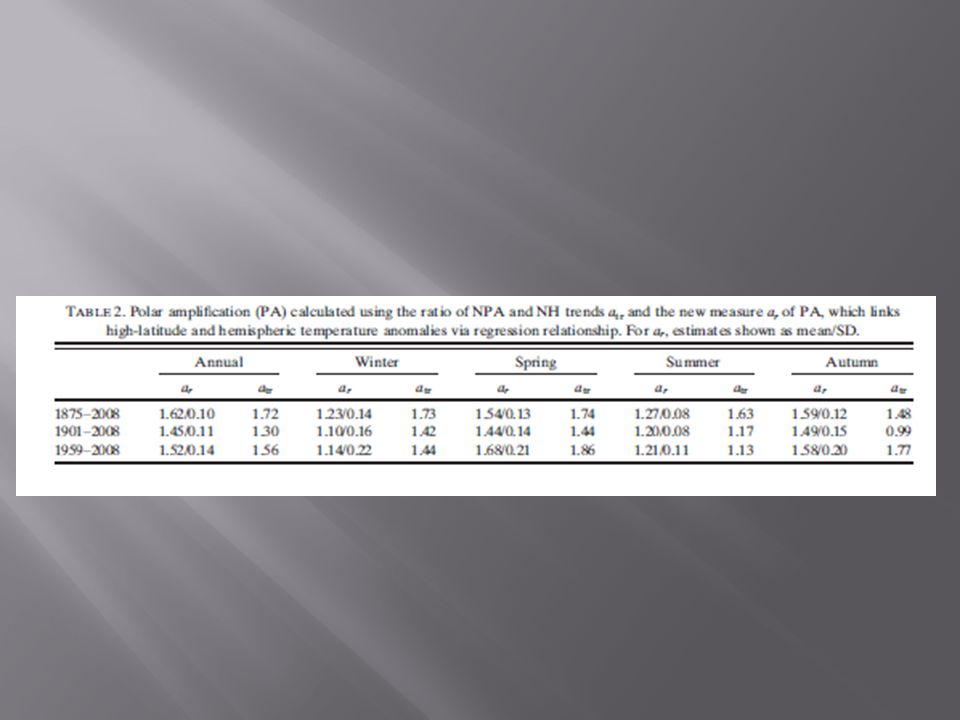
With these values of PA we see a maximum in Fall and Spring. The Fall is explained by the ice albedo effect but the Spring cannot. To make sure the large scale conclusions were not being influenced by local scale forces, the authors compared data to that of stations 250km from the coast. Results showed that values matched to within 15%, so the data was accepted.

53
Ice-albedo feedback is the primary cause of local PA. The authors concluded that this ice-albedo feedback is only relevant during extended warming periods. They believe this is because the models do not include times when the ice pack extends passed the NPA. In the Siberian sector of the Arctic Ocean, a rise of 2 degrees C was recorded and this certainly affects the ice-albedo feedback.

55
Using new data sets it was seen that the NPA was warming at 1.36 degrees C per century. A new technique for quantifying PA was developed and showed PA to be approximately 1.62. Local PA is directly related to the ice-albedo feedback and is seen during extended warm periods.

56
The End! Thank you for your attention!

Similar presentations


 Earth’s surface would be 60F cooler than today…no life.>")
 1. Is it warming? --climate proxy info (recap) -- info from historical & instrumental records 2. What.>")


 McGraw Hill Ryerson 2007 11.2 Human Activity and Climate Change Climate change is the change in long-term weather patterns in certain regions. These.>")

