Download presentation
Presentation is loading. Please wait.

2
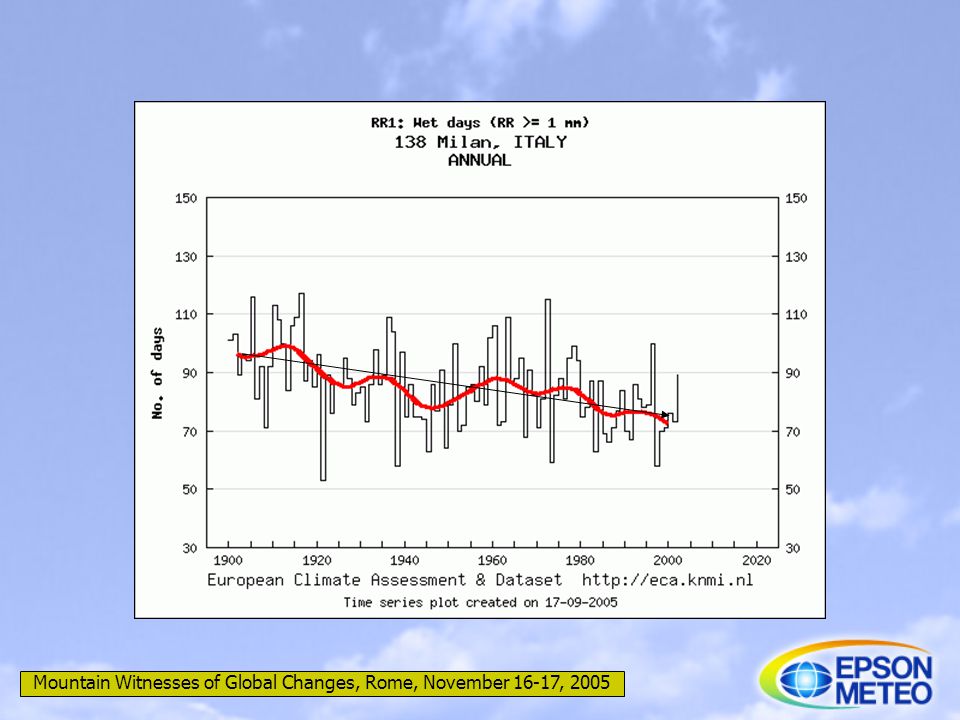
Climate change in Italy An assessment by data and re-analysis models Raffaele Salerno, Mario Giuliacci e Laura Bertolani Mountain Witnesses of Global Changes, Rome, November 16-17, 2005

3
Evidence for climate change The average surface temperature has increased by 0.6 °C Snow cover and ice extent has decreased (-20% Arctic S.I.) Sea level has raised by 10-20 cm and SST has increased Increase in cloud cover More warm episode of El Niño since the mid-1970s Less extreme low temperature and slightly more extreme high temperature (the 20 th century has been the warmest globally in the past 1000 years) Increase of extreme events Mountain Witnesses of Global Changes, Rome, November 16-17, 2005
 Sea level has raised by cm and SST has increased Increase in cloud cover More warm episode of El Niño since the mid-1970s Less extreme low temperature and slightly more extreme high temperature (the 20 th century has been the warmest globally in the past 1000 years) Increase of extreme events Mountain Witnesses of Global Changes, Rome, November 16-17, 2005")
4
Regional climate Climate variability occurs predominantly in preferred large- scale and geographically anchored spatial patterns Patterns result from interactions between the atmospheric circulation and the land and ocean surfaces Amplitude can change in time Examples: ENSO, NAO Emissions and aerosol Mountain Witnesses of Global Changes, Rome, November 16-17, 2005

5
Regional climate SLP has been lower than average over the mid and high latitudes of the North Atlantic Ocean, as well as over much of the Arctic, while it has been higher than average over the sub-tropical oceans, especially the Atlantic. Moreover, in the past thirty years, changes in these leading patterns of natural atmospheric variability appear to be unusual in the context of the observational record Mountain Witnesses of Global Changes, Rome, November 16-17, 2005

6
What about Italy and Mediterranean area? Mountain Witnesses of Global Changes, Rome, November 16-17, 2005 TEMPERATURE....

7
Winters 1979 - 2004 1979 – 19891990-2004 years Mountain Witnesses of Global Changes, Rome, November 16-17, 2005

8
Springs 1979 - 2004 1979 – 19891990-2004 years Mountain Witnesses of Global Changes, Rome, November 16-17, 2005

9
Summers 1979 - 2004 1979 – 19891990-2004 years Mountain Witnesses of Global Changes, Rome, November 16-17, 2005

10
Autumns 1979 - 2004 1979 – 19891990-2004 years Mountain Witnesses of Global Changes, Rome, November 16-17, 2005

13
El Niño ten most relevant events: surface temperature anomaly Land and oceans Oceans Land years Mountain Witnesses of Global Changes, Rome, November 16-17, 2005

14
Frequency spectrum T max Period (y) Mountain Witnesses of Global Changes, Rome, November 16-17, 2005
 Mountain Witnesses of Global Changes, Rome, November 16-17, 2005")
15
Frequency spectrum MEI Period (y) Mountain Witnesses of Global Changes, Rome, November 16-17, 2005
 Mountain Witnesses of Global Changes, Rome, November 16-17, 2005")
16
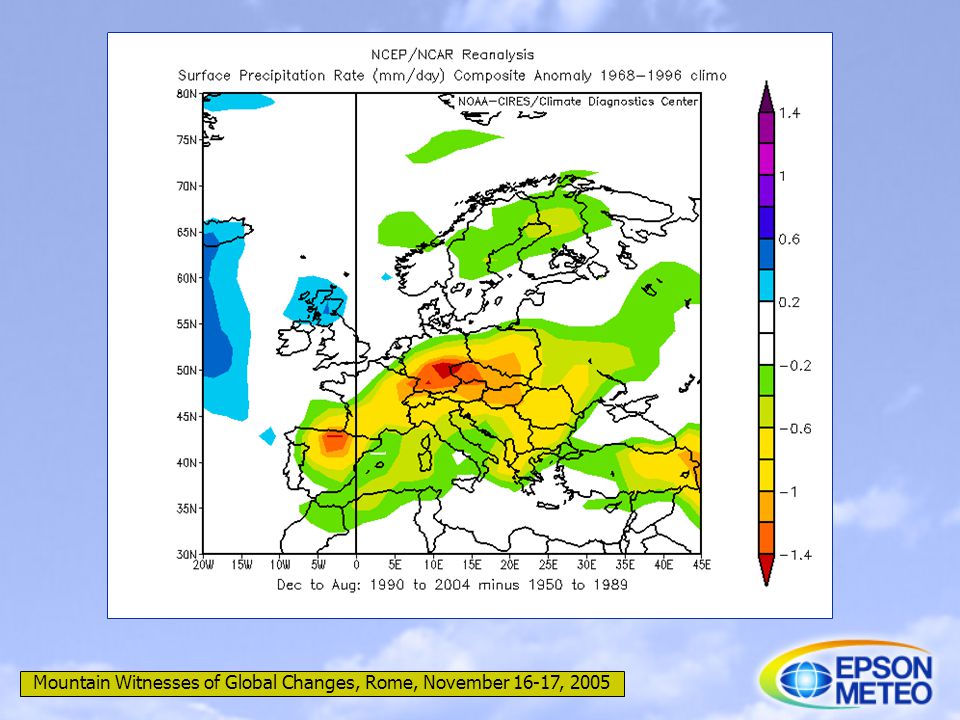
DROUGHTS…. Mountain Witnesses of Global Changes, Rome, November 16-17, 2005 What about Italy and Mediterranean area?

17
1979 – 19891990-2004 Winters 1979 - 2004 years Mountain Witnesses of Global Changes, Rome, November 16-17, 2005

18
1979 – 19891990-2004 Springs 1979 - 2004 years Mountain Witnesses of Global Changes, Rome, November 16-17, 2005

19
1979 – 19891990-2004 Summers 1979 - 2004 years Mountain Witnesses of Global Changes, Rome, November 16-17, 2005

20
1979 – 19891990-2004 Autumns 1979 - 2004 years Mountain Witnesses of Global Changes, Rome, November 16-17, 2005

21
WINTER-SPRING-SUMMER 1961-1993-2000-2001-2003-2005 SPRING-SUMMER-AUTUMN 1983 SUMMER-AUTUMN-WINTER 2001 AUTUNN-WINTER-SPRING NONE Years of rain deficit > 40/50% in 9 MONTHS Mountain Witnesses of Global Changes, Rome, November 16-17, 2005

23
GLACIERS MODIFICATIONS Mountain Witnesses of Global Changes, Rome, November 16-17, 2005 What about Italy and Mediterranean area?

24
Mountain Witnesses of Global Changes, Rome, November 16-17, 2005 -40 m -150 m -100 m

25
STRONGER WINDS AUTUMN-WINTER PERIOD Mountain Witnesses of Global Changes, Rome, November 16-17, 2005 What about Italy and Mediterranean area?

26
Mountain Witnesses of Global Changes, Rome, November 16-17, 2005

28
Increase of extreme events: Floods in autumn Heat waves Extreme rain events Droughts Wind storms Twisters Mountain Witnesses of Global Changes, Rome, November 16-17, 2005

29
Summers with long-period or repeated heat waves: 1952 1957 1965 1971 1974 1983 1988 1994 1995 1998 2003 Mountain Witnesses of Global Changes, Rome, November 16-17, 2005

30
Maximum temperature ( °C) Probability ( % ) to overcome col. 1 value with mean Tmax = 27.5 °C Probability ( % ) to overcome col. 1 value with mean Tmax = 28.4 °C Probability increase (%) 29 30 31 32 33 34 23 11 4 1.2 0.3 0.06 36 20 9 3.2 0.9 0.22 56% 89% 120% 162% 210% 266% The increase of 1 °C of summer mean maximum temperature will have a higher probability of T max > 33-34 °C Mountain Witnesses of Global Changes, Rome, November 16-17, 2005
 to overcome col. 1 value with mean Tmax = 28.4 °C Probability increase (%) % 89% 120% 162% 210% 266% The increase of 1 °C of summer mean maximum temperature will have a higher probability of T max > °C Mountain Witnesses of Global Changes, Rome, November 16-17,")
31
1966 – Florence 1951 – Po valley 1993 – Liguria 1994 – Piedmont 2000 – Piedmont/Val d’Aosta 2002 – Lombardia Latest 60 years floods in Italy… Mountain Witnesses of Global Changes, Rome, November 16-17, 2005

32
…AND THE INCREASE OF EXTREME RAIN EVENT Bari Milan Naples Rome Bologna +380% +250% +220% +200% +190% Turin +190% Mountain Witnesses of Global Changes, Rome, November 16-17, 2005

37
Changes in the atmospheric circulation Mountain Witnesses of Global Changes, Rome, November 16-17, 2005 What about Italy and Mediterranean area?

38
Mountain Witnesses of Global Changes, Rome, November 16-17, 2005 Winter

39
Mountain Witnesses of Global Changes, Rome, November 16-17, 2005 Spring

40
Mountain Witnesses of Global Changes, Rome, November 16-17, 2005 Summer

41
Mountain Witnesses of Global Changes, Rome, November 16-17, 2005 Autumn

42
Mountain Witnesses of Global Changes, Rome, November 16-17, 2005

45
Perspective: do global models provide a sufficiently reliable picture of future climate? GCMs contain detailed representations of the atmosphere, oceans, ice, land surface and vegetation, but they are incomplete: process known to be important are not yet or not fully incorporated, or cannot be described explicitely they reflect or understanding of the way the climate system works; any gaps will be mirrored within the atmospheric and oceanic models tend to drift

46
Mountain Witnesses of Global Changes, Rome, November 16-17, 2005 Perspective: Do global models provide a sufficiently reliable picture of future climate? On the other end: models simulate the most important large-scale processes of climate they produce climate changes consistent with expectations derived from an understanding of the physical processes governing climate they are an essential tool and they are able to reproduce global temperature change from ice age to ice age when the changing tilt of the Earth and greenhouse gases are taken into account

47
Mountain Witnesses of Global Changes, Rome, November 16-17, 2005 NEEDS: Quantifying the Earth System today so that we can predict the future and understand the past : Confronting and evaluating the earth system model with the best possible observing system

48
Mountain Witnesses of Global Changes, Rome, November 16-17, 2005 Epson Meteo Centre and climate studies: present and future developments Modeling at global, regional and local scale Multi-model developments - Predictability Data analysis Inter-compare and evaluate model simulations Downscaling - Feedbacks Ensemble seasonal forecast Statistical studies of time series

49
THE END

Similar presentations


![Climate Change Impacts in the United States Third National Climate Assessment [Name] [Date] Climate Trends.](/15/4626683/big_thumb.jpg "Climate Change Impacts in the United States Third National Climate Assessment [Name] [Date] Climate Trends.>")


