Download presentation
Presentation is loading. Please wait.

1
January 21, 2015 University of Missouri Extension

2
David Reinbott January 21, 2015

3
U.S Corn Production, 1994 to 2014

4
January Corn Production Estimate Minus November Forecast 2005/06 to 2014/15

5
U.S. Average Corn Yield, 1960 to 2014

6
January Corn Yield Estimate Minus November Forecast 2005/06 to 2014/15

7
Jan 15 FSA update 86,504 +219 th 4,093 95.48%

9
December 1 Corn Stocks, 2005/06 to 2014/15

10
First Quarter Feed and Residual Use of Corn 2005/06 to 2014/15

11
First Quarter Corn Consumption Minus Trade Guess 2005/06 to 2014/15

12
Ending Stocks of U.S. Corn

16
March 2015 Corn Futures

17
December 2015 Corn Futures

18
Ron Plain January 21, 2015 Cattle Outlook (title)
")
19
Source: USDA/ERS 10 monthly records in 2014

20
Source: USDA/ERS

21
2014: 33.6 million head, down 1.0% Smallest calf crop since 1948 Source: USDA/NASS U.S. Calf Crop, 1945-2014

22
U.S. Beef Imports & Exports as % of U.S. Production, monthly Source: USDA/ERS

23
Livestock Marketing Information Center Data Source: USDA-AMS & USDA-NASS 2014 cattle slaughter was down 6.9%

24
Livestock Marketing Information Center Data Source: USDA-AMS & USDA-NASS 2014 steer dressed weight up 1.0%

25
Livestock Marketing Information Center Data Source: USDA-AMS & USDA-NASS 2014 cow slaughter was down 13.8%

26
Livestock Marketing Information Center Data Source: USDA-AMS & USDA-NASS 2014 heifer slaughter is down 7.9%

27
Female Share of Slaughter U.S. Federally Inspected Cattle Slaughter Source: USDA/AMS 2014 female sltr was down 10.3%; male sltr down 3.8%

28
Dec 1 cattle on feed: up 1.4% Cattle on Feed Large U.S. Feedlots, Monthly

29
Livestock Marketing Information Center Data Source: USDA-AMS

30
Source: LMIC Cost of Gain is roughly $73/cwt.

31
U.S. Commercial Beef Production Million Pounds * forecast 2013 2014 2015 Qtr 1 6,172 5,868 5,685* Qtr 2 6,516 6,183 6,225* Qtr 3 6,609 6,178 5,955* Qtr 4 6,423 6,020 5,965* Year 25,72024,24923,830* ----- % Change ----- 2013-14 2014-15. - 4.9% - 5.8%. - 5.1% - 1.3%. - 6.4% - 0.9%. - 4.7% - 1.4%. - 5.3% - 2.3%

32
5 Area Slaughter Steer Prices Choice Steers Per Live Hundredweight 2012 201320142015 Qtr 1 $125.29$125.52 $146.34$162-168* Qtr 2 $121.91$124.95 $147.82$160-172* Qtr 3 $119.69$122.30 $158.49$157-171* Qtr 4 $125.54$130.77 $165.62$158-172* Year $122.86$125.89 $154.56$159-171* *forecast

33
Nebraska Slaughter Steer Price Monthly Average 2000-2014

34
OKC 750-800# Feeder Steer Price Monthly Average 2000-2014

35
Livestock Marketing Information Center Data Source: USDA-AMS & USDA-NASS, Compiled & Analysis by LMIC

36
David Reinbott January 21, 2015

37
U.S. Soybean Production, 1994 to 2014

38
January Soybean Production Estimate Minus November Forecast: 2005/06 to 2014/15

39
U.S. Average Soybean Yield, 1960 to 2014

40
January Soybean Yield Estimate Minus November Forecast 2005/06 – 2014/15

41
Jan 15 FSA update 81,757 +131 th 1,944 97.67% NASS and FSA Planted Acres of Soybeans, 2007 to 2014

42
December 1 Soybean Stocks, 2005/06 to 2014/15

43
First Quarter Feed and Residual Use of Soybeans, 2005/06 to 2014/15

44
Ending Stocks of U.S. Soybeans

48
2015 March Soybeans

49
2015 November Soybeans

50
Ron Plain January 21, 2015 Hog Outlook (title)
")
51
U.S. Retail Pork Prices, 2000-2014 Source: USDA/ERS

52
Cost of Slaughter Hog Production, 2000-2015 Source: Iowa State University & University of Missouri

54
U.S. Pork Imports & Exports as % of U.S. Pork Production, 2006-2014 Source: USDA/ERS

55
New PEDV & PDCoV Cases by Week NAHLN Reports Source: AASV & NAHLN

56
U.S. Pigs Per Litter by Month January 2014 PPL lowest since January 2009

57
record 2014 average was 284.4 lbs, up 8.5 lbs from 2013

58
Livestock Marketing Information Center Data Source: USDA-AMS & USDA-NASS 2014 hog slaughter was down 5.0%; pork production is down 1.9%

59
December Hog Inventory Source: USDA NASS

60
Sows Farrowed by Quarter - U.S. Source: USDA/NASS

61
Data Source: USDA-AMS, Compiled & Analysis by LMIC Livestock Marketing Information Center

62
Commercial Pork Production Forecast Million Pounds * forecast 2013 2014 2015 Qtr 1 5,777 5,785 5,935* Qtr 2 5,519 5,504 5,735* Qtr 3 5,622 5,423 5,845* Qtr 4 6,274 6,140 6,380* Year 23,18722,85223,895* ------Change------ 2013-14 2014-15. + 0.1% +2.6% - 0.3% +4.2% - 3.6% +7.8% - 2.1% +3.9% - 1.4% + 4.6%

63
Iowa-Minn Hog Price Forecast Negotiated Base Price Per Carcass Hundredweight 2012 2013 2014 2015 Qtr 1$84.78$80.17$ 95.15 $80-84* Qtr 2$85.45$89.33$115.67 $88-92* Qtr 3$83.15$95.36$111.79 $87-91* Qtr 4$79.93$82.36$ 88.78 $74-78* Year$83.36$86.87$102.85 $82-86* * forecast price – prior day purchased

64
Net Slaughter Hog Price Monthly Average 2002-2014

65
Iowa Farrow to Finish Profits, 2006-2015 Forecast Source: Ron Plain, University of Missouri

66
David Reinbott January 21, 2015

67
USDA Reports on January 12 Qtrly stocks 1.52 bil bu, 25 mil bu avg trade est. Winter acres 40.5 mil ac down 2.0 from last yr and 2.0 million acres below trade estimates. Soft red winter – 7.5 mil ac down 1.0 from last yr. and 0.5 mil. ac. below trade estimates. Ending stocks up 33 mil bu at 687 mil bu. Feed down 30 mil bu. World ending stocks 196.0 mil tons, up 1.1 mt. Russia, U.S. winter wheat condition

68
2012-13 2013-14 2014-15 Acres Planted (mil.) 55.3 56.256.8 Avg. yield/acre (bu.) 46.2 47.143.7 Supply: (bil. bu.) Beg. Stocks0.7430.718 0.590 Production2.2522.135 2.026 Total Supply3.1183.021 2.796 Use: Feed0.3700.226 0.150 Food & Seed1.0181.029 1.034 Exports1.0121.176 0.925 Total Use2.4002.4321 2.109 Ending Stocks0.7180.590 0.687 Avg. price/bu.$7.77$6.87 $6.10 Supply & Demand: Wheat
 Supply: (bil. bu.) Beg. Stocks Production Total Supply Use: Feed Food & Seed Exports Total Use Ending Stocks Avg. price/bu.$7.77$6.87 $6.10 Supply & Demand: Wheat.")
71
2015 July Wheat

72
Joe Horner January 21, 2015

73
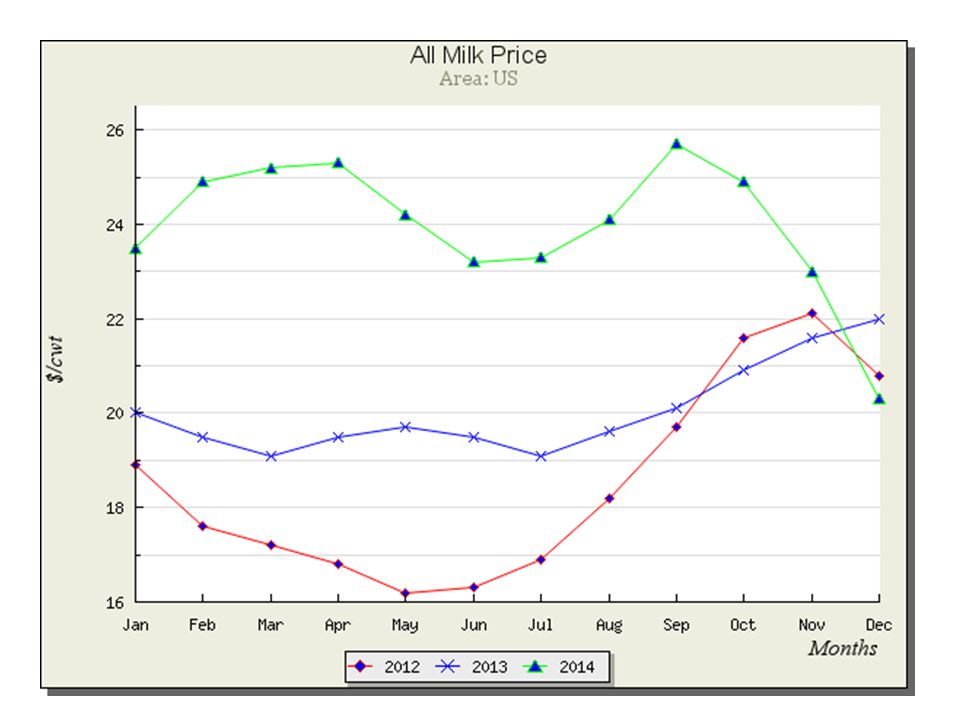
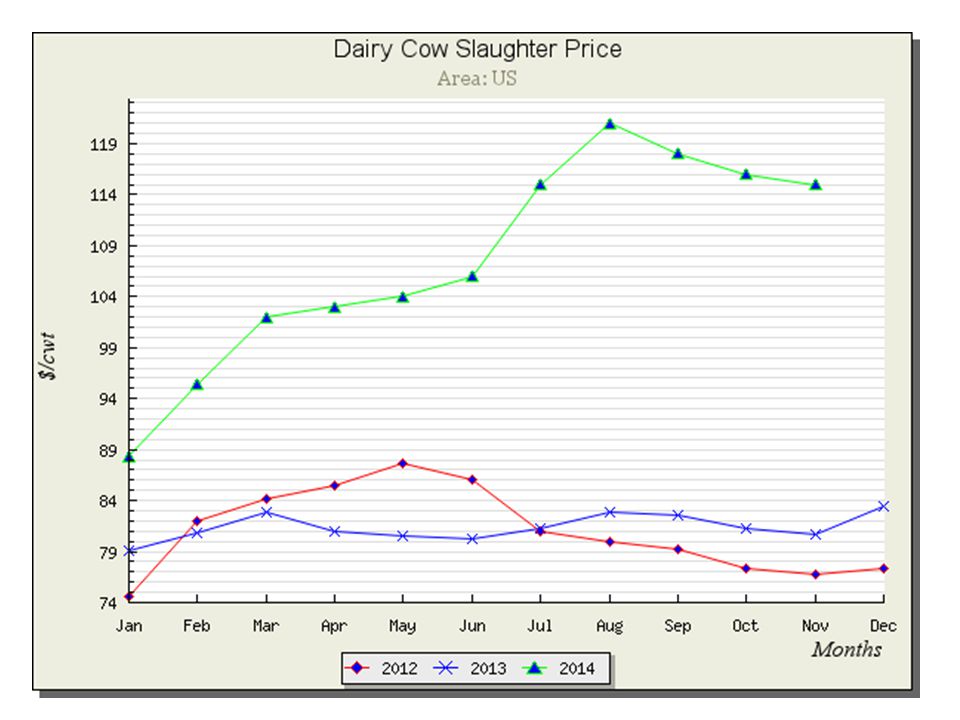
Dairy Outlook in a Nutshell Supply Bearish –US cow numbers – rising slowly 0.9% (Dec 2014 year over year) –US milk per cow – rising 2.4% (Dec 2014 year over year) –US milk production – rising 3.4% –Concerns about where to go with spring flush milk Demand Bearish –Domestic – Product pipeline refilling –Exports – NZ up 3.8% thru Dec, strong $ limits exports –Global – dairy product prices stabilizing OutlookBearish –Margins squeezed till milk supply adjusts –Cull cow prices vs milk prices dictate length of low prices
 –US milk per cow – rising 2.4% (Dec 2014 year over year) –US milk production – rising 3.4% –Concerns about where to go with spring flush milk Demand Bearish –Domestic – Product pipeline refilling –Exports – NZ up 3.8% thru Dec, strong $ limits exports –Global – dairy product prices stabilizing OutlookBearish –Margins squeezed till milk supply adjusts –Cull cow prices vs milk prices dictate length of low prices")
77
Stocks – Rising Bullish Neutral Bearish

80
USDA Margin Protection Program http://www.fsa.usda.gov/FSA/pages/content/farmBill/fb_MPPDTool.jsp MPP SignupMissouriUSA Signed up 70%50% > $4.00 margin protection 79%55%

81
Dairy Price Outlook 1 st Quarter 2014 2 nd Quarter 2015 2015 USDA – All Milk Price December 16, 2014 $20.00- $20.50 $17.00- $17.80 $18.45- $19.25 CME Group Futures Class III January 16, 2014 14.8214.2915.25 CME Group Futures Class IV January 14, 2014 13.4513.7014.70 MO Farm Forecast$16.50$15.75$17.00

Similar presentations


. Source: USDA/ERS 10 monthly records in 2014.>")


 –US milk per cow.>")


