Download presentation
Presentation is loading. Please wait.

1
Ron Plain D. Howard Doane Professor University of Missouri-Columbia http://web.missouri.edu/~plainr Chicken & Competing Meats

2
The darker the color, the more severe the drought

3
U.S. Average Corn Yield, 1970-12 Source: USDA/NASS Lowest yield per acre since 1995

4
Livestock Marketing Information Center Data Source: USDA-NASS, Compiled & Analysis by LMIC

5
Drought Impact Drought causes reduced crop production which causes higher feed prices which causes red ink for livestock & poultry which leads to herd/flock reduction which adds meat in the short run but eventually means less meat and higher meat prices which means better profits and herd expansion

6
Biology of Herd Reduction Cattle –Move calves from pasture to feedlots sooner –Sell cows and breeding heifers Pigs –Sell pigs sooner –Sell sows and breeding gilts Chickens –Sell fewer heavy weight birds

7
Biology of Animal Reproduction Cattle –9 months of gestation –18-24 months of growth Pigs –4 months of gestation –6 months of growth Chickens –3 weeks of incubation –6 weeks of growth

8
Feed Cost

9
U.S. Corn Acres Planted, 1970-12 2012: most since 1937 Source: USDA/NASS

10
U.S. Corn Production, 1970-12 Source: USDA/NASS Smallest corn harvest since 2006

11
U.S. Corn Exports, 1975-12 Source: USDA/NASS

12
Corn Milled for Ethanol Forecast % corn for ethanol: 2000-01: 6% 2005-06: 14% 2007-08: 23% 2009-10: 35% 2012-13: 42% Source: USDA/NASS

13
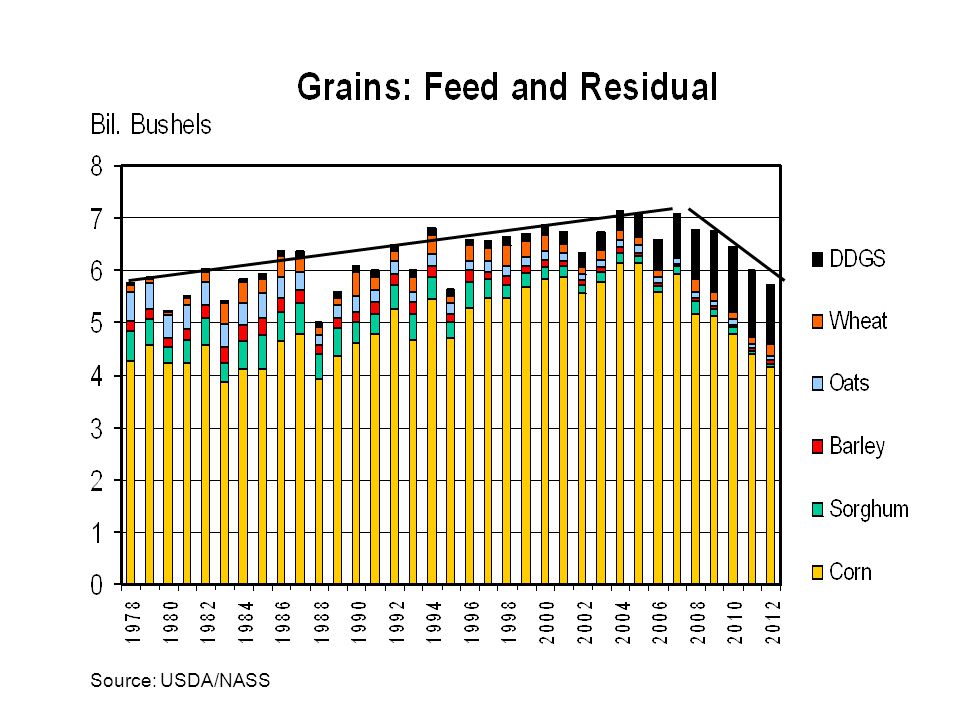
US Feed & Residual Use of Corn, 1975-12 Source: USDA/NASS

16
September Corn Futures Daily Close, 2012 Source: CMEGroup

17
U.S. Corn Price, 1970-12 Source: USDA/NASS

18
Livestock Marketing Information Center Data Source: USDA-AMS

19
Livestock Marketing Information Center Data Source: USDA-AMS

20
Livestock Marketing Information Center Data Source: USDA-AMS

21
U.S. Monthly Average Corn Price Thru Dec 2015 all corn futures contracts are above $5.85 per bushel

22
South America A large soybean harvest is expected –Brazil up 22% –Argentina up 34%

23
Meat Demand

24
Growth in Real GDP Source: U.S. Commerce Department

25
U.S. Civilian Employment, 1948-2012 Source: Bureau of Labor Statistics, household survey, seasonally adjusted & MU, 1.00143/month In September 2012, U.S. 17.7 million jobs under trend

26
Gasoline Prices & Meat Demand, 1999-2012 Source: U.S. Energy Information Administration Correlation = -0.37

27
Index of Retail Meat Demand Base Elasticity = - 0.75 Source: Ron Plain, MU

28
Boneless Retail Meat Prices as % of Bologna, Monthly, 2007-2012 Source: USDA/ERS

29
Change in Retail Meat Demand Base Elasticity = - 0.75

30
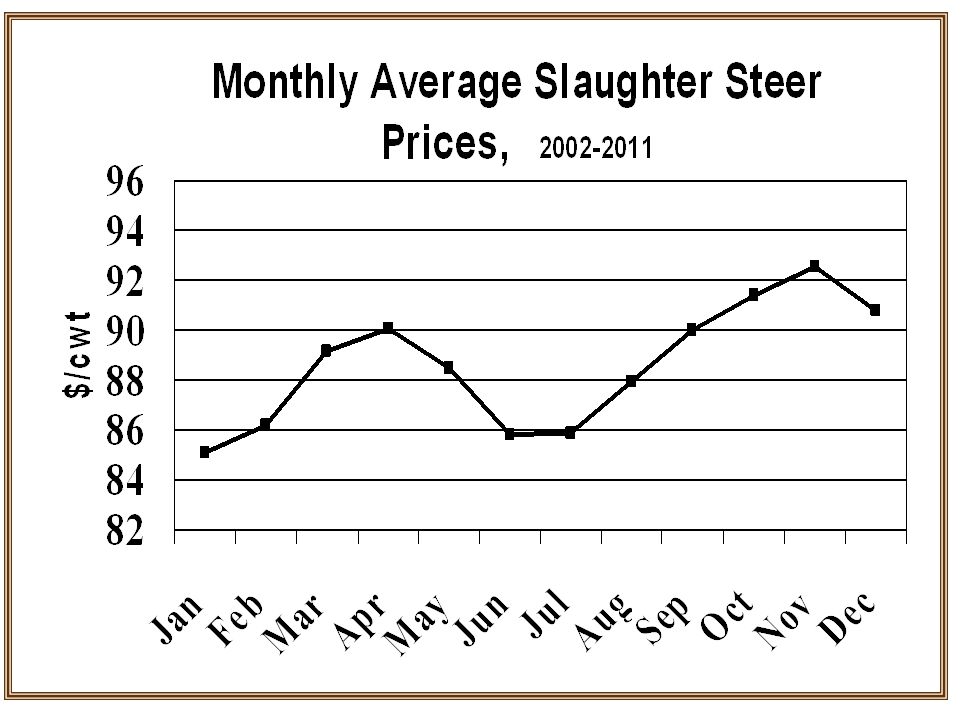
Seasonal Price Patterns

31
Livestock Marketing Information Center Data Source: USDA-AMS

33
Seasonal Average Hog Price Source: USDA Prior Day Slaughter reports $/cwt

34
Broiler Situation

35
Livestock Marketing Information Center Data Source: USDA-NASS

36
Livestock Marketing Information Center Data Source: USDA-NASS

37
Livestock Marketing Information Center Data Source: USDA-NASS

38
Livestock Marketing Information Center Data Source: USDA-AMS & USDA-NASS Broiler slaughter is down 4.0%

39
Livestock Marketing Information Center Data Source: USDA-AMS & USDA-NASS Broiler production is down 4.1%

40
Livestock Marketing Information Center Data Source: USDA-AMS

41
Livestock Marketing Information Center Data Source: USDA-AMS

42
Livestock Marketing Information Center Data Source: USDA-AMS

43
Livestock Marketing Information Center Data Source: USDA-AMS

44
Broiler Price & Production 2012 broiler production is expected to be down 1.2% from 2011 with wholesale prices that are 6.3% higher than in 2011. 2013 broiler production is expected to be down 1.1% from 2012 with wholesale prices that are 4.8% higher than in 2012. Source: USDA-OCE WASDE, September 2012

45
Plain’s Forecast 2011+1.8% 79 cents/lb 2012- 1.5% 86 cents/lb 2013- 1.4% 90 cents/lb 2014+2.3% 85 cents/lb Broiler Broiler Production Price

46
Turkey Situation

47
Livestock Marketing Information Center Data Source: USDA-AMS & USDA-NASS Turkey production is up 1.8%

48
Livestock Marketing Information Center Data Source: USDA-AMS

49
Turkey Production 2012 turkey production is expected to be up 2.9% from 2011 with wholesale prices that are 5.4% higher than in 2011. 2013 turkey production is expected to be down 3.2% from 2012 with wholesale prices that are 0.9% lower than in 2012. Source: USDA-OCE WASDE, September 2012

50
Cattle Situation

51
2012: 90.8 million head, Down 2.1% Lowest inventory since 1952 Source: USDA/NASS

52
July 2012 Cattle Inventory percent of year earlier All Cattle & Calves 97.8 Beef Cows 97.1 Dairy Cows100.0 Beef Replace. Heifers100.0 Dairy Replace. Heifers 97.6 Other Heifers 97.4 Steers 500 lbs & up 98.6 Calves under 500 lbs 97.4

53
2012: 34.5 million head, Down 2.3% Source: USDA/NASS

54
2011: 26.2 billion pounds, down 0.4%

55
July 2012 Cattle Inventory percent of year earlier Steers 500 lbs & up98.6 Other heifers 97.4 Calves under 500 lbs97.4 Combined97.8 Combined 97.8% = 2.2% fewer cattle being kept for marketing which should mean the number of fed cattle marketed in coming months will be down 2.2%

56
Livestock Marketing Information Center Data Source: USDA-AMS & USDA-NASS, Compiled & Analysis by LMIC

57
2012 cow slaughter is down 4.6%

58
Beef Price & Production 2012 beef production is expected to be down 1.6% from 2011 with slaughter steer prices that are 5.5% higher than in 2011. 2013 beef production is expected to be down 4.3% from 2012 with slaughter steer prices that are 5.0% higher than in 2012. Source: USDA-OCE WASDE, September 2012

59
Plain’s Forecast 2011- 0.4%$114.73/cwt 2012- 1.8%$122/cwt 2013- 3.3%$132/cwt 2014- 3.8%$135/cwt Beef Steer Production Price

60
Pork Situation

61
Annual U.S. Pork Production, 1930-2011

62
Source: USDA/NASS

63
Hog Inventory Reports U.S. Sept Canada July

65
U.S. Pigs Per Litter by Quarter

66
Pork Price & Production 2012 pork production is expected to be up 2.0% from 2011 with slaughter hog prices that are 8.5% lower than in 2011. 2013 pork production is expected to be down 1.3% from 2012 with slaughter hog prices that are 6.6% higher than in 2012. Source: USDA-OCE WASDE, September 2012

67
Plain’s Forecast 2011+ 1.4%$87.56/cwt 2012+ 2.4%$82.00/cwt 2013+ 0.0%$85.00/cwt 2014+ 1.0%$87.00/cwt Pork Carcass Production Price

68
Meat Trade

69
U.S. Meat Exports, 1980-2011

70
Meat Imports/Exports as % of U.S. Production In 2011, the U.S. exported –10.6% of beef production –22.8% of pork production –18.8% of broiler production –12.1% of turkey production In 2011, U.S. imports equaled –7.8% of beef production –3.5% of pork production –0.3% of broiler production –0.4% of turkey production

71
Livestock Marketing Information Center Data Source: USDA-FAS

72
Livestock Marketing Information Center Data Source: USDA-FAS

73
Livestock Marketing Information Center Data Source: USDA-FAS

74
Meat Situation

75
Source: USDA/ERS 2013 per capita meat consumption lowest since 1990

76
Source: USDA/ERS

77
Forecast Change in Meat Production --Percent Change-- Type 2011-122012-13 Beef - 1.6% - 4.3% Pork +2.0% - 1.3% Chicken - 1.2% - 1.1% Turkey +2.9% - 3.2% All Meats - 0.2% - 2.2% Source: USDA-OCE WASDE, September 2012

78
Any Questions?

Similar presentations


. Source: USDA/ERS 10 monthly records in 2014.>")
