Download presentation
Presentation is loading. Please wait.

1
Ag Outlook Federal Reserve of Kansas City Risk Council Meeting
Kansas City, Missouri Oct. 30, 2015 Chad Hart Associate Professor/Crop Markets Specialist 1 1

2
Key factors for 2015 and beyond
Crops/Feedstuffs – BULLISH for livestock sector Hog supply – or lack of supply issues in U.S. hog herd Beef herd rebuilding is under way and accelerating – limiting current supplies BUT currently the fed cattle market purge is on HPAI in U.S. poultry – HUGE hit on layers/eggs, only meat impact was turkey, chicken was okay---but represents the largest risk U.S. consumer demand has been GREAT – will it hold? The U.S. dollar

3
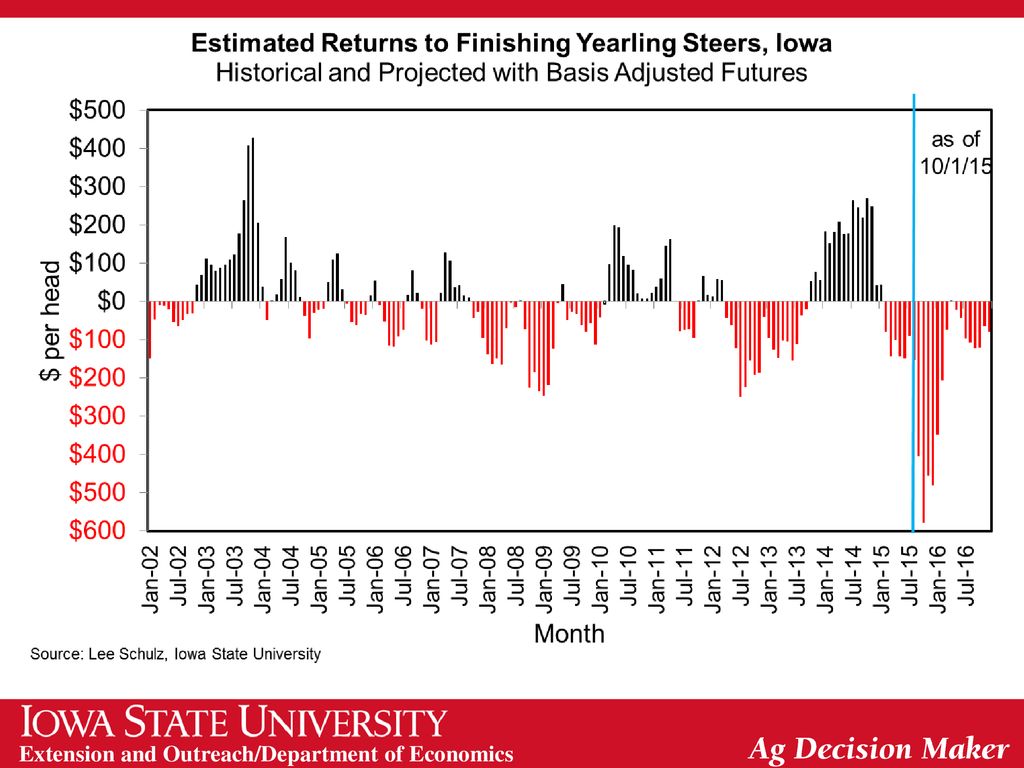
Cattle Crush Margin The Crush Margin is the return after the feeder steer and corn costs. Live weight: pounds Feeder weight: 750 pounds Corn: 50 bushels per head Source: ISU Extension

4
Data Source: USDA & LMIC, Compiled by LMIC
Livestock Marketing Information Center

5
Data Source: USDA/NASS, tabulations by Lee Schulz

7
Quarterly Cattle & Beef Forecasts (LMIC: 10/1/2015)
Change Average Commercial from Dressed Beef Year Slaughter Year Ago Weight Production Quarter (1,000 hd) (%) (lbs) (mil lbs) 2015 I 6,967 -5.5 813 2.2 5,664 -3.5 II 7,227 -7.8 810 2.7 5,855 -5.3 III 7,297 -4.4 831 2.6 6,064 -1.9 IV 7,358 0.4 833 1.3 6,128 1.8 28,849 822 23,711 -2.2 2016 7,144 2.5 1.2 5,875 3.7 7,411 6,026 2.9 7,604 4.2 835 0.5 6,353 4.8 7,532 2.4 837 6,304 29,691 827 0.6 24,558 3.6 2017 7,395 3.5 828 6,120 7,690 3.8 816 6,276 4.1 7,804 839 6,549 3.1 7,871 4.5 842 6,628 5.1 30,760 25,573
 (%) (lbs) (mil lbs) I. 6, , II. 7, , III. 7, , IV. 7, , , , , , ,411. 6, , , , , , , , ,120. 7, , , , , , , ,573.")
8
Quarterly Cattle & Beef Forecasts (LMIC: 10/1/2015)
Live Sltr. Change Steer Price from Feeder Steer Price Year 5-Mkt Avg Year Ago Southern Plains Quarter ($/cwt) (%) 7-800# 5-600# 2015 I 162.43 11.0 215.87 276.14 II 158.11 7.0 225.29 279.32 III -9.5 IV -10.0 -0.7 2016 -7.3 -4.5 1.4 -1.3 -3.3 2017 -2.7 -2.6 -2.1 -2.0 -2.4
 (%) 7-800# 5-600# I II III IV")
9
Strength of the U.S. Dollar
Source: Federal Reserve

10
Crude Oil Prices Sources: EIA and CME

11
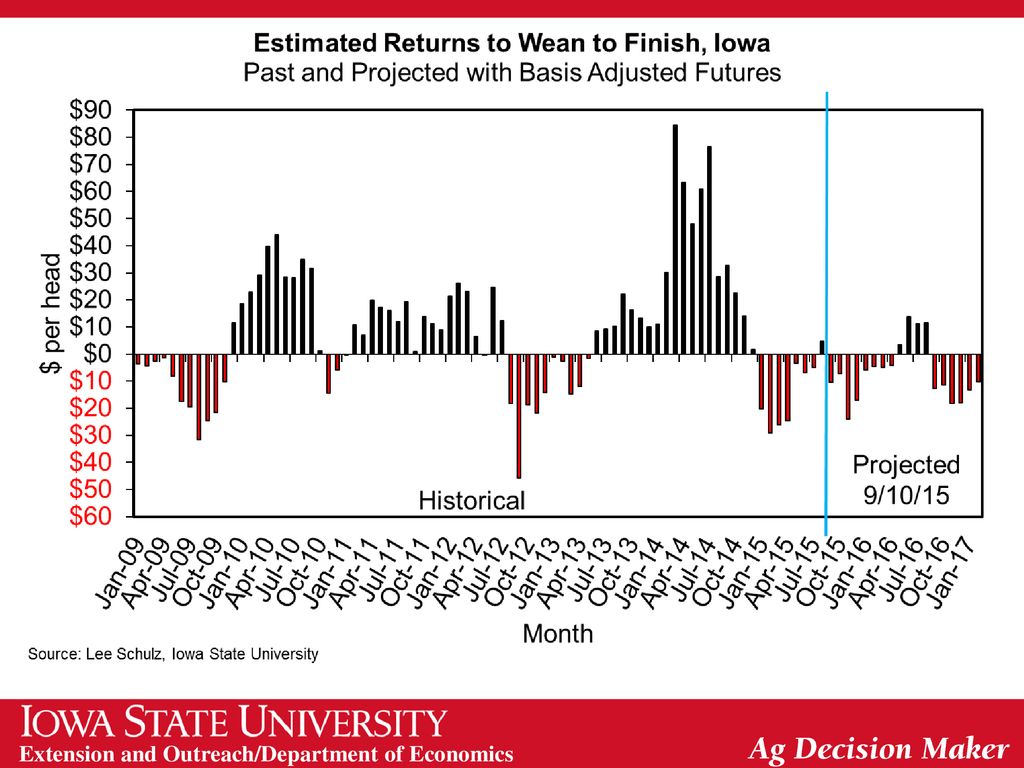
Hog Crush Margin The Crush Margin is the return after the pig, corn and soybean meal costs. Carcass weight: 200 pounds Pig price: 50% of 5 mth out lean hog futures Corn: 10 bushels per pig Soybean meal: 150 pounds per pig Source: ISU Extension

14
LMIC Pork Production and Price Quarterly Forecasts (9/21/15)
Sources: USDA/NASS; USDA/AMS Livestock Market News; Projections and Forecasts by LMIC Year Comm’l % Chg. Avg Carcass Comm’l Pork Quarter Slaughter Year Ago Weight Production 2014 (1,000 hd) (lbs) (mil lbs) I 27,131 -2.6 213 2.7 5,784 0.2 II 25,575 -4.4 215 4.4 5,504 -0.2 III 25,558 -7.6 212 4.3 5,424 -3.5 IV 28,612 -4.0 1.7 6,131 -2.3 106,876 -4.6 214 3.3 22,843 -1.5 2015 28,723 5.9 0.8 6,161 6.5 27,848 8.9 -1.1 5,925 7.6 28,301 10.7 210 -1.2 5,937 9.5 30,400 6.3 6,510 6.2 115,272 7.9 -0.4 24,533 7.4 2016 29,117 1.4 -0.3 6,239 1.3 27,491 -1.3 5,867 -1.0 28,065 -0.8 5,898 -0.7 30,248 -0.5 0.3 6,495 114,921 0.1 24,499 -0.1
 (lbs) (mil lbs) I. 27, , II. 25, , III. 25, , IV. 28, , , , , , , , , , , , , , , , , , , , , , , ,")
15
LMIC Pork Production and Price Quarterly Forecasts (9/21/15)
Sources: USDA/NASS; USDA/AMS Livestock Market News; Projections and Forecasts by LMIC Year Nat’l Wtd % Chg. Quarter Avg Base Price Year Ago 2014 ($/carcass cwt) ($/live cwt) I 91.44 12.8 68.13 II 111.84 25.2 83.32 III 110.03 15.5 81.97 IV 90.13 8.6 67.15 100.86 16.1 75.14 2015 68.55 -25.0 51.07 73.52 -34.3 54.77 74-75 -32.3 55-56 64-66 -27.9 48-49 70-71 -30.2 52-53 2016 64-67 -4.4 48-50 73-77 2.0 54-57 74-79 2.7 55-59 65-71 4.6 48-53 70-73 1.4 52-54
 ($/live cwt) I II III IV")
16
Choice All Fresh Pork Broiler Turkey Aug-15/Jul-15 -0.3% -0.9% 1.7% -0.2% -1.4% Aug-15/Aug-14 5.1% -8.7% -0.5% -3.6%

17
U.S. Corn Supply and Use 2012 2013 2014 2015 2015 Δ Area Planted
(mil. acres) 97.3 95.4 90.6 88.4 -0.5 Yield (bu./acre) 123.1 158.1 171.0 168.0 0.5 Production (mil. bu.) 10,755 13,829 14,216 13,555 -30 Beg. Stocks 989 821 1,232 1,731 -1 Imports 160 36 32 30 Total Supply 11,904 14,686 15,479 15,316 -31 Feed & Residual 4,315 5,034 5,317 5,275 Ethanol 4,641 5,134 5,207 5,250 Food, Seed, & Other 1,397 1,369 1,359 1,380 Exports 730 1,917 1,864 1,850 Total Use 11,083 13,454 13,748 13,755 Ending Stocks 1,561 Season-Average Price ($/bu.) 6.89 4.46 3.70 3.80 0.05 Source: USDA-WAOB 17 17
 Yield. (bu./acre) Production. (mil. bu.) 10, , , , Beg. Stocks ,232. 1, Imports Total Supply. 11, , , , Feed & Residual. 4,315. 5,034. 5,317. 5,275. Ethanol. 4,641. 5,134. 5,207. 5,250. Food, Seed, & Other. 1,397. 1,369. 1,359. 1,380. Exports ,917. 1,864. 1,850. Total Use. 11, , , ,755. Ending Stocks. 1,561. Season-Average Price. ($/bu.) Source: USDA-WAOB")
18
U.S. Soybean Supply and Use
2012 2013 2014 2015 2015 Δ Area Planted (mil. acres) 77.2 76.8 83.3 83.2 -1.1 Yield (bu./acre) 40.0 44.0 47.5 47.2 0.1 Production (mil. bu.) 3,042 3,358 3,927 3,888 -47 Beg. Stocks 169 141 92 191 -19 Imports 41 72 33 30 Total Supply 3,252 3,570 4,052 4,109 -66 Crush 1,689 1,734 1,875 1,880 10 Seed & Residual 105 97 143 130 Exports 1,317 1,647 1,843 1,675 -50 Total Use 3,111 3,478 3,861 3,685 -40 Ending Stocks 425 -25 Season-Average Price ($/bu.) 14.40 13.00 10.10 9.15 0.00 Source: USDA-WAOB 18 18
 Yield. (bu./acre) Production. (mil. bu.) 3,042. 3,358. 3,927. 3, Beg. Stocks Imports Total Supply. 3,252. 3,570. 4,052. 4, Crush. 1,689. 1,734. 1,875. 1, Seed & Residual Exports. 1,317. 1,647. 1,843. 1, Total Use. 3,111. 3,478. 3,861. 3, Ending Stocks Season-Average Price. ($/bu.) Source: USDA-WAOB")
19
Corn Yield Estimate Top: 2015 Estimated Yields
Bottom: Change from last month Units: Bushels/acre Source: USDA-NASS

20
World Corn Production Source: USDA-WAOB 20 20

21
World Soybean Production
Source: USDA-WAOB 21 21

22
U.S. Meat Production & Prices
Source: USDA-WAOB 22 22

23
Corn Export Sales Source: USDA-FAS

24
Soybean Export Sales Source: USDA-FAS

25
Corn Grind for Ethanol

26
2015/16 Crop Margins

27
2016/17 Crop Margins

28
Iowa Corn Prices vs. Costs

29
Iowa Corn Costs Overall 75% increase 88% 26% 88% 46%
Source: AgDM A1-21

30
Iowa Corn Costs Source: AgDM A1-21

31
Iowa Average Farmland Values
all grades 1950−2014

32
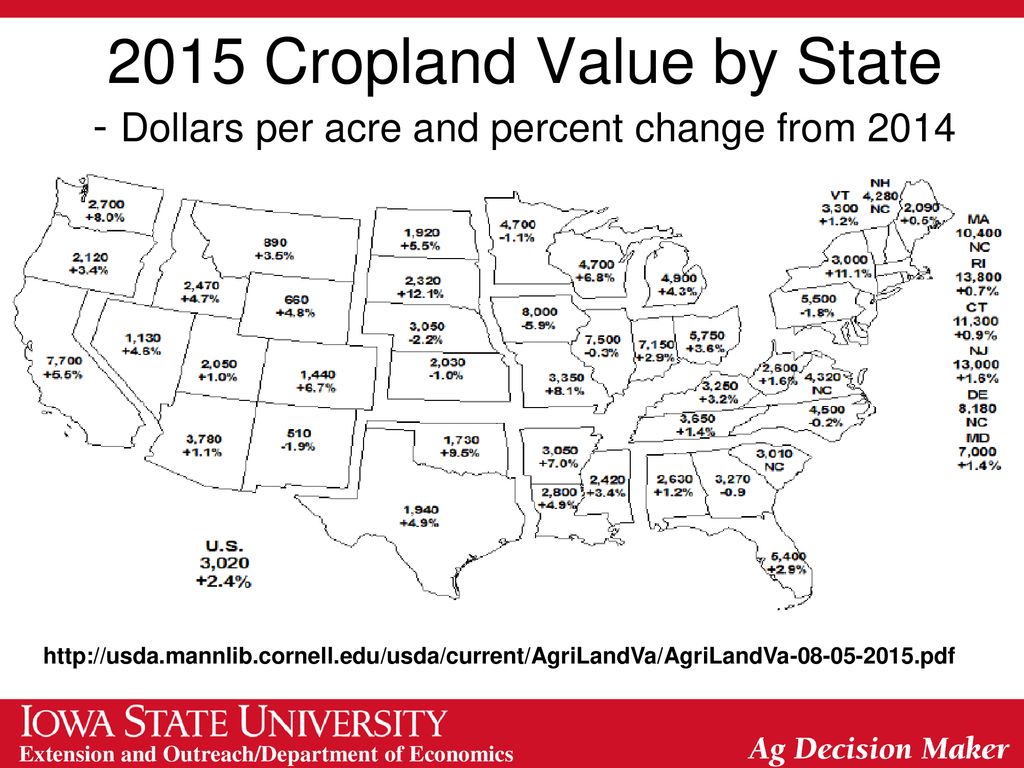
2015 Cropland Value by State - Dollars per acre and percent change from 2014
33
Margin Maneuvers Negotiate lower land rental rates
Explore variety choice (seed cost vs. seed benefits) Soil test and apply required fertilizer Examine and control other input costs (pesticides, herbicides, etc.) Be more aggressive marketing on rallies May look to limit losses, as opposed to capture profits Singles & doubles vs. Home run strategy
 Soil test and apply required fertilizer. Examine and control other input costs (pesticides, herbicides, etc.) Be more aggressive marketing on rallies. May look to limit losses, as opposed to capture profits. Singles & doubles vs. Home run strategy.")
34
Margin Maneuvers Fully utilize government programs
ARC-CO, PLC, crop insurance Break price into futures and basis components to capture improvements in either Put the pencil to paper and calculate storage benefits/costs Will a traditional seasonal price swing cover storage costs? What are futures prices telling you about storage opportunities now? Remember, Rome wasn’t built in a day It took us awhile to get into this situation and it will take awhile to get out.

35
Crop Insurance No Payment Neither Pay RPE Pays YP Pays Both Pay
RP Pays

36
PLC pays, ARC does not Neither pay Both pay ARC pays, PLC does not

37
Thank you for your time. Any questions. My web site: http://www2. econ
Thank you for your time! Any questions? My web site: Iowa Farm Outlook: Ag Decision Maker:

Similar presentations