Download presentation
Presentation is loading. Please wait.

1
Agricultural Market Outlook July 17, 2014
University of Missouri Extension

2
Corn Outlook David Reinbott July 17, 2014

3
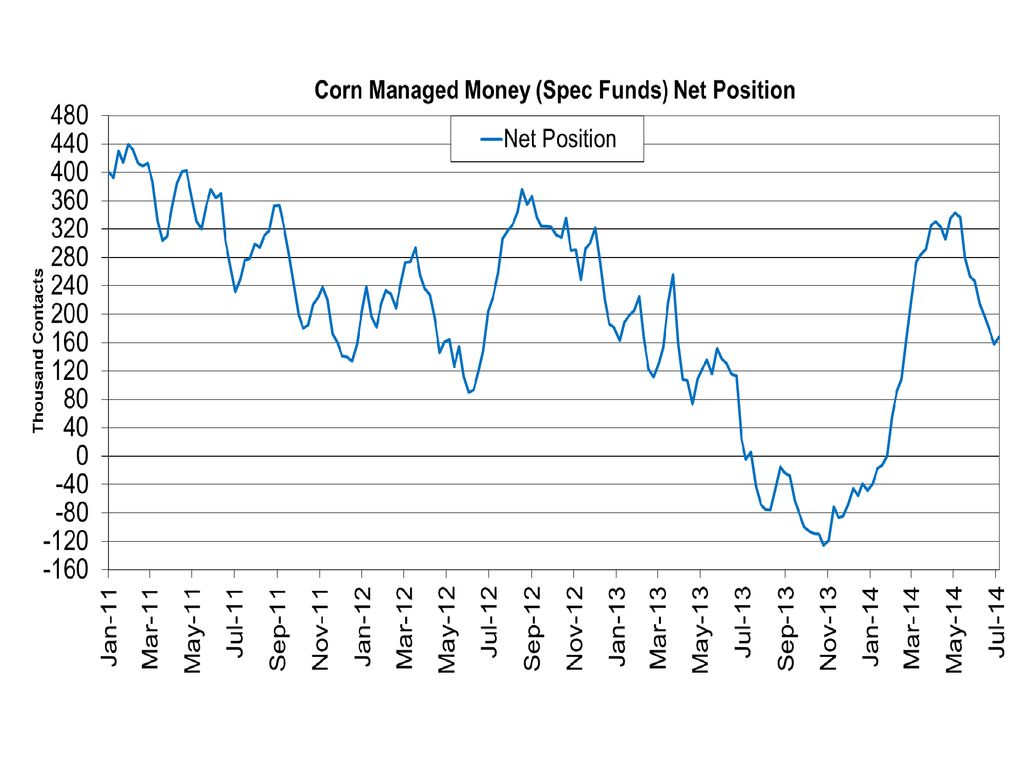
Issues Impacting Prices
Corn condition – 76% Good to Excellent Record corn yield – 170? ? Weather next 2 months Harvested acres down 1 – 2 million Rebound in demand

6
Supply & Demand: Corn 2011-12 2012-13 2013-14 Supply: (bil. bu.)
June To July Change Supply & Demand: Corn Acres Plant/Har (mil.) 91.9/84 97.2/87.4 95.4/87.7 Avg. yield/acre (bu.) 147.2 123.4 158.8 Supply: (bil. bu.) Beg. Stocks 1.128 0.989 0.821 Production 12.360 10.780 13.925 Total Supply 13.517 11.932 14.781 Use: Feed 4.557 4.326 5.175 Ethanol 5.000 4.648 5.075 Exports 1.543 0.731 1.900 Total Use 12.528 11.111 13.535 Ending Stocks 1.246 Avg. price/bu. $6.22 $6.89 $4.45 -125 +25 -100 +100 -0.10
 91.9/ / /87.7. Avg. yield/acre (bu.) Supply: (bil. bu.) Beg. Stocks Production Total Supply Use: Feed Ethanol Exports Total Use Ending Stocks Avg. price/bu. $6.22. $6.89. $")
7
2014 U.S. Average Corn Yield: Big or Really Big?
Scott Irwin and Darrel Good Trend Line Yield = = 173.5

8
Supply & Demand: Corn 2014-2015 Supply: (bil. bu.) Beg. Stocks 1.246
Acres planted (mil.) 91.6/83.8 91.6/83.3 Avg. yield/acre (bu.) 165.3 170.0 173.5 Supply: (bil. bu.) Beg. Stocks 1.246 Production 13.860 14.246 14.453 Total Supply 15.136 15.522 15.729 Use: Feed 5.200 5.335 Other 6.435 6.500 Exports 1.700 1.845 Total Use 13.345 13.535 13.680 Ending Stocks 1.801 1.987 2.049 Avg. price/bu. $4.00 $3.80 $3.75
 91.6/ /83.3. Avg. yield/acre (bu.) Supply: (bil. bu.) Beg. Stocks Production Total Supply Use: Feed Other Exports Total Use Ending Stocks Avg. price/bu. $4.00. $3.80. $3.75.")
13
Sept 2014 Corn Futures

14
Monthly Corn Futures

15
Cattle Outlook (title)
Ron Plain July 17, 2014

16
Source: USDA/ERS 16

17
2014 per capita meat consumption the lowest since 1991?
Source: USDA/ERS 17

18
2013: 33.93 million head, down 1.0% Smallest calf crop since 1949
U.S. Calf Crop, 2013: million head, down 1.0% Smallest calf crop since 1949 Source: USDA/NASS

19
U.S. Beef Imports & Exports as % of U.S. Production, monthly

20
Year-to-date cattle slaughter is down 5.7%
Livestock Marketing Information Center Data Source: USDA-AMS & USDA-NASS

21
Livestock Marketing Information Center
Data Source: USDA-AMS & USDA-NASS

22
Year-to-date cow slaughter is down 12.7%
Livestock Marketing Information Center Data Source: USDA-AMS & USDA-NASS

23
Year-to-date heifer slaughter is down 6.7%
Livestock Marketing Information Center Data Source: USDA-AMS & USDA-NASS

24
Female Share of Slaughter U.S. Federally Inspected Cattle Slaughter
Year-to-date female slaughter is down 9.2% Source: USDA/AMS

25
Cattle On Feed June 1 cattle on feed: down 1.6%

26
Livestock Marketing Information Center
Data Source: USDA-AMS

27
Cost of Gain is roughly $84/cwt
Source: LMIC 27

28
U.S. Commercial Beef Production Million Pounds
----- % Change ----- - 4.9% % . - 5.0% % - 4.2% % - 4.3% % - 4.6% % 2013 2014 2015 Qtr 1 6,172 5,868 5,855* Qtr 2 6,516 6,190 6,240* Qtr 3 6,609 6,330* 6,230* Qtr 4 6,423 6,150* 6,050* Year 25,720 24,538* 24,375* *forecast

29
5 Area Slaughter Steer Prices Choice Steers Per Live Hundredweight
2012 2013 2014 2015 Qtr 1 $125.29 $125.52 $146.34 $ * Qtr 2 $121.91 $124.95 $147.82 $ * Qtr 3 $119.69 $122.30 $ * $ * Qtr 4 $125.54 $130.77 $ * $ * Year $122.86 $125.89 $ * $ * *forecast

30
Nebraska Slaughter Steer Price, Monthly Average 2000-2014
Thru Dec 2015 all cattle futures contracts are above $142 per cwt

31
OKC 750-800# Feeder Steer Price Monthly Average 2000-2014
Thru May 2015 all feeder cattle futures contracts are above $200 per cwt

32
Livestock Marketing Information Center
Data Source: USDA-AMS & USDA-NASS, Compiled & Analysis by LMIC

33
Soybean Outlook David Reinbott July 17, 2014

34
Issues Impacting Prices
U.S. acres – up 3.3/3.6 million acres Weather – August South American soybean crop China

36
Supply & Demand: Soybean
Acres Planted (mil.) 75.0 77.2 76.5 Avg. yield/acre (bu.) 41.9 39.8 43.3 Supply: (bil. bu.) Beg. Stocks 0.215 0.169 0.141 Production 3.094 3.034 3.289 Total Supply 3.325 3.239 3.514 Use: Crush 1.703 1.689 1.725 Other 0.088 0.090 0.030 Exports 1.365 1.320 1.620 Total Use 3.155 3.099 3.374 Ending Stocks 0.140 Avg. price/bu. $12.50 $14.40 $13.00 June to July change Imports -5 +25 -65 +20 -21 +15 -0.10
 Avg. yield/acre (bu.) Supply: (bil. bu.) Beg. Stocks Production Total Supply Use: Crush Other Exports Total Use Ending Stocks Avg. price/bu. $ $ $ June to July change. Imports")
37
Supply & Demand: Soybeans 2014-2015
Acres planted (mil.) 84.8/84.1 Avg. yield/acre (bu.) 42.2 45.2 46.2 Supply: (bil. bu.) Beg. Stocks 0.140 Production 3.549 3.800 3.886 Total Supply 3.704 3.955 4.041 Use: Crush 1.755 1.780 Other 0.111 Exports 1.675 1.700 Total Use 3.541 3.591 Ending Stocks 0.163 0.415 0.450 Avg. price/bu. $13.00 $10.50 $9.50
 84.8/84.1. Avg. yield/acre (bu.) Supply: (bil. bu.) Beg. Stocks Production Total Supply Use: Crush Other Exports Total Use Ending Stocks Avg. price/bu. $ $ $9.50.")
43
2014 November Soybeans $11.20

44
Weekly Soybean Futures
$12.50 $11.00 $9.00

45
Hog Outlook (title) Hog Outlook Ron Plain July 17, 2014
 Hog Outlook Ron Plain July 17, 2014")
46
Cost of Slaughter Hog Production, 2000-2014
Source: Iowa State University 46

47
U.S. Retail Pork Prices, Source: USDA/ERS

48
Source: USDA/ERS

49
U.S. Pork Imports & Exports as % of U.S. Pork Production, 2006-2014
Source: USDA/ERS

50
June 2014 Hog Inventory Source: USDA NASS 50

51
PED Virus Identified in Europe in 1971 First cases in Asia in 1982
First cases in U.S. in April 2013 First identified in May Found on 7,603* hog farms by 6/29/14 Near 100% death loss in young pigs Not a zoonotic disease (no risk to people) Not a food safety concern *unknown amount of double counting 51
 Not a food safety concern. *unknown amount of double counting. 51.")
52
PEDV & PDCoV Cases by Week NAHLN Reports
Source: AASV & NAHLN

53
U.S. Pigs Per Litter by Month
January 2014 PPL lowest since January 2009 53

54
U.S. Pigs Per Litter by Month
PPL during Dec-Feb was down 5.5%. Mar-May was down 5.1%. Previous biggest decline was 1.68% in Jun-Aug 1988 54

55
Sows Farrowed by Quarter - U.S.
Source: USDA/NASS

56
record

57
Data Source: USDA-AMS, Compiled & Analysis by LMIC
Livestock Marketing Information Center

58
Commercial Pork Production Forecast Million Pounds
2013 2014 2015 Qtr 1 5,775 5,785 5,640* Qtr 2 5,516 5,505 5,440* Qtr 3 5,622 5,490* 5,760* Qtr 4 6,274 5,980* 6,400* Year 23,187 22,760* 23,240* Change +0.2% % - 0.2% % - 2.3% % - 4.7% % - 1.8% % *forecast

59
Iowa-Minn Hog Price, Quarterly Negotiated Base Price Per Carcass Hundredweight
2012 2013 2014 2015 Qtr 1 $84.78 $80.15 $94.97 $90-100* Qtr 2 $85.45 $89.62 $115.41 $89-99* Qtr 3 $83.15 $95.36 $ * $83-93* Qtr 4 $79.93 $82.36 $ * $73-83* Year $83.36 $86.87 $ * *forecast price 59

60
Net Slaughter Hog Price Monthly Average 2002-2014

61
Iowa Farrow to Finish Profits, 2006-2015
Forecast Source: Ron Plain, University of Missouri 61

62
Wheat Outlook David Reinbott July 17, 2014

63
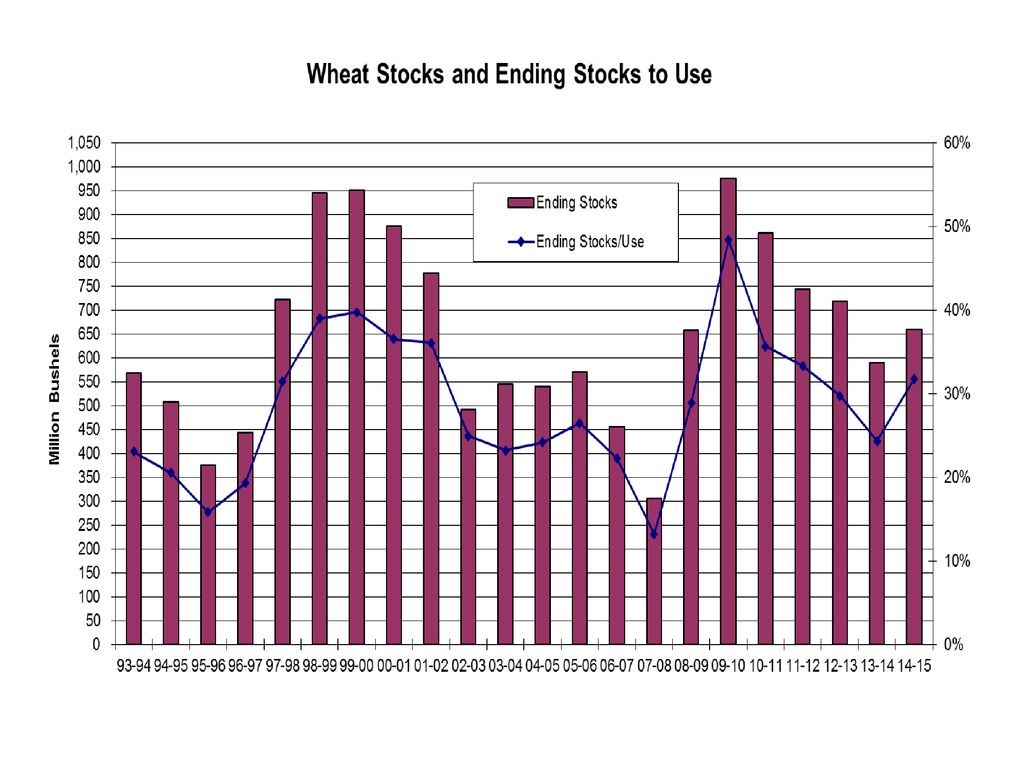
Issues Impacting Prices
Poor quality Soft Red Winter Yields decline World production and demand

65
Supply & Demand: Wheat 2011-12 2012-13 2013-14 Supply: (bil. bu.)
Acres planted (mil.) 54.4 55.7 56.2 Avg. yield/acre (bu.) 43.7 46.3 47.2 Supply: (bil. bu.) Beg. Stocks 0.862 0.743 0.718 Production 1.999 2.266 2.130 Total Supply 2.974 3.131 3.016 Use: Feed 0.162 0.388 0.217 Food & Seed 1.017 1.018 1.027 Exports 1.051 1.007 1.182 Total Use 2.231 2.414 2.426 Ending Stocks 0.590 Avg. price/bu. $7.24 $7.77 $6.87 June to July change +0 -3 +3 +2 +2 -3 -0.00
 Avg. yield/acre (bu.) Supply: (bil. bu.) Beg. Stocks Production Total Supply Use: Feed Food & Seed Exports Total Use Ending Stocks Avg. price/bu. $7.24. $7.77. $6.87. June. to July change")
66
Supply & Demand: Wheat 2014-15
Acres planted (mil.) 56.5/46.2 Avg. yield/acre (bu.) 42.1 43.1 44.1 Supply: (bil. bu.) Beg. Stocks 0.590 Production 1.945 1.992 2.037 Total Supply 2.695 2.741 2.787 Use: Feed 0.145 Food & Seed 1.036 Exports 0.900 Total Use 2.081 Ending Stocks 0.614 0.660 0.706 Avg. price/bu. $6.80 $6.60 $6.50
 56.5/46.2. Avg. yield/acre (bu.) Supply: (bil. bu.) Beg. Stocks Production Total Supply Use: Feed Food & Seed Exports Total Use Ending Stocks Avg. price/bu. $6.80. $6.60. $6.50.")
69
September 2014 Wheat

70
Weekly Wheat $ $5.60 $4.25

71
Dairy Outlook Joe Horner July 17, 2014

72
Dairy Outlook in a Nutshell
Supply Neutral US cow numbers – rising slowly US milk per cow – rising slowly US milk production – rising at 1.5% long term average US dairy product stocks slowly rebuilding Demand Bearish Domestic – Sticker shock weakening demand Exports – NZ/AU coming on strong, China imports slowing Outlook Profitable Margins strong as feed costs drop faster than milk prices Production constrained by cull prices & cow numbers

77
Stocks – Neutral Neutral Bullish Neutral Neutral

79
Dairy Price Outlook 3nd Quarter 2014 4th Quarter 2015 $21.95 – $22.45
USDA – All Milk Price June 18, 2014 $21.95 – $22.45 $20.85 – $21.65 $19.75 – $20.75 CME Group Futures Class III July 10, 2014 20.62 19.40 18.08 CME Group Futures Class IV 22.28 19.80 17.56 MO Farm Forecast $23.50 $21.50 $19.50

80
Questions ?

Similar presentations


. Source: USDA/ERS 10 monthly records in 2014.>")


