Download presentation
Presentation is loading. Please wait.

1
Crop and Livestock Market Outlook
4th Annual FCS Elite Crop Meeting Sioux City, Iowa Dec. 9, 2014 Chad Hart Associate Professor/Crop Markets Specialist 1 1

2
U.S. Corn Supply and Use 2010 2011 2012 2013 2014 Area Planted
(mil. acres) 88.2 91.9 97.3 95.4 90.9 Yield (bu./acre) 152.8 147.2 123.1 158.8 173.4 Production (mil. bu.) 12,447 12,360 10,755 13,925 14,407 Beg. Stocks 1,708 1,128 989 821 1,236 Imports 28 29 160 36 25 Total Supply 14,182 13,517 11,904 14,782 15,668 Feed & Residual 4,795 4,557 4,315 5,132 5,375 Ethanol 5,019 5,000 4,641 5,134 5,125 Food, Seed, & Other 1,407 1,428 1,397 1,363 1,385 Exports 1,834 1,543 730 1,917 1,750 Total Use 13,055 12,528 11,083 13,546 13,660 Ending Stocks 2,008 Season-Average Price ($/bu.) 5.18 6.22 6.89 4.46 3.50 Source: USDA-WAOB 2 2
 Yield. (bu./acre) Production. (mil. bu.) 12, , , , ,407. Beg. Stocks. 1,708. 1, ,236. Imports Total Supply. 14, , , , ,668. Feed & Residual. 4,795. 4,557. 4,315. 5,132. 5,375. Ethanol. 5,019. 5,000. 4,641. 5,134. 5,125. Food, Seed, & Other. 1,407. 1,428. 1,397. 1,363. 1,385. Exports. 1,834. 1, ,917. 1,750. Total Use. 13, , , , ,660. Ending Stocks. 2,008. Season-Average Price. ($/bu.) Source: USDA-WAOB")
3
U.S. Soybean Supply and Use
2010 2011 2012 2013 2014 Area Planted (mil. acres) 77.4 75.0 77.2 76.8 84.2 Yield (bu./acre) 43.5 41.9 40.0 44.0 47.5 Production (mil. bu.) 3,329 3,094 3,042 3,358 3,958 Beg. Stocks 151 215 169 141 92 Imports 14 16 41 72 15 Total Supply 3,495 3,325 3,252 3,570 4,065 Crush 1,648 1,703 1,689 1,734 1,780 Seed & Residual 130 88 105 98 115 Exports 1,501 1,365 1,317 1,647 1,720 Total Use 3,280 3,155 3,111 3,478 3,615 Ending Stocks 450 Season-Average Price ($/bu.) 11.30 12.50 14.40 13.00 10.00 Source: USDA-WAOB 3 3
 Yield. (bu./acre) Production. (mil. bu.) 3,329. 3,094. 3,042. 3,358. 3,958. Beg. Stocks Imports Total Supply. 3,495. 3,325. 3,252. 3,570. 4,065. Crush. 1,648. 1,703. 1,689. 1,734. 1,780. Seed & Residual Exports. 1,501. 1,365. 1,317. 1,647. 1,720. Total Use. 3,280. 3,155. 3,111. 3,478. 3,615. Ending Stocks Season-Average Price. ($/bu.) Source: USDA-WAOB")
4
Projected Corn Yields Top: 2014 Yield Bottom: Change from last month
Units: Bu/acre Source: USDA-NASS

5
Projected Soybean Yields
Top: 2014 Yield Bottom: Change from last month Units: Bu/acre Source: USDA-NASS

6
World Corn Production Source: USDA-WAOB 6 6

7
World Soybean Production
Source: USDA-WAOB 7 7

8
Hog Crush Margin The Crush Margin is the return after the pig, corn and soybean meal costs. Carcass weight: 200 pounds Pig price: 50% of 5 mth out lean hog futures Corn: 10 bushels per pig Soybean meal: 150 pounds per pig Source: ISU Extension

9
Cattle Crush Margin The Crush Margin is the return after the feeder steer and corn costs. Live weight: pounds Feeder weight: 750 pounds Corn: 50 bushels per head Source: ISU Extension

10
U.S. Meat Production & Prices
Source: USDA-WAOB 10 10

11
Corn Export Shifts Source: USDA-FAS

12
Corn Export Sales Source: USDA-FAS

13
Soybean Export Sales Source: USDA-FAS

14
Soy Export Shifts Source: USDA-FAS

15
Corn Grind for Ethanol

16
Current Corn Futures 4.04 3.73 Source: CME Group, 12/5/2014

17
Current Soybean Futures
10.14 9.82 Source: CME Group, 12/5/2014

18
Corn Prices vs. Costs Per Bushel Cost calculated as Per Acre Cost from ISU Extension divided by Actual Yield per Acre Sources: USDA-NASS for Prices, Duffy for Costs

19
Soybean Prices vs. Costs
Per Bushel Cost calculated as Per Acre Cost from ISU Extension divided by Actual Yield per Acre Sources: USDA-NASS for Prices, Duffy for Costs

20
2014/15 Crop Margins

21
2015/16 Crop Margins

22
Thoughts for 2015 and Beyond
Supply/demand concerns Record corn and soybean crops, but also record demand Markets are in a holding pattern, waiting for news Watching South American crop progress Projected negative margins for 2014 and 2015 crops 2013/14 USDA 2014/15 Futures (12/5/14) 2015/16 Corn $4.46 $3.50 $3.73 $4.04 Soybeans $13.00 $10.00 $10.14 $9.82
 2015/16. Corn. $4.46. $3.50. $3.73. $4.04. Soybeans. $ $ $ $9.82.")
23
Quarterly Cattle & Beef Forecasts (LMIC:12/4/2014)
Change Average Commercial from Dressed Beef Year Slaughter Year Ago Weight Production Quarter (1,000 hd) (%) (lbs) (mil lbs) 2013 I 7,781 -3.1 794 1.4 6,175 -1.7 II 8,325 0.2 782 0.4 6,513 0.6 III 8,321 -0.1 0.5 6,609 IV 8,035 -3.0 799 0.7 6,423 -2.3 32,462 -1.5 792 25,720 -0.7 2014 7,375 -5.2 796 0.3 5,868 -5.0 7,836 -5.9 789 0.9 6,183 -5.1 7,630 -8.3 810 1.9 6,178 -6.5 7,508 -6.6 820 2.6 6,157 -4.1 30,349 804 24,386 2015 7,135 -3.3 816 2.5 5,819 -0.8 7,602 803 1.7 6,103 -1.3 7,447 -2.4 818 1.0 6,088 7,407 823 6,097 -1.0 29,591 -2.5 815 24,107 -1.1 2016 7,145 0.1 821 5,865 0.8 7,325 -3.6 808 5,920 7,579 1.8 825 6,252 2.7 7,316 -1.2 828 6,059 -0.6 29,365 24,096 -0.05
 (%) (lbs) (mil lbs) I. 7, , II. 8, , III. 8, ,609. IV. 8, , , , , , , , , , , , , , , , , , , ,088. 7, , , , , , , ,920. 7, , , , , ,")
24
878 lbs/cow in 2013 (+1.27%/yr) 579 lbs/cow in 1980 Source: USDA/NASS
 579 lbs/cow in 1980 Source: USDA/NASS")
25
Pending Expansion? –How Fast?, How Large?, How Long?…
??? National Herd: -0.9% (vs. 2013) Smallest since 1962 Pending Expansion? –How Fast?, How Large?, How Long?… Data Source: USDA/NASS
 Smallest since Pending Expansion –How Fast , How Large , How Long … Data Source: USDA/NASS.")
26
2014-YTD Beef Cow Slaughter
-17.7% (vs. 2013) -26.5% (vs ) Beef Cow Culling Rates 2005 = 7.9% = 9.4% = 11.3% 2013 = 10.5% 2014-YTD = 7.9% Data Source: USDA-AMS & USDA-NASS Livestock Marketing Information Center
 -26.5% (vs ) Beef Cow Culling Rates = 7.9% = 9.4% = 11.3% 2013 = 10.5% 2014-YTD = 7.9% Data Source: USDA-AMS & USDA-NASS. Livestock Marketing Information Center.")
27
Data Source: USDA/AMS

28
Data Source: USDA-AMS, Compiled and Analysis by LMIC
Livestock Marketing Information Center

29
Data Source: USDA/AMS

30
Data Source: USDA-NASS
Livestock Marketing Information Center

31
Data Source: USDA-AMS & USDA-NASS
Livestock Marketing Information Center

32
2013 Profits = -$100.77 ~2014 Profits = +$197.26
Oct-03 Profit = $378 Total Cost: = $920 ROI = 41% Jul-14 Profit = $265 Total Cost: = $1,784 ROI = 14%

33
U.S. Beef Exports, Jan-Sep 2014
Sep-14/Aug-14 Sep-14/Sep-13 Year-to-Date Country Percent 1,000 lbs Mexico 23.6% 19.6% 52,523 18.6% Japan -7.4% 30.2% -16,031 -3.0% Canada -18.1% -30.1% -82,815 -22.8% South Korea -14.7% 0.6% 38,523 21.5% Hong Kong 7.2% -1.5% 57,458 24.8% China (Taiwan) -19.8% 5,309 7.3% Vietnam -25.4% 63.6% -3,983 -41.4% Russia -96 -78.7% Egypt -74.3% -97.2% -43,340 -93.6% Netherlands 20.4% 14.9% 335 1.2% Philippines 9.3% 14.2% 4,402 25.6% Other Countries -21.1% -9.2% 6,644 4.3% Total -4.3% 3.8% 18,928 1.0% WASDE U.S. Beef Exports (mil lbs) 2013: 2,590 2014: 2,599 (+0.3%) 2015: 2,525 (-2.8%) Source: USDA/ERS
 -19.8% 5, % Vietnam % 63.6% -3, % Russia % Egypt % -97.2% -43, % Netherlands. 20.4% 14.9% % Philippines. 9.3% 14.2% 4, % Other Countries % -9.2% 6, % Total. -4.3% 3.8% 18, % WASDE U.S. Beef Exports (mil lbs) 2013: 2, : 2,599 (+0.3%) 2015: 2,525 (-2.8%) Source: USDA/ERS.")
34
Quarterly Hog & Pork Forecasts (LMIC:12/4/2014)
Change Average Commercial from Carcass Pork Year Slaughter Year Ago Weight Production Quarter (1,000 hd) (%) (lbs) (mil lbs) 2013 I 27,864 -0.9 208 -0.5 5,775 -1.4 II 26,765 0.4 206 5,516 -0.1 III 27,657 -1.1 204 1.2 5,622 -0.2 IV 29,792 -2.1 211 2.6 6,274 0.5 112,077 -1.0 207 0.7 23,187 -0.3 2014 27,134 -2.6 213 2.7 5,785 0.2 25,574 -4.4 215 4.4 5,504 25,554 -7.6 212 4.2 5,423 -3.5 28,922 -2.9 214 1.4 6,189 107,184 3.2 22,902 -1.2 2015 26,951 -0.7 0.9 5,799 26,341 3.0 -0.4 5,649 26,325 0.0 5,588 29,894 3.4 6,426 3.8 109,511 2.2 23,462 2.4 2016 28,263 4.9 216 6,096 5.1 27,037 5,810 2.9 27,049 2.8 0.3 5,758 30,462 1.9 6,558 2.1 112,811 24,222
 (%) (lbs) (mil lbs) I. 27, , II. 26, , III. 27, , IV. 29, , , , , , , , , , , , , , , , , , , , , , , , , , ,037. 5, , , , , , ,222.")
37
USDA Quarterly Hogs and Pigs Report
September 26, 2014 2014 as % Pre-Report Actual - 2013 2014 of 2013 Range Estimate Inventories on Sep 1 * All hogs and pigs 66,906 65,361 97.7 96.6 1.1 Kept for breeding 5,816 5,920 101.8 101.4 0.4 Market 61,090 59,441 97.3 96.2 Under 50 pounds 19,824 19,517 98.5 97.8 0.7 pounds 17,958 17,658 98.3 96.4 1.9 pounds 12,584 12,147 96.5 94.9 1.6 180 pounds and over 10,725 10,118 94.3 93.6 Farrowing ** Mar – May sows farrowed 2,806 2,797 99.7 Jun – Aug sows farrowed 2,890 2,907 100.6 100.4 0.2 Sep – Nov intentions 2,780 104.0 103.2 0.8 Dec – Feb intentions 2,765 2,870 103.8 101.7 2.1 Pig Crop * Mar – May 28,921 27,361 94.6 Jun – Aug pig 29,862 29,539 98.9 97.6 1.3 Pigs Saved per Litter Mar - May 10.31 9.78 Jun - Aug 10.33 10.16 98.4 97.2 1.2 * 1,000 head ** 1,000 litters Data Source: USDA/NASS

38
50-119 <50 ** The approximate times when hog inventory reported in September comes to market 180+ Data Source: USDA-AMS & USDA-NASS Livestock Marketing Information Center

39
Data Source: USDA/AMS

40
Data Source: USDA-AMS, Compiled & Analysis by LMIC
Livestock Marketing Information Center

41
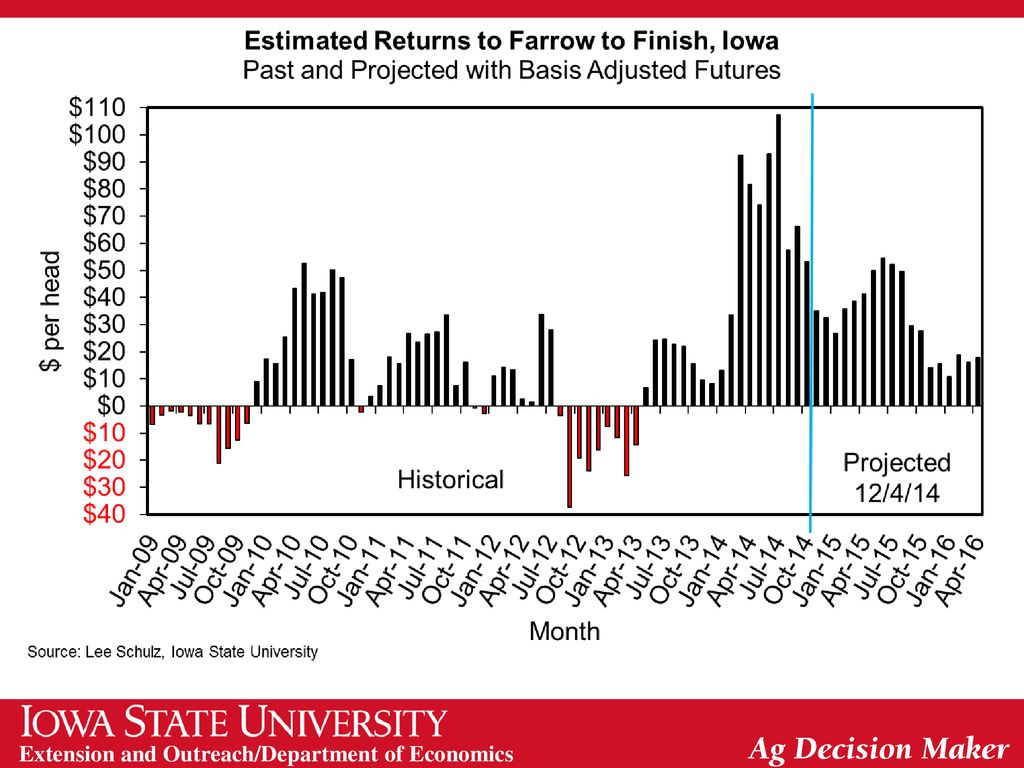
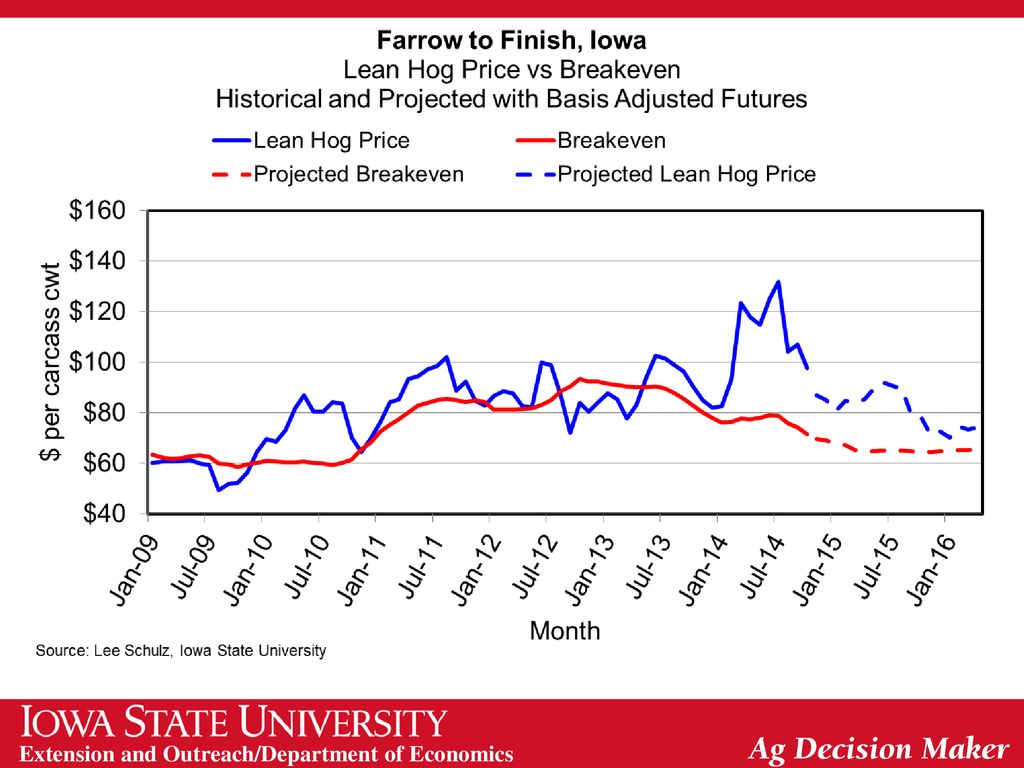
2013 Profits = +$4.77 ~2014 Profits = +$39.39 ~2015 Profits = +$13.45

42
U.S. Pork Exports, Jan-Sep 2014
Sep-14/Aug-14 Sep-14/Sep-13 Year-to-Date Country Percent 1,000 lbs Japan -4.3% -21.1% -42,448 -4.2% Mexico 2.7% 15.7% 149,153 17.2% Canada 13.5% 3.2% -25,664 -5.9% China (Mainland) 38.1% -83.4% -90,934 -24.1% South Korea 36.1% 178.2% 73,014 36.6% Russia 85,443 497.1% Hong Kong -25.1% -10.3% -24,011 -21.8% Australia -20.8% -28.3% 5,833 4.8% China (Taiwan) -36.3% -10,600 -32.8% Philippines 29.9% -14.7% -6,734 -7.6% Honduras -16.3% -19.9% -9,840 Colombia -21.6% 9.6% 38,511 60.3% Other Countries 6.1% -34.5% -75,373 -25.8% Total -2.4% -13.2% 66,350 1.8% WASDE U.S. Pork Exports (mil lbs) 2013: 4,992 2014: 5,066 (+1.5%) 2015: 5,250 (+3.6%) Source: USDA/ERS
 38.1% -83.4% -90, % South Korea. 36.1% 178.2% 73, % Russia. 85, % Hong Kong % -10.3% -24, % Australia % -28.3% 5, % China (Taiwan) -36.3% -10, % Philippines. 29.9% -14.7% -6, % Honduras % -19.9% -9,840. Colombia % 9.6% 38, % Other Countries. 6.1% -34.5% -75, % Total. -2.4% -13.2% 66, % WASDE U.S. Pork Exports (mil lbs) 2013: 4, : 5,066 (+1.5%) 2015: 5,250 (+3.6%) Source: USDA/ERS.")
43
Thank you for your time. Any questions. My web site: http://www. econ
Thank you for your time! Any questions? My web site: Iowa Farm Outlook: Ag Decision Maker:

Similar presentations