Download presentation
Presentation is loading. Please wait.

1
Associate Professor/Crop Markets Specialist
Ag Outlook Panama, Iowa Mar. 3, 2016 Chad Hart Associate Professor/Crop Markets Specialist 1 1

2
U.S. Corn Supply and Use 2012 2013 2014 2015 2016 Area Planted
(mil. acres) 97.3 95.4 90.6 88.0 90.0 Yield (bu./acre) 123.1 158.1 171.0 168.4 168.0 Production (mil. bu.) 10,755 13,829 14,216 13,601 13,825 Beg. Stocks 989 821 1,232 1,731 1,837 Imports 160 36 32 50 40 Total Supply 11,904 14,686 15,479 15,382 15,702 Feed & Residual 4,315 5,040 5,315 5,300 5,425 Ethanol 4,641 5,124 5,209 5,225 Food, Seed, & Other 1,397 1,369 1,359 1,370 1,375 Exports 730 1,920 1,864 1,650 1,700 Total Use 11,083 13,454 13,748 13,545 13,725 Ending Stocks 1,977 Season-Average Price ($/bu.) 6.89 4.46 3.70 3.60 3.45 Source: USDA-WAOB 2 2
 Yield. (bu./acre) Production. (mil. bu.) 10, , , , ,825. Beg. Stocks ,232. 1,731. 1,837. Imports Total Supply. 11, , , , ,702. Feed & Residual. 4,315. 5,040. 5,315. 5,300. 5,425. Ethanol. 4,641. 5,124. 5,209. 5,225. Food, Seed, & Other. 1,397. 1,369. 1,359. 1,370. 1,375. Exports ,920. 1,864. 1,650. 1,700. Total Use. 11, , , , ,725. Ending Stocks. 1,977. Season-Average Price. ($/bu.) Source: USDA-WAOB")
3
U.S. Soybean Supply and Use
2012 2013 2014 2015 2016 Area Planted (mil. acres) 77.2 76.8 83.3 82.7 82.5 Yield (bu./acre) 40.0 44.0 47.5 48.0 46.7 Production (mil. bu.) 3,042 3,358 3,927 3,930 3,810 Beg. Stocks 169 141 92 191 450 Imports 41 72 33 30 Total Supply 3,252 3,570 4,052 4,151 4,289 Crush 1,689 1,734 1,873 1,880 1,900 Seed & Residual 105 107 145 131 125 Exports 1,317 1,638 1,843 1,690 1,825 Total Use 3,111 3,478 3,861 3,701 3,850 Ending Stocks 440 Season-Average Price ($/bu.) 14.40 13.00 10.10 8.80 8.50 Source: USDA-WAOB 3 3
 Yield. (bu./acre) Production. (mil. bu.) 3,042. 3,358. 3,927. 3,930. 3,810. Beg. Stocks Imports Total Supply. 3,252. 3,570. 4,052. 4,151. 4,289. Crush. 1,689. 1,734. 1,873. 1,880. 1,900. Seed & Residual Exports. 1,317. 1,638. 1,843. 1,690. 1,825. Total Use. 3,111. 3,478. 3,861. 3,701. 3,850. Ending Stocks Season-Average Price. ($/bu.) Source: USDA-WAOB")
4
Corn Yield Estimate Top: 2015 Estimated Yields
Bottom: Change from last year Units: Bushels/acre Source: USDA-NASS

5
U.S. Meat Production & Prices
Source: USDA-WAOB 5 5

6
Corn Export Sales Source: USDA-FAS

7
Soybean Export Sales Source: USDA-FAS

8
Strength of the U.S. Dollar
Source: Federal Reserve

9
Crude Oil Prices Sources: EIA and CME

10
Corn Grind for Ethanol

11
Current Corn Futures 3.65 3.53 3.50 Source: CME Group, 2/29/2016

12
Current Soybean Futures
8.59 8.30 8.33 Source: CME Group, 2/29/2016

13
2016/17 Crop Margins

14
Iowa Corn Prices vs. Costs

15
Key livestock market highlights
Crop & feedstuffs situation – ADVANTAGEOUS for livestock sector Size of hog industry driven by recent profitability – Productivity to guide 2nd half 2016 supply prospects Still relatively tight cattle-beef supplies but expansion well underway – 2015 was a year of transition HPAI in poultry in – Rebuild/expansion underway Relatively stable domestic dairy herd expected through – Worldwide production up, prices lower U.S. consumer demand has been GOOD – International trade a bit of a drag but should improve

16
U.S. Meat Production & Prices
Source: USDA-WAOB 16 16

17
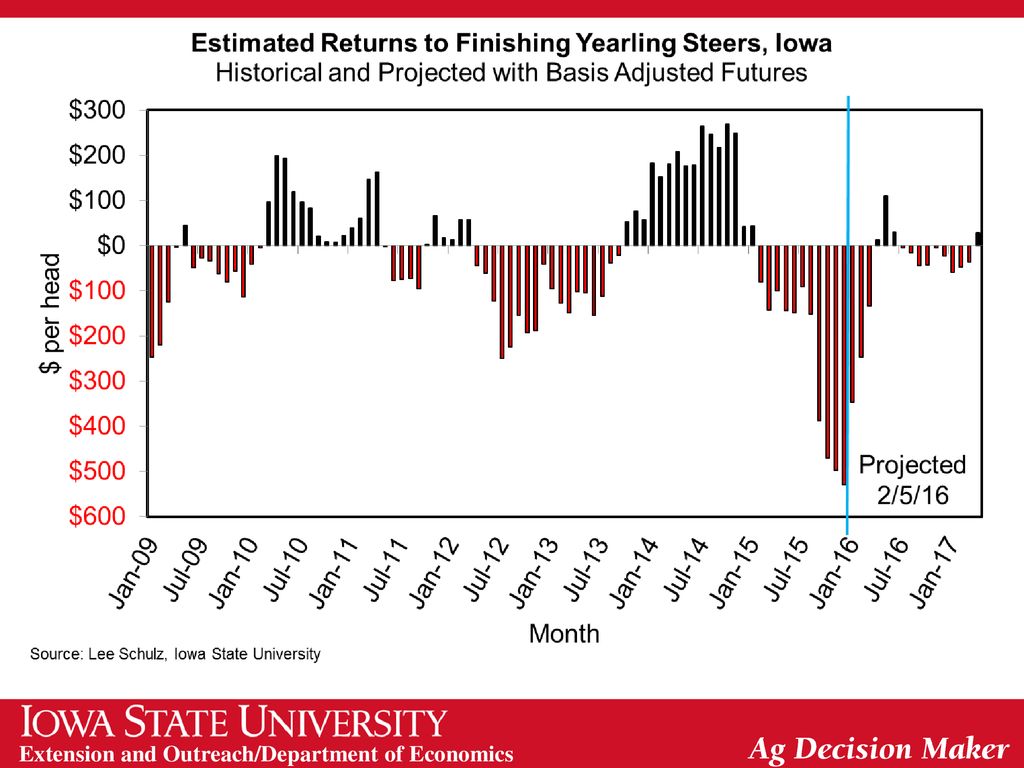
Cattle Crush Margin The Crush Margin is the return after the feeder steer and corn costs. Live weight: pounds Feeder weight: 750 pounds Corn: 50 bushels per head Source: ISU Extension

18
Data Source: USDA & LMIC, Compiled by LMIC
Livestock Marketing Information Center

19
Top 10, 2015 to 2016 Head % TX +160,000 +3.9% OK +73,000 MO +61,000
+3.3% NE +96,000 +5.5% SD +79,000 +4.9% KS +4.3% MT -10,000 -0.7% KY +24,000 +2.4% IA +40,000 +4.4% FL +9,000 +1.0% Total 593,000 +3.5% Data Source: USDA/NASS

20
Data Source: USDA/NASS

22
U.S. Beef Exports, Jan-Nov 2015
(Volume excluding by-products & variety meats) Nov-15/Oct-15 Nov-15/Nov-14 Year-to-Date Country Percent 1,000 lbs Mexico -11% 12% -69,053 -17% Japan 0% -29% -116,705 -19% Canada 8% -39,577 -12% South Korea 17% 15,516 6% Hong Kong 7% -90,431 -25% China (Taiwan) -3% 13% 3,734 4% Vietnam 143% 3,774 52% Netherlands -15% 1,873 5% Philippines 25% 110% 4,095 16% United Arab Emirates -31% 1,437 11% Dominican Republic -24% -7% 2,902 Chile 21% -2,694 Italy 47% -43% -1,462 -8% Other Countries 20% -3,948 Total -1% -290,540 WASDE U.S.: 2014: 2,573 mil lbs : 2,263 (-12%) : 2,475 (+9%) Source: USDA/ERS
 Nov-15/Oct-15. Nov-15/Nov-14. Year-to-Date. Country. Percent. 1,000 lbs. Mexico. -11% 12% -69, % Japan. 0% -29% -116, % Canada. 8% -39, % South Korea. 17% 15,516. 6% Hong Kong. 7% -90, % China (Taiwan) -3% 13% 3,734. 4% Vietnam. 143% 3, % Netherlands. -15% 1,873. 5% Philippines. 25% 110% 4, % United Arab Emirates. -31% 1, % Dominican Republic. -24% -7% 2,902. Chile. 21% -2,694. Italy. 47% -43% -1, % Other Countries. 20% -3,948. Total. -1% -290,540. WASDE U.S.: 2014: 2,573 mil lbs 2015: 2,263 (-12%) 2016: 2,475 (+9%) Source: USDA/ERS.")
23
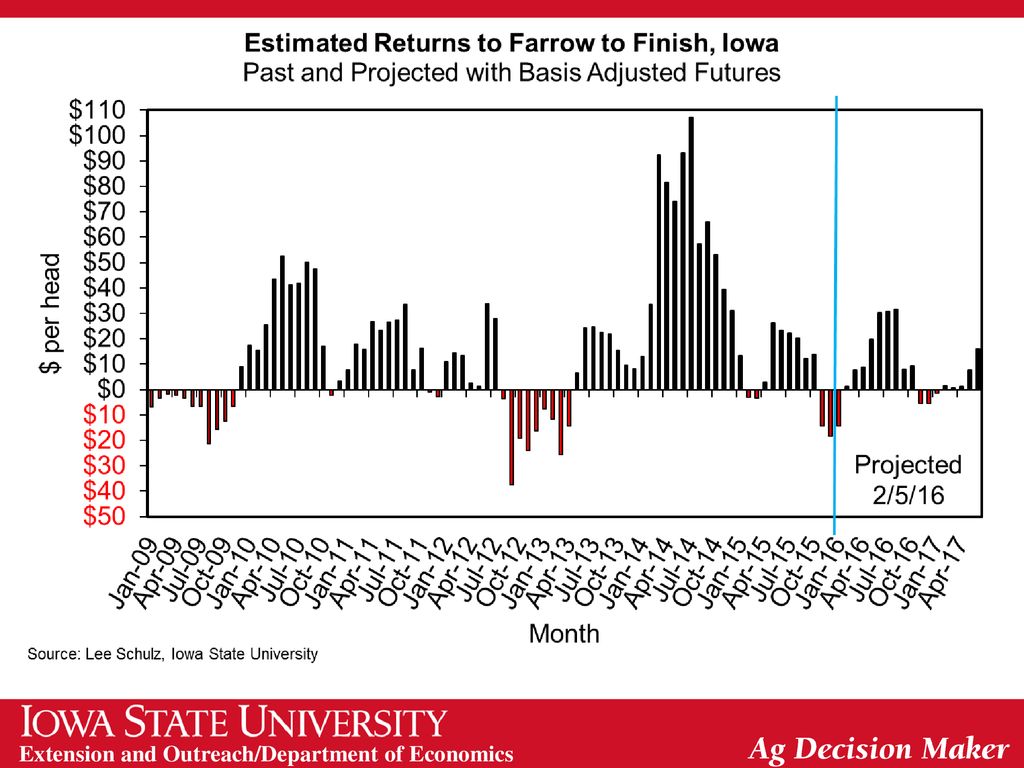
Hog Crush Margin The Crush Margin is the return after the pig, corn and soybean meal costs. Carcass weight: 200 pounds Pig price: 50% of 5 mth out lean hog futures Corn: 10 bushels per pig Soybean meal: 150 pounds per pig Source: ISU Extension

25
Data Source: CME Group

26
New Pork Packing Plants (2017) Sioux City, IA ― Seaboard/Triumph
Coldwater, MI ― Clements Foods Data Source: USDA/AMS. * Steve Meyer, Vice President, Pork Analysis, Express Markets Inc. Analytics.

27
U.S. Pork Exports, Jan-Nov 2015
(Volume excluding by-products & variety meats) Nov-15/Oct-15 Nov-15/Nov-14 Year-to-Date Country Percent 1,000 lbs Japan 4% 15% -27,271 -2% Mexico 5% 26% 162,566 13% Canada 8% 3% -14,198 -3% South Korea 24% 9% 108,051 32% China (Mainland) -5% 90% -82,764 -26% Hong Kong 16% 55% -4,035 -4% Australia 11% 72% 18,375 Philippines -48% 18% -24,088 China (Taiwan) -66% 11,508 48% Honduras 30% 40% 13,149 29% Colombia 0% -15% -19,484 -16% Dominican Republic 56% 16,546 38% Guatemala 28% 5,049 17% Chile -38% -62% -2,831 -7% Other Countries -111,678 -41% Total 19% 48,894 1% WASDE U.S.: 2014: 4,857 mil lbs : 4,946 (+2% vs 2014) : 5,125 (+4% vs 2015) Source: USDA/ERS
 Nov-15/Oct-15. Nov-15/Nov-14. Year-to-Date. Country. Percent. 1,000 lbs. Japan. 4% 15% -27, % Mexico. 5% 26% 162, % Canada. 8% 3% -14, % South Korea. 24% 9% 108, % China (Mainland) -5% 90% -82, % Hong Kong. 16% 55% -4, % Australia. 11% 72% 18,375. Philippines. -48% 18% -24,088. China (Taiwan) -66% 11, % Honduras. 30% 40% 13, % Colombia. 0% -15% -19, % Dominican Republic. 56% 16, % Guatemala. 28% 5, % Chile. -38% -62% -2, % Other Countries. -111, % Total. 19% 48,894. 1% WASDE U.S.: 2014: 4,857 mil lbs 2015: 4,946 (+2% vs 2014) 2016: 5,125 (+4% vs 2015) Source: USDA/ERS.")
28
Thank you for your time. Any questions. My web site: http://www2. econ
Thank you for your time! Any questions? My web site: Iowa Farm Outlook: Ag Decision Maker:

Similar presentations