Download presentation
Presentation is loading. Please wait.

1
Welcome to Year 11! Plan of attack!!

2
As most of you are aware …
We covered 2/3 of each unit last year (and in the case of Rivers, more than that). So we still have 4 weeks each for most units (except Rivers which has 3). As you will see, each unit as per the syllabus is divided into 3 broad questions, and in most cases (exc r…) we have covered 2 of them. So this is the general trend: Week 1 – review section 1 Week 2 – review section 2 Week 3/4 - complete section 3 and look at exam type questions
. So we still have 4 weeks each for most units (except Rivers which has 3). As you will see, each unit as per the syllabus is divided into 3 broad questions, and in most cases (exc r…) we have covered 2 of them. So this is the general trend: Week 1 – review section 1. Week 2 – review section 2. Week 3/4 - complete section 3 and look at exam type questions.")
3
The next 3 weeks: Rivers Key question 1: The world’s water supply is contained within a closed system — the hydrological cycle. Water is transferred between its various stores. Key Question 2: Running water has a significant influence on the development of landforms Key Question 3:Water is vital to people, varies in availability and therefore needs careful management.

4
Rivers – week 1 Key question 1: The world’s water supply is contained within a closed system — the hydrological cycle. Water is transferred between its various stores. Essential content The hydrological cycle: characteristics, stores and transfers. Features of a drainage basin: watershed, source, mouth, channel network. The hydrograph (discharge, base flow, stormflow) and river regimes: factors affecting them (precipitation, temperature, water abstraction, dams).
 and river regimes: factors affecting them (precipitation, temperature, water abstraction, dams).")
5
Rivers- week 2 Key Question 2: Running water has a significant influence on the development of landforms Essential content Processes: weathering and mass movement; erosion and deposition. Factors affecting these processes (stream velocity, slope, geology). Formation of valleys, interlocking spurs, waterfalls, meanders, oxbow lakes, flood plains and levees. Practical skills Measuring channel features measurement Annotated sketches based on photographs.
. Formation of valleys, interlocking spurs, waterfalls, meanders, oxbow lakes, flood plains and levees. Practical skills. Measuring channel features measurement. Annotated sketches based on photographs.")
6
Rivers- week 3 Key Question 3:Water is vital to people, varies in availability and therefore needs careful management. Essential content The uses of water: agriculture, industry, human hygiene and leisure including the reasons for a rising demand resulting in areas of water surplus and water shortage. Reasons for differences in water quality. Sources of pollution (sewage, industrial waste, agriculture). Managing the supply of clean water (dams and reservoirs; pipelines; treatment works). Flooding: causes (intensity of rainfall, snowmelt, steep slopes, impermeable surfaces, human activities) and control (construction of spillways, embankments). Practical skills Measuring water quality Case Studies Case study of the rising demand for water in one country. A case study of a dam or reservoir project. A case study of a flood defence scheme.
. Managing the supply of clean water (dams and reservoirs; pipelines; treatment works). Flooding: causes (intensity of rainfall, snowmelt, steep slopes, impermeable surfaces, human activities) and control (construction of spillways, embankments). Practical skills. Measuring water quality. Case Studies. Case study of the rising demand for water in one country. A case study of a dam or reservoir project. A case study of a flood defence scheme.")
7
The hydrological cycle: characteristics, stores and transfers.
Recall, a cycle goes round and round, so there are no inputs and no outputs The movement of water through plant cells into the atmosphere. Movement of water confined within a river or stream. The movement of water into the soil layers. The processes by which water reaches the soil or surface. Trees and other vegetation, which prevent moisture from reaching the ground directly. Movement of water from vegetation to the ground surface. The upper level of saturated rocks; it may move between seasons and years. Movement of water through the soil, either under gravity, or parallel to the ground surface. Movement of water over the ground surface (also known as surface runoff). The combined processes by which water is lost by evaporation and transpiration.
. The combined processes by which water is lost by evaporation and transpiration.")
8
This is one worth learning to draw
Features of a drainage basin: watershed, source, mouth, channel network. Watershed: The dividing line between one drainage basin and another. River channel: The part of a valley floor occupied by the flowing water of a stream or river Drainage basin: The area from which all the water in it flows into a river and its tributaries. Tributary: a smaller river that joins the main one Confluence: the point at which 2 streams join together Source: the spring or boggy from which a stream flows out Mouth: the point at which a river flows into a lake or ocean This is one worth learning to draw

9
Features of a drainage basin: watershed, source, mouth, channel network.
Watershed: The dividing line between one drainage basin and another. River channel: The part of a valley floor occupied by the flowing water of a stream or river Drainage basin: The area from which all the water in it flows into a river and its tributaries. Tributary: a smaller river that joins the main one Confluence: the point at which 2 streams join together Source: the spring or boggy from which a stream flows out Mouth: the point at which a river flows into a lake or ocean The Tees is a river in Northern England. It rises on the eastern slope of Cross Fell in the Pennines, 750m above sea level, and flows eastwards for about 137 km to reach the North Sea. It drains an area of 1834 square km and has no important tributaries.

10
A variation on the hydrological cycle:
It has items entering the system INPUTS It has items leaving the system OUTPUTS Can be called the hydrological system of a drainage basin or drainage basin system – it is no longer a cycle, so …

11
Here it is with the different processes analysed by function
The hydrological system of a drainage basin: characteristics, stores and transfers. Here it is with the different processes analysed by function

12
The hydrograph (discharge, base flow, stormflow) and river regimes:
Recall that hydrographs measure the discharge of a river at particular point over time. The discharge is measured in cumecs, that is the number of cubic metres passes a particular point in a second – this is an annual hydrograph and shows the river regime Why does the discharge change in summer? But there is another particular sort of hydrograph – the storm hydrograph – this combines the rainfall with discharge and is used to explore the impact of one on the other What might you see if the river passes through an cold area in winter?

13
The hydrograph (discharge, base flow, stormflow) and river regimes:
Please note that understanding and being able to use all these terms is essential

14
The hydrograph (discharge, base flow, stormflow) and river regimes:
A Hydrograph has a number of main characteristics: Precipitation – shown as a bar graph Base Flow – flow supplied by groundwater. This is a slow movement therefore base flow rises slower and later. Storm Flow – flow supplied by overland flow and soil throughflow. This gives the peak flows. Storm flow Rising limb Rising Limb is the angle of the rise towards peak discharge – includes (a) rainwater that fell into stream (b) water flowing overland and into stream channels as the soil water becomes saturated. (a) & (b) lead to peak discharge. Lag Time – the time it takes from peak rainfall to peak discharge.
 rainwater that fell into stream. (b) water flowing overland and into stream channels as the soil water becomes saturated. (a) & (b) lead to peak discharge. Lag Time – the time it takes from peak rainfall to peak discharge.")
15
Factors affecting storm hydrographs
Storm flow Rising limb The shape of the rising limb depends on: The length of the rainstorm – a long period of rainfall causes rise in the water table and increased overland flow. The intensity of rainfall – If heavy – considerable storm flow if the soil is incapable of soaking it in and storing it a steep rising limb. If light – less steep rise and flatter shape since rain is easier to store. The condition of the soil – If the soil is already saturated more water flows overland into streams and this leads to a higher and earlier peak. Shape of the drainage basin - a long narrow basin with tributaries joining the main channel at regular intervals gives a less steep rise A wide basin with tributaries more closely spaced gives a steep rise.

16
Factors affecting storm hydrographs
Lag Time – the difference in time between peak rainfall and the peak discharge. Lag time depends on: The condition of the soil – if the soil is fairly dry, the longer the lag time since rainfall can be stored at first before the excess flows to the channels. Angle of slopes – the more gentle the slope the longer the lag time compared to steep slopes. Intensity of rainfall – prolonged, steady rainfall has a longer lag time than intense rainfall. Storm flow Rising limb Size of drainage basin – small basins have a small lag time; larger basins with more tributaries have a longer lag because the tributaries act as temporary storage before run-off increases rapidly.

17
Factors affecting storm hydrographs
Five other issues: 1. What effect do you think of having trees growing on the river banks as against grass or maybe soil or just rocks, on: the rising limb? the lag time? the peak flow? 2. What effect do you think of having concrete and tarmac in a town as against parks and gardens, on these factors? 3. What effect do you think permeable underlying rock will have when compared with impermeable underlying rock? Storm flow Rising limb 4. Time of year – what effect would a warm summer day have on the 3 variables? A period of heavy snow? A winter time with plenty of rain above freezing? 5. What about human control – building a dam for example? Or an industry extracting water for its processes, like steel manufacture?

18
Factors affecting storm hydrographs
Green or blue, because: Heavy rainstorm All these form now on have several hours of steady rain Tree-lined river banks Small drainage basin On impermeable rock On saturated soil On a river in which there is a reservoir upstream from the point of measuring On steep sloping river course On river running through ploughed land in autumn River system A A large drainage basin On a river that is downstream from where extraction (for industrial purposes) takes place River system B On dry soil On gently sloping river course On a river through a town A B
 takes place. River system B. On dry soil. On gently sloping river course. On a river through a town. A. B.")
19
Rivers- week 2 Key Question 2: Running water has a significant influence on the development of landforms Essential content Processes: weathering and mass movement; erosion and deposition. Factors affecting these processes (stream velocity, slope, geology). Formation of valleys, interlocking spurs, waterfalls, meanders, oxbow lakes, flood plains and levees. Practical skills Measuring channel features measurement Annotated sketches based on photographs.
. Formation of valleys, interlocking spurs, waterfalls, meanders, oxbow lakes, flood plains and levees. Practical skills. Measuring channel features measurement. Annotated sketches based on photographs.")
20
River Processes that change the landscape include
Weathering and mass movement; Erosion Transportation and Deposition. The first one was never really covered last year, but the other 3 were in some depth. Since I found some really good piccies of this first one – I have borrowed it complete!

21
Weathering and Mass Wasting
Physical or mechanical Weathering Chemical Weathering Mass Wasting

22
Weathering and Mass Wasting
weathering is the combined action of physical weathering, in which rocks are fractured and broken, and chemical weathering, in which rock minerals are transformed to softer or more soluble forms

23
Physical Weathering one of the most important physical weathering processes in cold climates is freeze-thaw , the repeated growth and melting of ice crystals in the pore spaces of soil and in rock fractures when water freezes in bedrock joints and bedding planes, it expands and can split rocks apart

24
Physical Weathering Exfoliation : where there is a large diurnal (daily) range of temperature, the rocks expand in the daytime and contract at night. This causes the rock surface to weaken, producing rounded rock forms Exfoliation of Granite
 range of temperature, the rocks expand in the daytime and contract at night. This causes the rock surface to weaken, producing rounded rock forms. Exfoliation of Granite.")
25
Chemical Weathering Involves change in the composition of the rocks. Water or slightly acid rain reacts with the chemicals in the rock, which is then dissolved away. In the case in the picture, acid rain is reacting with limestone on exposed surfaces.

26
Chemical Weathering and its Landforms
Marble Slate

27
What is mass wasting? Once rock has been loosened by weathering, it may start to move down hill under gravity. This means that the steeper the slope is, the faster it happens. If it is slow, then you get soil creep. Faster and you get more dangerous mudslides, often brought on by heavy rain. When a greater volume of loose material is involved this can lead to land slides

28
Mass Wasting Figure 14.13, p. 490

29
Mass Wasting – Soil Creep

30
An example of mass wasting - mudslide
IG4e_14_opener An example of mass wasting - mudslide IG4e_14_opener.jpg 30

31
Mass Wasting Landslides
Las Colinas Landslide, El Salvador, Feb. 2003

32
Mass Wasting And this is the damage at ground level

33
For those who were here before, I guess you might remember these chaps
Deposition Transportation Erosion I would guess you also recall that 2 of these can be accomplished by several means? traction , suspension, solution, saltation, hydraulic action, corrosion, attrition, abrasion erosion The wearing down of the land by water, ice, wind and gravity. Deposition the laying down of material that has been carried from elsewhere Transportation the movement of material by wind, ice or water traction the movement of large rocks rolling along the riverbed suspension silt and clay carried along by a river solution dissolved material carried along in the river saltation small stones and sand that moves along the riverbed by bouncing hydraulic action the force of the water removes loose material from the bed and banks of a river corrosion wearing away of the riverbed by chemical reactions that dissolve the rocks attrition the way in which rocks become smoother and smaller as they bump as they are moved along by the river abrasion wearing away the river bed by rocks and pebbles

34
Now you know about the processes that enable the river to change
What does the river look like?

35
The River Tees High Force This is where it is

36
Upper Course Characteristics: Deep narrow valley (V shaped)
Interlocking spurs Fast flowing river (erosion predominant) Pot holes in the river bed Rapids and Waterfalls The main process at work is the downward or vertical erosion of the stream bed. This cuts into the landscape deepening the valley sides.
 Pot holes in the river bed. Rapids and Waterfalls. The main process at work is the downward. or vertical erosion of the stream bed. This. cuts into the landscape deepening the valley. sides.")
37
The source of Tees He is Matthew – could not find a picture without him! See the beginnings of the V-shaped valley and interlocking spurs. Its source area is high in the Pennines in the west and the river flows eastwards into the North Sea. The source of the River Tees lies on Cross Fell in the Pennines, 893m above sea level, where rainfall is over 2000mm a year.

38
Notice the big angular rocks – the bedload – and also the rapids (or miniwaterfalls)
Potholes: Potholes are formed by corrasion. Pebbles carried by the river are swirled around on the riverbed. This action erodes the rock on the riverbed forming potholes. Over time, they may widen and join with other potholes to form larger potholes, and the whole riverbed is deepened. There are some deep ones on the River Tees below High Force (see later)
")
39
RAPIDS on the River Tees
Rapids form where there are alternating bands of hard and soft rock, as seen here above High Force on the Tees

40
This is one worth learning to draw

41
Example: High Force on the River Tees
It has a deep plunge pool at its base with a striking gorge of recession that has been created over thousands of years. It is the one of the highest waterfalls in England, at 21m – it is certainly most impressive to look at.

42
How High Force was formed

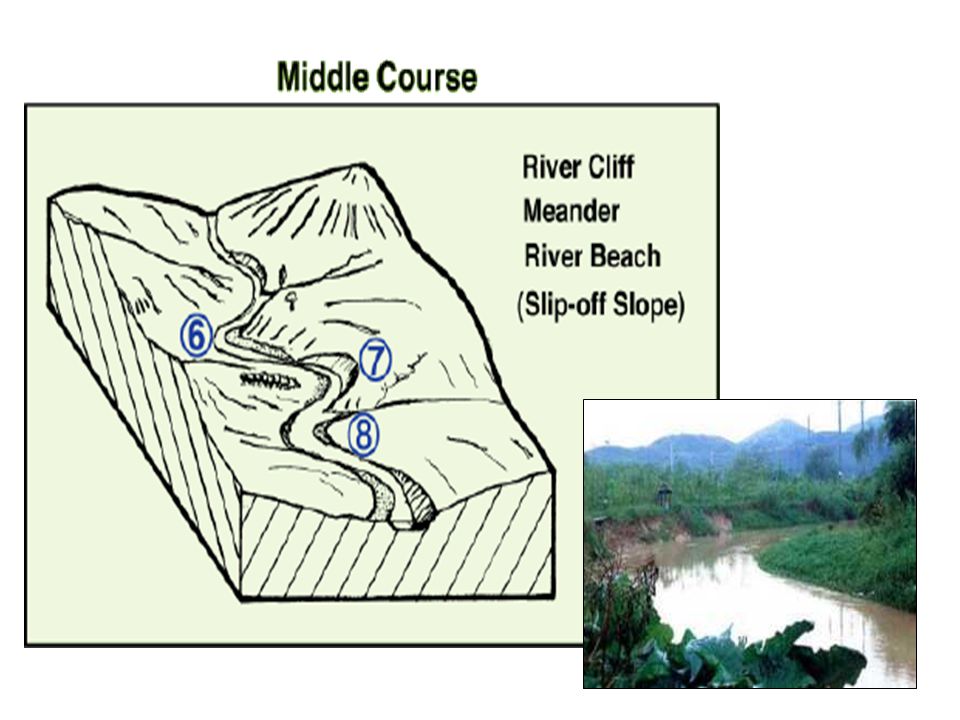
44
Fast flowing water has more energy
River cliff forms Slip-off slope This is one worth learning to draw

45
Slow, shallow water and deposition on the inside of the bend
Deep, fast water and erosion on the outside of the bend

47
As the outer banks of a meander continue to be eroded through processes such as hydraulic action the neck of the meander becomes narrow and narrower.

48
This is one worth learning to draw
Oxbow lakes Eventually due to the narrowing of the neck, the two outer bends meet and the river cuts through the neck of the meander. The water now takes its shortest route rather than flowing around the bend. Deposition gradually seals off the old meander bend forming a new straighter river channel. Due to deposition the old meander bend is left isolated from the main channel as an ox-bow lake. Over time this feature may fill up with sediment and may gradually dry up (except for periods of heavy rain). When the water dries up, the feature left behind is known as a meander scar. This is one worth learning to draw
. When the water dries up, the feature left behind is known as a meander scar. This is one worth learning to draw.")
49
Towards the mouth of the Tees, it meanders way across the plain
Eventually the river will cut through – what is that called?

50
Levees (thanks to Mark Bailey)
")
51
The Mississippi has the most notorious ones!
What are they? Often several metres higher than the river’s floodplain, they are high natural embankments of silt situated close to the river channel. Where are they found? They are most commonly found in the lower course of a river where there is a floodplain, along rivers that flood periodically, have a slow flow and carry large amounts of load. The Mississippi has the most notorious ones!

52
The river before the flood at regular height.
How are they formed? The river before the flood at regular height. The silt is carried as part of the load The river whilst flooding - The silt is lifted onto the bank

53
There is an increase in friction between the water leaving the channel and the floodplain when a river overflows. The water is shallower on the river banks and valley floor This is why deposition of load occurs just beyond the bank. These banks increase in size with each flood. The coarser material is deposited first, and is positioned closer to the river. After repeated flooding, the river bed and levees are raised due to the constant process of the deposition of silt. Over time, this eventually causes the river to rise above level of flood plain. This is called an ‘aggraded bed’.

54
The end of the river Eventually the river flows into a lake or a sea or an ocean. If the water it flows into has little current, any remaining silt is dropped as it enters and there is no current to remove it and a delta forms. Mississippi Delta

55
But in the UK … There are plenty of currents to wash away any silt that is dropped and so our rivers have mouths instead. I google-mapped this one. Where is it?

56
Practical skills Measuring channel features measurement
Annotated sketches based on photographs.

57
Measuring river features
What can you measure? Width Depth From this you can work out a rough cross-section area – you do need to know how this can be done! Rate of flow (oranges!!) From these last 2 you can work out the discharge Stone longitudinal length and angularity (Power’s chart)
 From these last 2 you can work out the discharge. Stone longitudinal length and angularity (Power’s chart)")
58
Measuring river features

59
Measuring water quality
What can you measure? Physical characteristics Temperature – algae and bacteria both do better in warm water, neither of which are good for water quality. There is less dissolved oxygen and more dissolved solids in warm water, neither of which are good for water quality Turbidity – high turbidity means cloudy – highly turbid water is in general not good for water quality Acidity – water should be broadly neutral with a pH of around 7- neither stronger acid not stronger alkaline reading are good for water quality – so acid water dues to sitting in a boggy area too long or due to cow/sheep poo is not good, nor are alkaline chemicals released from industrial processes good Dissolved oxygen – high dissolved oxygen is good for water quality. It means the plants are healthy and releasing oxygen. There is not too much decay going on. This is carried out by bacteria which are hungry users of oxygen. Also indicates low levels of dangerous bugs.

60
Measuring water quality
What else can be measured? Nutrients: nitrogen and phosphorous are not good for the plant and animal life. They find their way in from fertilizer running off the fields and urine and faeces from farm animals entering the water (see below) Toxic substances: many harmful things like metals, pesticides, and oil can be found in water and indicates that it should not be used for drinking water for example. Bacteria: certain types of bacteria, viruses and germs that can make you sick can be found in water. Often they come from faeces, both animal and human. Biological sampling: the health of waters can be found by taking samples of fish, plants and smaller invertebrates. Some of them love to live in water that’s dirty, so if scientists find a lot of those in a sample, they know there’s a problem. Other organisms can survive only in water that’s very clean, so finding those means the water is probably healthy.
 Toxic substances: many harmful things like metals, pesticides, and oil can be found in water and indicates that it should not be used for drinking water for example. Bacteria: certain types of bacteria, viruses and germs that can make you sick can be found in water. Often they come from faeces, both animal and human. Biological sampling: the health of waters can be found by taking samples of fish, plants and smaller invertebrates. Some of them love to live in water that’s dirty, so if scientists find a lot of those in a sample, they know there’s a problem. Other organisms can survive only in water that’s very clean, so finding those means the water is probably healthy.")
61
A picture from Nathan – can you sketch and annotate this?
What does annotation mean?

62
A picture from Nant Gwynllyn – can you sketch and annotate this?

63
Rivers- week 3 Key Question 3:Water is vital to people, varies in availability and therefore needs careful management. Essential content The uses of water: agriculture, industry, human hygiene and leisure including the reasons for a rising demand resulting in areas of water surplus and water shortage. Reasons for differences in water quality. Sources of pollution (sewage, industrial waste, agriculture). Managing the supply of clean water (dams and reservoirs; pipelines; treatment works). Flooding: causes (intensity of rainfall, snowmelt, steep slopes, impermeable surfaces, human activities) and control construction of spillways, embankments). Practical skills: Measuring water quality – aready covered Case study of the rising demand for water in one country. A case study of a dam or reservoir project. A case study of a flood defence scheme.
. Managing the supply of clean water (dams and reservoirs; pipelines; treatment works). Flooding: causes (intensity of rainfall, snowmelt, steep slopes, impermeable surfaces, human activities) and control construction of spillways, embankments). Practical skills: Measuring water quality – aready covered. Case study of the rising demand for water in one country. A case study of a dam or reservoir project. A case study of a flood defence scheme.")
64
First stage: The uses of water: agriculture, industry, human hygiene and leisure including the reasons for a rising demand resulting in areas of water surplus and water shortage. Case study of the rising demand for water in one country.

65
Uses of water The uses are fairly obvious:
agriculture, industry, human hygiene and leisure Which do you think is most common use of water? Surprising? But do remember this is the average. As a country develops, more water will be needed domestically ( washing machines, dishwashers) and also for recreation – golf courses and swimming pools
 and also for recreation – golf courses and swimming pools.")
67
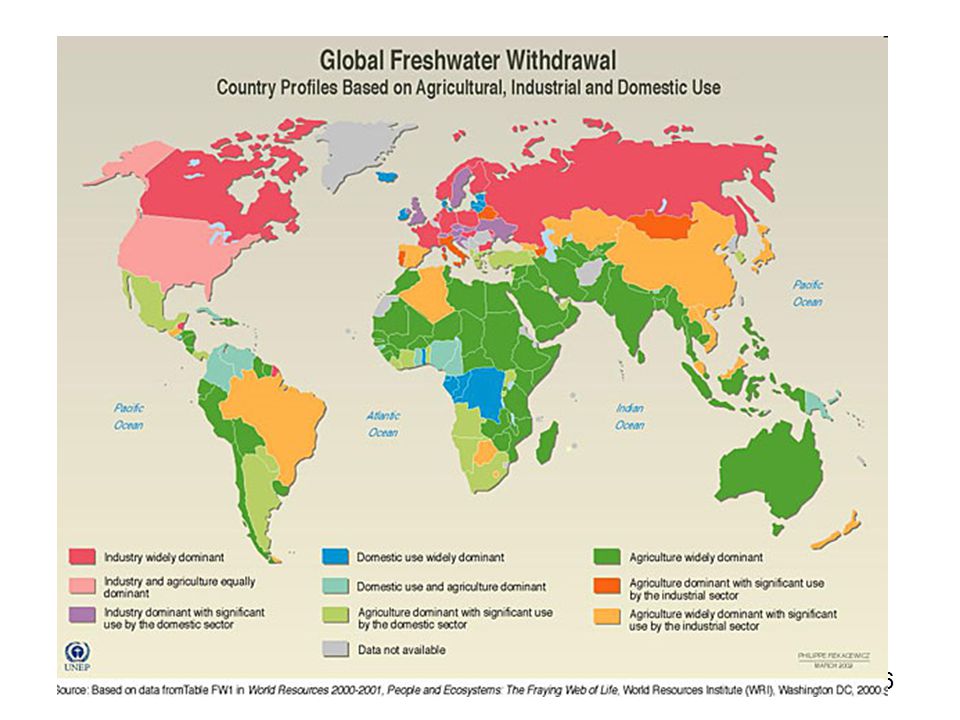
Map showing water scarcity worldwide
Which colours indicate the a country does not have enough water available? What is the difference between yellow and red?

68
Here is the general picture

69
India is similar to other low/middle income countries
Why do you think India still uses so much water in agriculture? As India becomes more industrialized, industries needs will rise

70
Industrial use in India
What industries use most of the water at the moment? And as India industrializes more, more water will be needed

71
Indian Industry Thermal power engineering textiles paper
that is it burns things – engineering textiles paper All use a lot of water and soon more will be needed According to the World Bank, the water demand for industrial uses and energy production will grow at a rate of 4.2 per cent per year, rising from 67 billion cubic meter in 1999 to 228 billion cubic meter by 2025. What is the main thing that is burnt to make electricity> Why is so much water needed?

72
Not only industry will need more
Only 88% have potable water – the others want it to – especially as India develops Indians population is set to increase by 60% by 2050 from 2000 levels – they all want clean drinking water What are 2 issues shown here that say that India will need more water in future?

73
So we have a neat little case study here
Example of growing water usage in a country Place: India How do they use their water at present? Domestic: ? Industrial:? Agriculture:? Why will it rise? Industrial use: ? (think – which industries use most? Which will increase? By how much will it increase?) Domestic use?: (Population: what is happening to it – figures. Potable water – mention that have done well but still need?)
 Domestic use : (Population: what is happening to it – figures. Potable water – mention that have done well but still need )")
74
Ways to improve things In rural areas, dig wells which you then line and cover to prevent them becoming contaminated. On a large scale, build dams to collect water that can then be distributed to irrigate agricultural land and take fresh water to the cities On a smaller scale, build infrastructure (long word for pipes and taps) in the poorer parts of cities. Waste less!
 in the poorer parts of cities. Waste less!")
75
Second stage: Reasons for differences in water quality. Sources of pollution (sewage, industrial waste, agriculture). Managing the supply of clean water (dams and reservoirs; pipelines; treatment works). A case study of a dam or reservoir project.
. Managing the supply of clean water (dams and reservoirs; pipelines; treatment works). A case study of a dam or reservoir project.")
76
Reasons for differences in water quality.

77
What does managing mean? Making sure that:
Managing the supply of clean water (dams and reservoirs; pipelines; treatment works) What does managing mean? Making sure that: There is clean water available for everyone by Having the correct infra structure – pipes and taps There is a reliable source – well, clean surface water, reservoir storage Ensuring the sewage system is in place to keep the fresh water safe Clean up the used water before it is released into a river/sea. Water treatment before you use it or after you have finished with it is fairly similar – check out the diagrams on
 What does managing mean Making sure that: There is clean water available for everyone by. Having the correct infra structure – pipes and taps. There is a reliable source – well, clean surface water, reservoir storage. Ensuring the sewage system is in place to keep the fresh water safe. Clean up the used water before it is released into a river/sea. Water treatment before you use it or after you have finished with it is fairly similar – check out the diagrams on")
78
A case study of a dam or reservoir project
Three Gorges Dam

79
Yangtze River and the Three Gorges
The Yangtze is China’s largest river stretching 5,600 kms from its source in Tibet to where it enters the Yellow Sea near Shanghai. Midway through its course the river flows through a 190km section known as the Three Gorges. The river valley narrows here and there are steep limestone cliffs on either side. The river is fast flowing and hidden rocks make it dangerous for ships.

80
The Scheme The dam, now nearly completed, is the biggest in the world, 2kms wide and 185 metres high. It will create a reservoir 600kms long behind it. It was started in 1993 and has just about been finished in 2009. The cost will be at least $20 billion and the hydro-electric plant will generated 18,000 megawatts of electricity, making it the biggest HEP station in the world, providing 10% of China’s electricity

81
Advantages of the Scheme
During the 20th Century there were 3 catastrophic floods, plus many smaller ones. Over 300,000 people have been drowned. The dam will prevent flooding, thereby saving thousands of lives. The dam will provide 10% of China’s present electricity requirements. It will be a clean fuel, reducing China’s SO2 emissions and helping to reduce global warming gases. All year round navigation will be possible by ocean going vessels as far as Chongqing at the far end of the reservoir. Over 20,000 medium term jobs have been provided in the construction industry. This will create a positive multiplier effect to the local economy Workers on the dam earn money – they need places to stay and food etc. This will increase the size of the local for shop keepers, hotels etc These people will buy in more local materials from farms, factories. These businesses will need more labour etc The idea being that if you add new money to an area, many people benefit who are not directly involved with the project Multiplier effect?

82
Disadvantages of the Scheme
1.2 million people will be relocated. This will include 13 cities, 140 towns, and 4500 villages. In addition 1600 industrial enterprises will have to be relocated. 23,000 hectares of fertile farmland and 7000 hectares of forest will be drowned. Prior to the dam, spring floods were a regular feature. They brought fertile silt downstream to the farms on the banks of the river, which reduced the need for artificial fertilizer. This fertile soil will be lost to farms downstream from the dam. This is likely to lead to an increase in the use of chemical fertilisers.

83
Disadvantages of the Scheme
Sediment will build up behind the dam over time leading to a squeezing out of the reservoir. Pollution in the form of sewage and toxic metals from industry will collect and build up the reservoir. The reservoir will create much deeper, colder water thereby changing the environment including types and numbers of fish. The dam lies near an earthquake fault line. Although the government says they have taken this into account, any major earthquake could create a disaster on an unprecedented world scale, with a death toll of several million.

84
What do you notice about the visibility?

85
Issues over large dam projects have led to changes
Up until the mid 1990s, the World bank funded many large dam projects. According to the Manibeli Declaration these large dams have had "extensive negative environmental impacts, destroying forests, wetlands, fisheries, habitat for threatened and endangered species, and increasing the spread of waterborne diseases." In addition the World Bank has "tolerated and thus contributed to gross violations of human rights by governments in the process of implementing Bank-funded large dams, including arbitrary arrests, beatings, rapes, and shootings of peaceful demonstrators.“ As a result of this and other criticisms, they stopped. In simple terms, why were large dams seen as a bad idea?

86
Third stage: Flooding: causes (intensity of rainfall, snowmelt, steep slopes, impermeable surfaces, human activities) and control (construction of spillways, embankments). A case study of a flood defence scheme
 and control (construction of spillways, embankments). A case study of a flood defence scheme.")
87
Causes of Flooding Intensity of rainfall, Snowmelt, Steep slopes,
Impermeable surfaces, Human activities – like what? We have already covered these when looking at storm hydrographs. Can you remember why these particular features cause floods?

88
Controlling floods They talk of spillaway and embankments in the syllabus, but there are many others. There are 2 groups of techniques, hard and soft engineering. ‘Hard' options tend to be more expensive and have a greater impact on the river and the surrounding landscape. 'Soft' options are more ecologically sensitive.

89
Hard engineering Dams and reservoirs – can be use to control the amount of water downstream and therefore prevent floods of towns or other essential installations, e.g. Cow Green reservoir on the R Tees Building embankments (or artificial levees), e.g. Mississippi at New Orleans Flood Walls – stronger versions of levees Revetments - floodwalls built at a low angle to reduce erosion by the flood water Gabions – cheaper versions to reduce erosion – metal baskets filled with large stones Channelizing (straightening) and dredging rivers to increase the speed which the water passes through and so reducing flood risk Diversion channels and diversion basins (spillaways) which take the water away from towns etc Culverts – passing a river through a pipe.
, e.g. Mississippi at New Orleans. Flood Walls – stronger versions of levees. Revetments - floodwalls built at a low angle to reduce erosion by the flood water. Gabions – cheaper versions to reduce erosion – metal baskets filled with large stones. Channelizing (straightening) and dredging rivers to increase the speed which the water passes through and so reducing flood risk. Diversion channels and diversion basins (spillaways) which take the water away from towns etc. Culverts – passing a river through a pipe.")
90
Soft engineering Afforestation
Managed flooding (or ecological flooding) Planning (or land use zoning) Monitoring and warning systems
 Planning (or land use zoning) Monitoring and warning systems.")
91
River Tees – Management – the issues
The River Tees has a long history of flooding. The first documented flood was at Croft on the lower Tees in 1356. Many of the previous floods were precipitated by snow melt. However, the Environment Agency suggest that this will be less of a problem in the futures. But, intense rainfall is more likely to be a problem so flash floods will become more frequent, especially as more of it has become concreted over The Tees valley is also home to a large population and many industries, all requiring a reliable water supply. The river is managed to provide a water supply and to control flooding. In recent years there have also been developments to increase its potential for recreation and tourism.

92
River Tees - Management
Cow Green reservoir was built in 1970 to provide water for the growing industries on Teesside. It is a regulating reservoir, storing water in times of plenty and releasing enough for the needs of industry in times of low flow. In times of severe summer droughts water can be added to the River Tees via a tunnel which connects it to the River Tyne and Kielder reservoir. Dredging The lower stretches of the Tees estuary are dredged (sediment is extracted) periodically to improve navigation by maintaining a deep-water channel. There has also been some dredging in the upper parts of the estuary to reduce the flood risk - it increased the capacity of the channel.
 periodically to improve navigation by maintaining a deep-water channel. There has also been some dredging in the upper parts of the estuary to reduce the flood risk - it increased the capacity of the channel.")
93
Lower Tees Valley- Management
The Tees Barrage (a man made barrier across a river) – The aim of the Tees Barrage was to improve the water quality and recreational value of 22km of the lower Tees. The barrage was completed in 1995 and cost £54 million. The 22km stretch of river between Yarm and Stockton is now kept permanently at high tide. The water is fresher and cleaner as it does not mix with the tidal salt water in the lower estuary. The barrage also reduces the risk of flooding at very high tides or during a storm surge. The barrage has acted as a catalyst for £500 million of investment in offices, housing, educational, leisure and shopping facilities.
 – The aim of the Tees Barrage was to improve the water quality and recreational value of 22km of the lower Tees. The barrage was completed in 1995 and cost £54 million. The 22km stretch of river between Yarm and Stockton is now kept permanently at high tide. The water is fresher and cleaner as it does not mix with the tidal salt water in the lower estuary. The barrage also reduces the risk of flooding at very high tides or during a storm surge. The barrage has acted as a catalyst for £500 million of investment in offices, housing, educational, leisure and shopping facilities.")
94
Lower Tees Valley- Management
Cutting of meanders - channelizing In 1810, the Tees Navigation Company cut across the neck of the Mandale Loop, a large meander near Stockton. The new route shortened the river by 4km. Other stretches of the river have been artificially straightened. This allows the water to move faster along the channel (less energy lost with the river banks), reducing the flood risk.
, reducing the flood risk.")
95
Yarm from the air

96
Lower Tees Valley- Yarm
Yarm's flood defence scheme Yarm, a historic market town and once an inland port, is located on the inside bend of a large meander. Yarm is particularly prone to flooding. The most recent serious flood was in January 1995. Since then a new flood defence scheme costing £2.1 million has been built which: reinforced concrete walls with flood gates for access by people and vehicles. earth embankments – artificial levees to contain the river. gabions (baskets filled with stones) to protect the walls and embankments from erosion.
 to protect the walls and embankments from erosion.")
97
Lower Tees Valley- Yarm
The scheme also incorporates features designed to reduce the visual impact of the walls and to enhance the environment. There are fishing platforms, new street lighting and a comprehensive planting scheme. English Heritage approved all building materials used so that they were in keeping with the existing architecture of the town.

98
Lower Tees Valley- Yarm
Improved flood warning systems. These have better liaison with the Meteorological Office, police and other emergency services. Finally, new development discouraged building on low-lying and flood-prone land - an example of land-use zonation - land is used for activities not damaged by inundation (long word meaning severe flooding) e.g. playing fields, parks, urban forests/walks etc
 e.g. playing fields, parks, urban forests/walks etc.")
Similar presentations


 b.Rock type c.Bedload (the amount of material.>")


 _________ 3) _________>")

