Download presentation
Presentation is loading. Please wait.

1
A European model-intercomparison study in support to the CAFE programme on EU environmental legislation organised by JRC-IES (coordinator), IIASA, EMEP, EUROTRAC / TNO-MEP C. Cuvelier, P. Thunis, L. Tarrason, M. Amann

2
Objective To explore changes in air-quality (DELTA) in cities (CITY) due to changes in emission as predicted by atmospheric models with different scales Deltas between: Models Cities Scenarios Scale Focus Integrated assessment of the impact on human health and ecosystems. WHO recommendations: Long term exposure to O 3 (6 month hourly) and PM (12 months daily)
 and PM (12 months daily).")
3
Analyzed cities London Paris Prague Berlin Copenhagen Katowice Milan Marseille

4
Participating models Participating models CHIMEREINERIS-IPSL (France)O 3, PM EMEPMSC-WO 3, PM EPISODENILU (Norway)O 3 LOTOSTNO (Netherlands)O 3, PM MUSCATIFT (Germany)O 3, PM MUSEAUT (Greece)O 3, PM REMFU Berlin (Germany)O 3, PM OFISAUT (Greece)O 3, PM THORNERI (Denmark)O 3 CALGRIDU. Brescia (Italy)O 3 MOCAGEMeteoFrance (France)O 3 STEMCESI (Italy)O 3 EUROSRIVM (Netherlands)O 3 TRANSCHIMCORIA (France)O 3
O 3 MOCAGEMeteoFrance (France)O 3 STEMCESI (Italy)O 3 EUROSRIVM (Netherlands)O 3 TRANSCHIMCORIA (France)O 3.")
5
Emission scenarios Emission scenarios (0)1999 (1)CLE (Current Legislation) 2010 (2)NO x MFR 2010 (Maximum Feasible Reduction) (3)NO x (CLE+MFR)/2 2010 (4)VOC MFR 2010 (5)NO x and VOC MFR 2010 (6)PMcoarse MFR 2010 (7)PM2.5 MFR 2010
1999 (1)CLE (Current Legislation) 2010 (2)NO x MFR 2010 (Maximum Feasible Reduction) (3)NO x (CLE+MFR)/ (4)VOC MFR 2010 (5)NO x and VOC MFR 2010 (6)PMcoarse MFR 2010 (7)PM2.5 MFR 2010")
6
Berlin Katowice London Milan Paris Prague O 3 : 224 model runs for 6 months PM: 89 model runs for 12 months Available model runs Available model runs

7
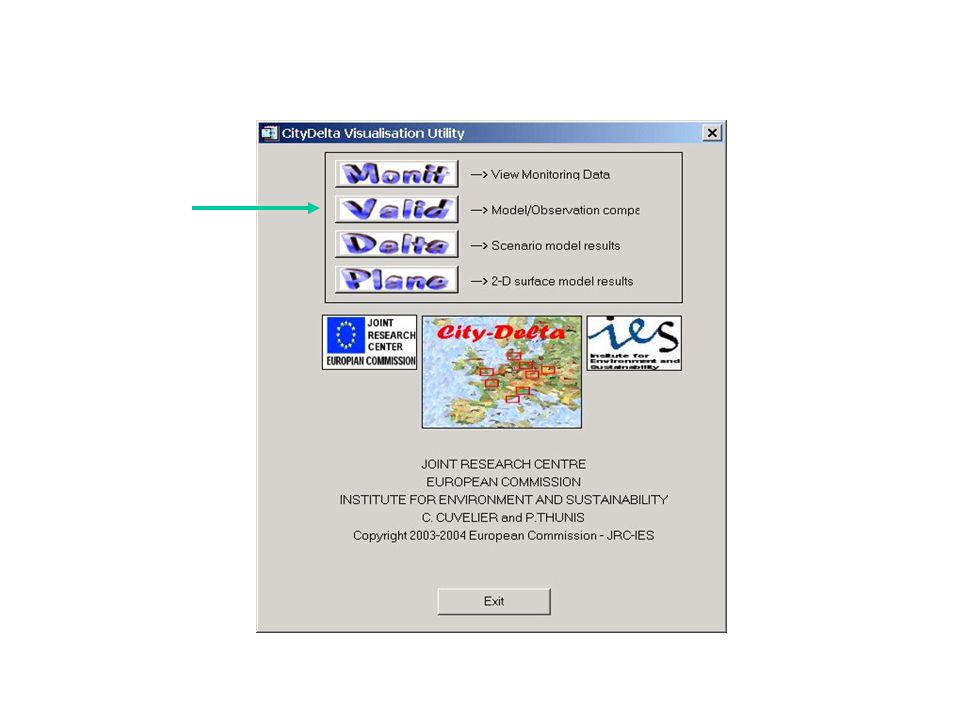
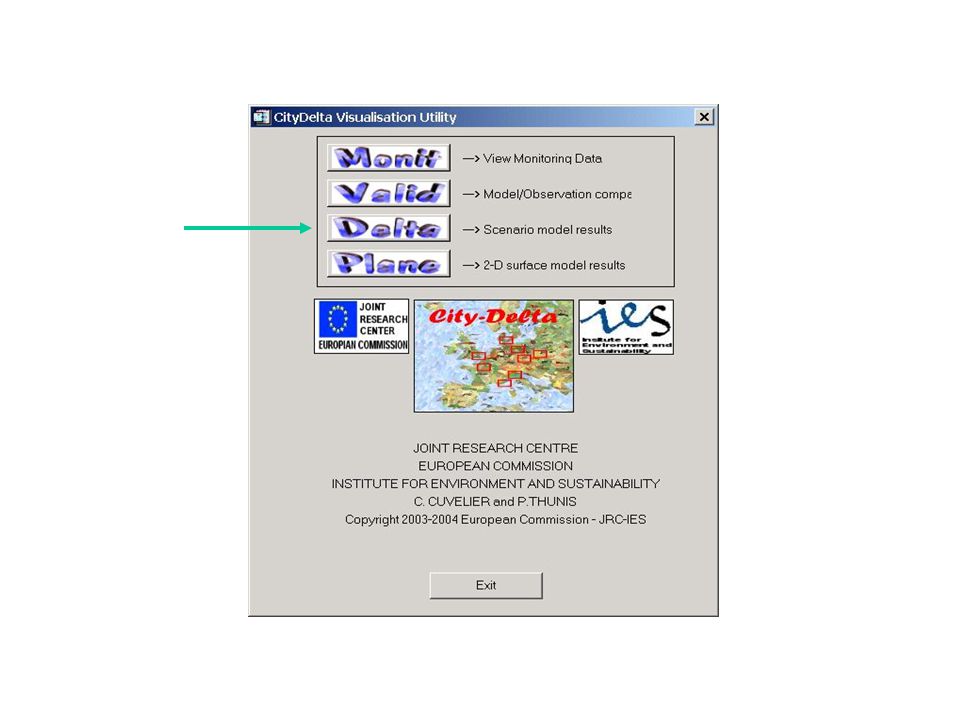
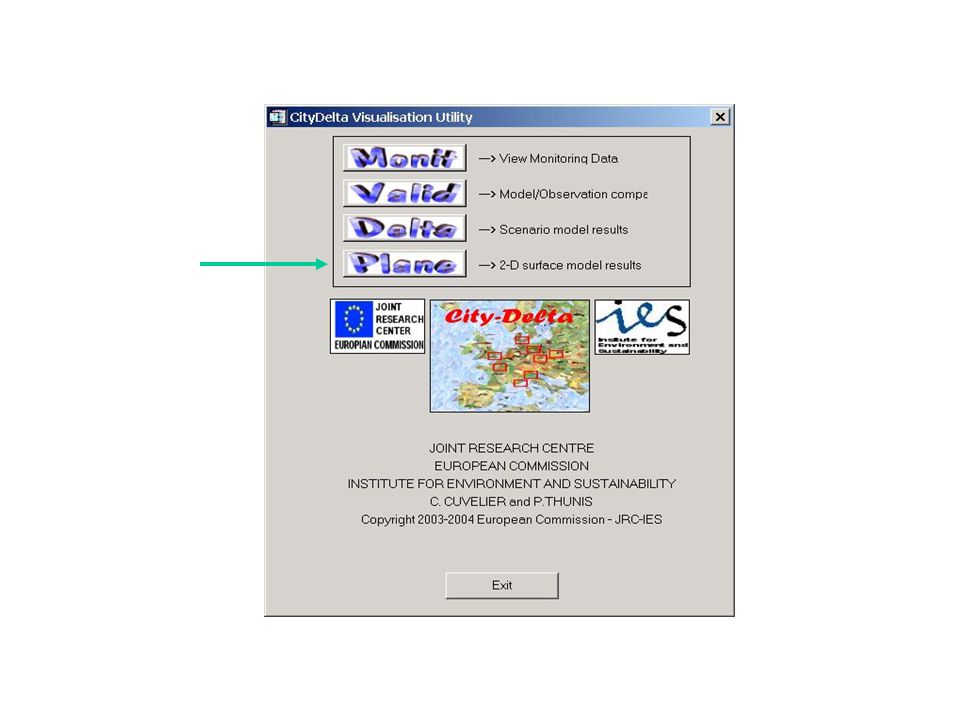
CityDelta graphical interpretation tool

8
Monitoring data

10
Validation with monitoring data

12
Deltas comparison

14
Spatial indicators & deltas

15
Interpretation of the results Modeling teams submit results to JRC JRC processes data and loads them on the Internet Participants evaluate their results individually with the tool Discussion and joint interpretation at regular CityDelta meetings Synthesis of conclusions for integrated assessment modelling

16
BerlinParisMilano London 1999 -CLE CLE -NOx MFR CLE -VOC MFR MEAN O 3

17
Deltasfor 1999-CLE, Berlin, mean O 3 Deltas for 1999-CLE, Berlin, mean O 3 82 1216

18
Deltasfor 1999-CLE, Berlin, mean O 3 Deltas for 1999-CLE, Berlin, mean O 3

19
Population-weighted mean O 3 Berlin

20
Main initial findings for long-term O 3 Emission inventories are crucial Consistent difficulties in night time model predictions (too high) Day time predictions generally have smaller bias and show less variability between models Generally, predictions vs. measurements at finer scale (down to 5 km) not significantly better than 50km scale –What does this have to say about policy tools? Do we need develop tools down to street levels? However, NO 2 predictions vs measurements are significantly better at finer scale –Does this indicate that finer scale is important for modelling titration effects?
 not significantly better than 50km scale –What does this have to say about policy tools. Do we need develop tools down to street levels. However, NO 2 predictions vs measurements are significantly better at finer scale –Does this indicate that finer scale is important for modelling titration effects .")
21
Emission inventories are crucial and uncertain Generally models underpredict concentrations, and have difficulties reproducing the seasonal variation of the observations –What are models missing (coarse fraction, SOA, representation of stable conditions, etc)? –Need a deeper review of secondary/primary components Validation against observations (PM2.5) with chemical composition is absolutely necessary Further scenarios are required before PM deltas can be analysed (CityDelta Phase 2) Main initial findings for PM
 with chemical composition is absolutely necessary Further scenarios are required before PM deltas can be analysed (CityDelta Phase 2) Main initial findings for PM.")
22
http://rea.ei.jrc.it/netshare/thunis/citydelta
Similar presentations


 Emission Projections for 2020 Results from a study for the.>")


 program: Scientific and economic assessment Markus Amann International Institute for Applied Systems Analysis.>")


