Download presentation
Presentation is loading. Please wait.

1
Water Quality Issues from Dairy Farms in the Northeast Peter Wright, State Conservation Engineer Natural Resources Conservation Service Syracuse NY Curt Gooch, PRO-DAIRY Environmental Specialist Cornell University

3
Dairy Farm Polluted Water Sources Concentrated Sources: Waste Wash water Barnyard runoff Silage Leachate Manure Storage Spreading

11
Concentrated Sources Amounts and concentrations vary daily seasonally from farm to farm They can be Managed When Rain Driven the impact is less diluted not observed

12
NP Milking Center400 ppm60 ppm Silage Leachate4,400500 Barnyard1,000200 Manure5,600900 Domestic Waste307 Concentrations

13
Annual Load from Concentrated Sources NP Milking Center3,000 lb30 lb Silage Leachate3,900440 Barnyard700150 Manure31,6005,000 Domestic Waste7022

14
Conclusions Concentrated sources need to be controlled Prevention is key Look for low cost alternatives to treatment

15
Prevention Eliminate Reduce Reuse

16
Wash Water Reduction Eliminate Leaks and Spills Manually rinse or scrape first Reuse gray water Design system for easy cleaning

17
Quantities Range1-40 gal/cow/day Typical2-5 gal/cow/day

18
Reduce at the Source Feed Milk First flush Colostrum, treated milk Scrape Manure Parlor and holding area floors Correct Soap Amounts No Precooler Water

19
Reuse Wash parlor and holding area floors Water savings Wash cycle water recycled Water savings Soap savings Heat savings

20
Treatment Aerobic – with oxygen Low odors Fast rate By products - Carbon dioxide and water

21
Treatment Anaerobic – without oxygen Odors produced Slow rate By products - plug soil pores

22
Liquid Manure System Advantages Easy Low pollution potential Helps manure flow Disadvantages More to haul Larger storage needed

23
Liquid Manure System 1,000 gal. of milkhouse wastes may contain: 1.67 lbs. Nitrogen 0.83 lbs. Phosphorus 2.50 lbs. Potassium 5.00 lbs. of nutrients @ $0.25/lb. = $1.25 Spreading costs: 1,000 gallons @ $0.005 per gal. = $5.00

24
Grass Filter Advantages Lower cost Efficient treatment Small space Disadvantages Needs O&M Extreme cold weather problems

28
Settling Tank and Pump

30
Milking Center Waste Estimated Nitrogen Fate Immobilized Soil OM 21% Denitrified30% Crop Uptake32% Leaching17% Total100%

31
Milking Center Waste Estimated Nitrogen Fate Immobilized Soil OM 68 Lbs. Denitrified98 Lbs. Crop Uptake104 Lbs. Leaching55 Lbs. Total325 Lbs.N/Acre 1.3 Lbs N/cow /year250 Cows

32
Barnyards Eliminate Reduce the size Reduce the runoff Exclude outside water Pavement increases runoff Vital to control runoff flow

33
NRCS Standard Source Control Scrape, time in barnyard, waterers Solid removal 15 minutes of 2 yr 24 hr rainfall Cleaned out Filter area larger of: 15 min. flow time for 25 yr 24 hr storm 0.5 inches deep OR 500Lbs N per acre per year

34
Abuse Areas Purpose? Increased loading Fences can be moved Image

36
Barnyards Sized correctly Clean surface water diverted Paved and curbed Runoff controlled

38
Vegetated filter strip to treat BOTH: barnyard runoff and milkhouse wastewater

39
VFS has Two Discharge Points Milkhouse wastewater P concentrations Avg - 16 mg/L, Range from 10 to 21 mg/L

40
Screens and Collector Drop Box

41
Grass VFS Performance as Percent P Removal

42
Barnyard Runoff Estimated Nitrogen Fate Immobilized Soil OM 20% Denitrified20% Volatilization20% Crop Uptake30% Leaching10% Total100%

44
Barnyard Runoff Estimated Nitrogen Fate Immobilized Soil OM 100 Lbs. Denitrified100 Lbs. Volatilization100 Lbs. Crop Uptake150 Lbs. Leaching 50 Lbs. Total500 Lbs. N/Acre

45
Barnyard Runoff Assumptions: 20 gallons manure /cow per day 32 Lbs. N/1000 gallons of manure 230 Lbs. N / cow per year Time in barnyard proportional to manure left Daily cleaning leaves 10% available to flow Settling removes 25% of N

46
Barnyard Runoff 230 Lbs. N / cow per year 10% Time in barnyard 23 Lbs. N/cow/yr. Daily cleaning leaves 10% available to flow 2.3 Lbs. N/cow/yr. Settling removes 25% of N 1.7 Lbs. N/cow/yr.

47
Pollution Prevention Eliminate Reduce Recycle

48
Barnyard Purpose? Holding Feeding or water Resting Exercise Heat detection Eliminate!!

49
Bunk Silos Storage of: Silage juice Runoff Drainage water 25 year 24 hour storm Silage leachate is very high in BOD, N and P

50
Solutions Catch and store it all –Then spread according to a NMP Roof the Storage Collect only the concentrated low flow –Treat dilute high flows in a grass filter

51
Effluent Varies Silage juice Dry matter Runoff from rainfall Outside water Amount of empty bunk area Evaporation Other commodities

52
Conclusions: Concentrated Sources Need to be Controlled Prevention is Key Look for Low Cost Alternatives to Treatment

53
Why Do We Store Manure? To reduce the need for frequent hauling and land spreading To allow land spreading at a time when soil and climatic conditions are suitable To allow nutrient application at or near the crop’s growing season

55
Spreading Costs

56
Capital Costs

57
Spreading Cost

58
Net Cost of Storage Systems

59
Basics of Separation Solid-Liquid Separator Solid Effluent (20-30% dry matter) Liquid Effluent (1-8% dry matter) Influent 1-15% dry matter Energy
 Liquid Effluent (1-8% dry matter) Influent 1-15% dry matter Energy")
60
Potential Goals of Separation Remove a portion of solids for pumping ease Reclaim separated solids for bedding Partition nutrients for application to far off fields or export Reduce the size or extend the use of a long term storage

61
Needed Information The impact of separation on Comprehensive Nutrient Management Plan (CNMP) The quantity and quality of reclaimed manure solids so accurate economic projections can be made with respect to their end use Nutrient partitioning between separated solid and liquid effluents to determine the potential for nutrient export
 The quantity and quality of reclaimed manure solids so accurate economic projections can be made with respect to their end use Nutrient partitioning between separated solid and liquid effluents to determine the potential for nutrient export")
62
Example Test Methods for Nutrients and Solids Sampling / Monitoring ParameterTest Method Total Solids (TS)EPA 160.3 Total Volatile Solids (TVS)EPA 160.4 Total Phosphorous (Total P)EPA 365.3 Ortho Phosphorous (Ortho P)EPA 365.3 Total Kjeldahl Nitrogen (TKN)EPA 351.4 Ammonia-Nitrogen (NH 3 -N)SM18 4500F Organic Nitrogen (ON)By subtraction Total Potassium (Total K)EPA SW 846 6010
EPA Total Volatile Solids (TVS)EPA Total Phosphorous (Total P)EPA Ortho Phosphorous (Ortho P)EPA Total Kjeldahl Nitrogen (TKN)EPA Ammonia-Nitrogen (NH 3 -N)SM F Organic Nitrogen (ON)By subtraction Total Potassium (Total K)EPA SW")
64
Anaerobic Digestion Systems Biological Manure and Effluent Handling Separation Gas Collection Conditioning Engine Electric Heat Management

65
Soluble organic compounds Acid forming bacteria Volatile organic acids Methane forming bacteria Biogas Stabilized low odor anaerobic effluent Hydrolysis Manure Anaerobic Digestion of Dairy Manure

68
Johnes Disease Organism

69
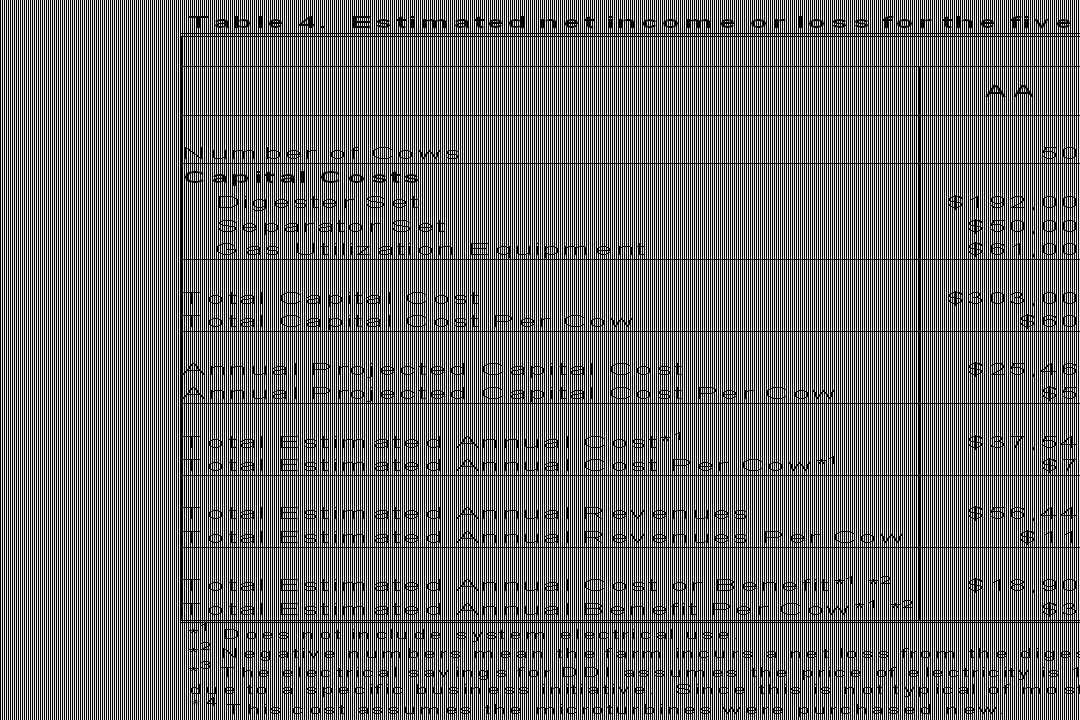
Costs for AA Dairy Anaerobic Digestion Manure Handling System (Wright and Perschke)
")
71
Centralized Digestion Advantages Economics of sale Equipment Management Disadvantages Manure transportation Electric utilization CNMP/CAFO - biosecurity

72
Anaerobic Digestion Systems Biological Manure and Effluent Handling Separation Gas Collection Conditioning Engine Electric Heat Management

73
Conclusions Alternative Systems depend on farm situation Maximize By-Product Use Maximize profits or lower costs Integrate with other enterprises More Research is Needed

74
Summary Producers generally do not know the annual cost for handling manure on their farm. The projected annual economic cost for the analyzed system is $427,000 or $127 per cow. A complete analysis should include cost of conveying manure to the SMS and the cost of applying processed effluent to crop land. A complete analysis also needs to include the nutrient value cost/benefit for the cropping enterprise.

Similar presentations


 Approach for Agriculture and Agribusiness Dec. 18, 2000 Julian Barham Barham.>")


 –45-50 kg/day/hd for dairy cow (liquid)>")


